

Calcium chloride is a compound of significant interest to many marine aquarists. Besides its potential use in formulating artificial salt mixes, it is also useful in directly supplementing calcium to aquaria. It is sold by many manufacturers for aquarists, and is also sold by companies outside of the reef aquarium hobby for a wide variety of uses, ranging from melting ice on sidewalks to formulating pharmaceuticals.
Because of these varied uses and manufacturers, aquarists wanting to use calcium chloride are presented with many options concerning its purchase. Aquarists often ask whether it is necessary or desirable to purchase the highest quality and most expensive grades of calcium chloride. Until recently, I typically answered that I did not know, but that I would avoid the lowest (least expensive) grades of calcium chloride (often called Technical, Practical, or with no grade described at all).
In a recent round of studies, I purchased several commercial brands of calcium chloride, and tested them for the impurities that I thought likely to be a potential concern. The brands tested were Warner Marine (Concentrated Calcium Supplement), ESV (Calcium Chloride), Kent (Turbo Calcium and Liquid Calcium), and Dow (Dowflake 77-80% Calcium Chloride; purchased from Home Depot). The sections below detail the impurities that were found in each of these brands. It also reviews the results in terms of how important these impurity levels might be, and compares them to each other and to the impurities that would be delivered using commercial calcium carbonate in a calcium carbonate/carbon dioxide reactor to deliver the same amount of calcium.
As a follow up article, next month I will show how to make your own two part additive using calcium chloride, baking or washing soda, and Epsom salts.
ICP Testing Methods
Feel free to skip to the last line (in bold) of this method section if testing details do not interest you.
There has recently been a significant amount of discussion in the hobby concerning analytical methods. Richard Harker has recently authored two articles that demonstrate some concerns with a particular method involving ICP (Inductively Coupled Plasma; Article 1, Article 2). In this technique, the liquid sample is injected into an incredibly hot plasma, completely breaking the sample down into individual elemental ions. There are a variety of ways to then detect these ions, including mass spectroscopy (called ICP-MS) and from the intensity of different wavelengths of light emitted from the different ions (called ICP-OES, with OES standing for Optical Emission Spectroscopy).
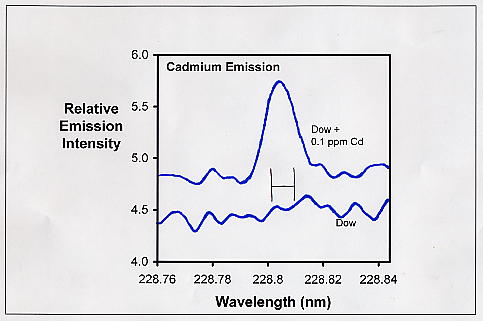
Figure 1. Emission spectrum in the region of one of the emissions from cadmium. The bottom curve represents the emission from the Dow sample. The upper curve represents this same sample spiked with 0.1 ppm cadmium. The H-shaped symbol in the middle represents the region actually integrated to collect data (between the vertical lines).
I have chosen to use ICP-OES, largely because it is the instrument that I have available (A Varian Vista-MPX). It is also the method that Richard Harker has claimed to be problematic when using a particular protocol (ICP Scan, EPA method 200.7). I share some of his concerns about the use of ICP, particularly for ions that are near their detection limits. In fact, I believe that some analyses reported in the aquarium literature using ICP-OES may simply reflect instrumental and sample noise that was added up by the software used with the instrument to report an artificially high value. I have discussed this concern in the past, for example, for aluminum.
In all ICP-OES data that I have presented in prior articles, as well as all data in this article, such issues are not a consideration for the reader. I have carefully looked at the emission data for each ion and for each sample, with my own eyes, to confirm whether the data claimed by the software is a real emission, or just noise. For all signals near the noise level, I spiked small but known amounts of commercial ICP standards into these calcium chloride solutions to see exactly how high of a concentration would have to be present in these solutions to be able to see real signals. These detection limits are often different than the detection limits stated by the instrument manufacturer (since those stated values do not take into account the nature of other interfering ions in your test sample, such as a huge background of calcium and chloride), and are shown later in the article. I have also tested the highly purified water used to dissolve the solid samples in this study. This type of protocol takes much more effort than running the sort of ICP scan that Harker has discussed. Nevertheless, it is important when trying to understand the limits of the data obtained.
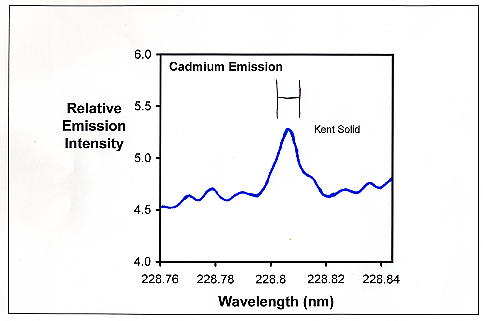
Figure 2. Emission spectrum in the region of one of the emissions from cadmium for the Kent Turbo Calcium sample. The H-shaped symbol in the middle represents the region actually integrated to collect data (between the vertical lines).
This process is shown in Figure 1. Figure 1 is a plot of the emission intensity in one of the wavelength regions expected to have emissions from cadmium. The bottom spectrum in Figure 1 is part of the emission from the Dow sample. There is no apparent peak at 228.802 nm where one expects one of the emission peaks for cadmium. However, when 0.1 ppm cadmium is added to this sample (top spectrum in Figure 1), the cadmium emission is clearly seen. Adding 0.02 ppm Cd instead of 0.1 ppm results in a smaller, but still clearly defined peak above the background noise. From those results, I conclude that the Dow sample has less than 0.02 ppm cadmium.
Figure 2 shows the cadmium emission from the Kent Turbo Calcium sample. Even without any extra cadmium added, it has a clearly defined cadmium peak at 228.802 nm. When that peak area is compared to cadmium standards, I conclude that it has about 0.07 ppm cadmium. This process was repeated for 2-3 emission peaks for each ion and for each sample. The tabulated results represent an average of these values for each ion. Table 1 shows the limits of detection that I determined using the above process for many of the ions tested in this article (for most of the other ions, the limit of detection was far below the values found).
In short, and summarized for folks that do not have much interest in instrumental methods:
Note: The data in this article do not suffer from any of the complications previously discussed by Harker and others relating to ICP, and can be considered reliable indications of what was present in the samples tested.
| Element | Published Machine Minimum Limit of Quantitation (ppm) | Estimated Experimental Limit of Detection in CaCl2 Solution (ppm) |
|---|---|---|
| Arsenic | 0.12 | 0.5 |
| Cadmium | 0.015 | 0.02 |
| Cobalt | 0.05 | 0.1 |
| Copper | 0.02 | 0.02 |
| Chromium | 0.04 | < 0.02 |
| Lead | 0.14 | 0.5 |
| Manganese | 0.003 | < 0.02 |
| Molybdenum | 0.04 | 0.1 |
| Nickel | 0.06 | 0.1 |
| Selenium | 0.37 | 0.5 |
| Strontium | 0.0002 | < 0.02 |
| Zinc | 0.009 | < 0.02 |
Sample Preparation
The samples that were liquid (Kent Liquid Calcium and Warner Concentrated Calcium Supplement) were tested as is. Samples that were solid (Dow Flake 77-80% Calcium Chloride, ESV Calcium Chloride and Kent Turbo Calcium) were dissolved in highly purified laboratory deionized water (that was itself tested for impurities) to approximately the same calcium levels found in the liquid products (about 100,000 ppm calcium, or 10% calcium by weight).
It should be noted that the Dow sample is calcium chloride dihydrate (CaCl2 * 2 H2O), while the Kent and ESV solids are anhydrous calcium chloride (CaCl2). That difference is where the 77-80% comes in with the Dow material. It is not that there is 20+% impurities there, but rather that it contains more than 20% water (the exact formula CaCl2 * 2 H2O contains 24.5% water, and the Dow material has presumably lost a bit of this water in manufacturing).
ICP Results
The results in Table 2 show the results obtained by ICP for these calcium chloride solutions. Colored entries indicate where there are significant differences between the samples (which I usually decided was at least a factor of 2 difference in impurity concentration). It is not intended to indicate that there is actually a problem with any of these values. That analysis is more complicated, and follows in later sections of this article. Some entries are shown as “< X”, which should be read as “less than X”, and indicates that the element is below the detection limit that I established for each ion. It might be slightly less than X, or it might be far, far less.
One interesting attribute emerges from these data immediately, however. The DOW, ESV and Warner products seem to have one impurity profile, and the two Kent products have a different one. This difference is particularly clear for potassium, with huge amounts in the DOW, Warner, and ESV samples, and hardly any in the two Kent products. Fortunately, there is already a very large amount of potassium in seawater, and it is not especially toxic, nor is it a concern to aquarists. There are, of course, some additional differences that will be discussed below, but this fundamental dichotomy may reflect fundamentally different manufacturing processes to arrive at calcium chloride.
| Element | Dow Solid | Kent Liquid | Kent Solid | ESV Solid | Warner Liquid |
|---|---|---|---|---|---|
| Aluminum | 0.18 | 0.15 | 0.11 | 0.19 | 0.16 |
| Arsenic | < 0.5 | < 0.5 | < 0.5 | < 0.5 | < 0.5 |
| Barium | 0.42 | 0.57 | 0.48 | 0.39 | 0.52 |
| Beryllium | 0.0013 | 0.0018 | 0.0016 | 0.0017 | 0.0011 |
| Boron | 20 | 0.4 | 0.6 | 14 | 20 |
| Cadmium | < 0.02 | 0.07 | 0.07 | < 0.02 | < 0.02 |
| Cobalt | < 0.1 | < 0.1 | < 0.1 | < 0.1 | < 0.1 |
| Copper | < 0.02 | < 0.02 | < 0.02 | < 0.02 | < 0.02 |
| Chromium | 0.04 | 0.06 | 0.10 | 0.05 | < 0.02 |
| Lead | < 0.5 | < 0.5 | < 0.5 | < 0.5 | < 0.5 |
| Lithium | 38 | < 0.1 | < 0.1 | 37 | 34 |
| Magnesium | 11 | 3 | 19 | 4 | 7 |
| Manganese | 0.01 | 0.007 | 0.02 | 0.008 | 0.005 |
| Molybdenum | < 0.1 | < 0.1 | < 0.1 | < 0.1 | < 0.1 |
| Nickel | < 0.1 | < 0.1 | < 0.1 | < 0.1 | < 0.1 |
| Phosphorus | < 0.2 | < 0.2 | < 0.2 | < 0.2 | < 0.2 |
| Potassium | 3600 | 7 | 5 | 3500 | 3200 |
| Selenium | < 0.5 | < 0.5 | < 0.5 | < 0.5 | < 0.5 |
| Silicon | 1.4 | 1.0 | 1.3 | 1.1 | 1.5 |
| Sodium | 1015 | 28 | 25 | 920 | 660 |
| Strontium | 500 | 17 | 19 | 550 | 300 |
| Vanadium | < 0.01 | < 0.01 | < 0.01 | < 0.01 | < 0.01 |
| Zinc | 0.040 | 0.011 | 0.015 | 0.015 | 0.012 |
In order to assess whether these impurities are a real issue, one must understand how much will actually be added to an aquarium, and how much of a concern the final concentration in the aquarium is to organisms in the aquarium. In order to make such an assessment, Table 2 shows the concentration that will be added in total over a year to an aquarium using these products. For this analysis, the amount delivered was set at the equivalent of 16.2 ppm calcium per day, which is equivalent of adding 2% of the tank volume in saturated limewater every day. This level would be considered to be medium to high demand for typical reef aquaria.
Table 3 also shows data on the delivery of impurities using Koralith (commercial calcium carbonate media) in a CaCO3/CO2 reactor, based on data provided in an earlier article by Craig Bingman. Greg Hiller has also analyzed other media, and I converted data from both of these articles into delivery per year values in another article.
To assist in interpreting some of these values, Table 3 shows the percentage increase over the natural seawater levels that accrue over a year. Table 4 only covers some of the major ions. I believe it would be misleading to show such data for many of the trace ions as there is little reason to believe that the concentrations of such ions in aquarium water matche natural seawater, even in the absence of any calcium chloride additions. So, for example, it might be very misleading to say that copper additions were ten fold higher than natural seawater levels, if the aquarium water might already have 100 times those levels.
For each instance where a clear distinction can be made, I have highlighted in red those values in Table 3 that are appreciably higher than the others for the same ion. Interestingly, Koralith has more of these highlights than do the calcium chloride samples. That comparison may not be complete (the calcium chloride samples do not provide alkalinity, for example, so other supplements must also be used), but it does suggest that there are many ions for which calcium chloride is not a problematic source.
Keying on those red highlights for the calcium chloride samples, some can clearly be discounted as being relatively unimportant, but others cannot. Strontium, for example, is not being delivered in adequate quantity by any of these methods to match that likely to be removed by calcification, so it is unlikely to rise to problematic levels from this source. Boron too is not being significantly raised over natural levels.
| Element | Dow Solid | Kent Liquid | Kent Solid | ESV Solid | Warner Liquid | Koralith CaCO3 |
|---|---|---|---|---|---|---|
| Aluminum | 0.011 | 0.009 | 0.006 | 0.011 | 0.009 | 1.0 |
| Arsenic | < 0.03 | < 0.03 | < 0.03 | < 0.03 | < 0.03 | 0.05 |
| Barium | 0.03 | 0.03 | 0.03 | 0.02 | 0.03 | 0.000 |
| Beryllium | 0.00008 | 0.0001 | 0.0009 | 0.0001 | 0.00006 | Not tested |
| Boron | 1.0 | 0.02 | 0.04 | 0.8 | 1.0 | < 0.006 |
| Cadmium | < 0.001 | 0.004 | 0.004 | < 0.001 | < 0.001 | < 0.005 |
| Cobalt | < 0.006 | < 0.006 | < 0.006 | < 0.006 | < 0.006 | 0.01 |
| Copper | < 0.001 | < 0.001 | < 0.001 | < 0.001 | < 0.001 | 0.1 |
| Chromium | 0.002 | 0.004 | 0.006 | 0.003 | < 0.001 | < 0.007 |
| Lead | < 0.03 | < 0.03 | < 0.03 | < 0.03 | < 0.03 | 0.1 |
| Lithium | 2.2 | < 0.006 | < 0.006 | 2.2 | 2.0 | < 0.001 |
| Magnesium | 0.6 | 0.2 | 1.0 | 0.2 | 0.4 | 14. |
| Manganese | 0.001 | 0.000 | 0.001 | 0.000 | 0.000 | 1.0 |
| Molybdenum | < 0.006 | < 0.006 | < 0.006 | < 0.006 | < 0.006 | < 0.006 |
| Nickel | < 0.006 | < 0.006 | < 0.006 | < 0.006 | < 0.006 | 0.2 |
| Phosphorus | < 0.01 | < 0.01 | < 0.01 | < 0.01 | < 0.01 | < 0.08 |
| Potassium | 210 | 0.4 | 0.3 | 210 | 190 | <0.06 |
| Selenium | < 0.03 | < 0.03 | < 0.03 | < 0.03 | < 0.03 | < 0.08 |
| Silicon | 0.08 | 0.06 | 0.08 | 0.07 | 0.09 | 1.1 |
| Sodium | 60 | 1.6 | 1.5 | 54 | 39 | 0.1 |
| Strontium | 29 | 1.0 | 1.1 | 32 | 18 | 0.8 |
| Vanadium | < 0.001 | < 0.001 | < 0.001 | < 0.001 | < 0.001 | 0.02 |
| Zinc | 0.002 | 0.001 | 0.001 | 0.001 | 0.001 | 0.3 |
| Element | Dow Solid | Kent Liquid | Kent Solid | ESV Solid | Warner Liquid | Koralith CaCO3 |
|---|---|---|---|---|---|---|
| Boron | 23 | 0.4 | 0.9 | 18 | 23 | < 0.1 |
| Lithium | 1200 | < 3 | < 3 | 1200 | 1100 | < 0.5 |
| Magnesium | 0.05 | 0.02 | 0.08 | 0.02 | 0.03 | 1 |
| Potassium | 53 | 0.01 | 0.001 | 53 | 48 | < 0.02 |
| Sodium | 0.6 | 0.02 | 0.01 | 0.5 | 0.4 | 0.001 |
| Strontium | 360 | 13 | 14 | 400 | 230 | 10 |
So what important issues exist? That is hard to say with certainty. Four ions seem worthy of further discussion: barium, cadmium, chromium and lithium.
Barium, while toxic at elevated concentrations, would not seem to pose a hazard at 0.02 – 0.03 ppm (which is only 2-3X over the natural level of 0.013 ppm). Most toxicology studies do not show effects in marine organisms until well above 1 ppm. Regulatory agencies (US and Canada) have not set a limit for barium in seawater. So I conclude that the barium levels in the calcium chloride samples are likely not a problem.
Cadmium, on the other hand, is known to be toxic at fairly low levels. Canadian Water Quality Guidelines for the Protection of Aquatic Life suggest a maximum of 0.12 ppb in seawater. [Toxicology][40] tests on marine organisms show toxic effects beginning in the 10-100 ppb range. Consequently, the delivery of 4 ppb (for the two Kent products) over the course of a year may be a concern. The other calcium chloride samples had significantly less cadmium.
Chromium is another potential concern with some of these samples. Canadian Water Quality Guidelines for the Protection of Aquatic Life suggest a maximum of 56 ppb in seawater for chromium III compounds, and 1.5 ppb for chromium VI compounds. Chromium compounds in an aquarium are likely to be chromium III as the chromium VI compounds are highly oxidizing and will rapidly react with organics and other inorganic ions to give chromium III compounds again. Consequently, the delivery of 4-6 ppb of chromium (for the two Kent products) over the course of a year is not likely a significant concern.
Lithium does not seem to pose as much of a toxicity concern as many other ions, but in three of the samples (Dow, Warner, ESV) it is greatly elevated. Over a year, each of these would add about 2 ppm lithium, or 12 times the natural level. Is that too much? I am not sure. In a prior analysis of artificial salt mixes, Craig Bingman found that two salt mixes started out with greatly elevated lithium levels (90X over natural levels for Coralife and 6X for Seachem, with the others ranging from 1.5X – 3.1X). Typical aquaria surveyed by Ron Shimek contained about 0.6 ppm of lithium (3X over natural seawater) with a range from 0.015 ppm (0.08X) – 7 ppm (39 X).
It is well known that excess lithium has significant adverse effects of the development of sea urchin embryos,1,2 and many studies have been carried out in this area. The amount of lithium used in those studies, however, is typically around 500-3,000 ppm. It has also been shown that 345 ppm of lithium will result in death of the isopod limnoria.3
So while 2 ppm lithium delivered by these samples is greatly increased over the natural levels of 0.18 ppm, it is still small compared to the hundreds of ppm required to show toxic effects. Given that gap, and the fact that the lithium levels will likely be attenuated by water changes, I conclude that the lithium in these calcium chloride samples is not an excessive risk. Nevertheless, that is something that each aquarist can decide for themselves.
Ammonia Testing
There are several ways that calcium chloride can be prepared on an industrial scale. One of these (the Solvay process) involves ammonia. Consequently, ammonia has the potential to be present as an impurity in calcium chloride. For that reason, I tested each of the calcium chloride samples for ammonia. I used two different kits to test for ammonia: LaMotte and Red Sea. The results of the Red Sea kit are shown in Table 5.
Samples spiked with ammonia (from a standard containing 5.8 ppm ammonia as ammonium hydroxide in water) did not show as much ammonia as the test kit claimed, but it was clearly detectable in the two spiked samples (Dow and Kent Turbo Calcium). These spiked samples contained an extra 1.9 ppm of ammonia. One showed up as 0.5 ppm ammonia, and the other showed as 0.5-1 ppm. Since all of the unspiked samples showed 0.5 ppm or less of ammonia by the kit, I conclude that these samples have less than 3 ppm of ammonia in them as tested (accounting for dilution).
In short, none of these samples showed enough ammonia to be concerned about, even when adding enough to boost calcium by 200 ppm in one day. Since these solutions were 100,000 ppm in calcium, adding 200 ppm calcium to an aquarium entails adding 1/500th of the tank volume. At 3 ppm ammonia in the supplement, that means that the tank will be boosted by 3/500 = 0.006 ppm of ammonia, which I believe to be largely insignificant in a reef aquarium.
| Test Fluid | DI water (mL) | 5.8 ppm ammonia standard (mL) | Total Ammonia shown by Red Sea kit (ppm) |
|---|---|---|---|
| 2 mL Dow | 1 | 0 | <0.25 |
| 2 mL Dow | 0 | 1 | 0.5 |
| 2 mL Kent Solid Solution | 1 | 0 | <0.25 |
| 2 mL Kent Solid Solution | 0 | 1 | 0.5 – 1.0 |
| 2 mL Kent Liquid | 1 | 0 | < 0.25 |
| 2 mL ESV | 1 | 0 | < 0.25 |
| 2 mL Warner | 1 | 0 | 0.25 – 0.5 |
| none | 2 | 1 | 1 |
Conclusions
While I was unable to test everything that I might like about these samples, the tests reported here should be enough to allow folks to make more informed decisions about calcium chloride. In particular, the Dow Flake 77-80% Calcium Chloride does not look to be appreciably worse than those sold by some of the aquarium supply companies. Which brand is the best? I do not believe that there is enough information presently available about the toxicity of cadmium and lithium to really say whether those that tend to have more of one or the other of these is clearly best, so I will leave that to individual aquarists to decide for themselves.
It should be noted that these results only represent the samples that I actually tested. Other batches from the same manufacturers may be different (for better or worse). Likewise, these manufacturers may switch to different sources for the calcium chloride at any time. That consideration is one reason that I do not do more such testing: it may not represent future product sold by the companies involved. Given that concern, higher grades do have more quality control checks, and so give more assurance that the product will remain of acceptable quality in the future.
I do believe that the Dow material will likely be acceptable in many applications, and for those on a tight budget, it seems like a reasonable choice. Toward that end, next month I will provide a recipe for making an inexpensive two part additive system out of the Dow calcium chloride (or any brand you prefer), baking or washing soda, and Epsom salts (magnesium sulfate).
In the meantime, Happy Reefing.
References
- Effect of lithium on ionic balance and polyphosphoinositide metabolism during larval vegetalization of the sea urchin Paracentrotus lividus. Ciapa, Brigitte; Maggio, Katia. Fac. Sci., Univ. Nice, Nice, Fr. Developmental Biology (Orlando, FL, United States) (1993), 159(1), 114-21.
- Lithium blocks cell cycle transitions in the first cell cycles of sea urchin embryos, an effect rescued by myo-inositol. Becchetti, Andrea; Whitaker, Michael. Dep. Phys. Sci., Univ. Newcastle upon Tyne, Newcastle upon Tyne, UK. Development (Cambridge, United Kingdom) (1997), 124(6), 1099-1107.
- Lithium as a substitute for sodium in Limnoria. Hinshaw, Lerner B. Univ. of S. California, Los Angeles, Physiological Zoology (1956), 29 81-5.
0 Comments