

Background and Introduction:
Plenum-based systems gained widespread acceptance after Dr. Jean Jaubert worked with the Monaco Aquarium in transporting a complete live portion of a coral reef from the Red Sea for display at the Aquarium. Dr. Jaubert worked extensively with naturally-collected coral substrates to enhance captive biological filtration in captive aquaria, and was granted a French patent for the plenum design in the late 1980s followed by a US patent the early 1990s. Based largely on the success of the Monaco Aquarium’s “Microcean” display, this plenum-based aquarium design has become one of the primary design methods used by public aquaria around the world, and for nearly a decade was almost equally popular among hobbyists maintaining home aquaria.
However, in the past several years, the “deep sandbed” design has largely supplanted plenum-based systems among US hobbyists. The reliance on a thick bed of carbonate sediments is essentially the same as that of plenum-based system, but the utility of the void space beneath those sediments has been vigorously questioned. Advocates of deep sandbeds argue that it is the sediment itself and not to presence of a void space beneath those sediments that perform the nutrient processing capacity (e.g., Toonen 2000a, 2000b). There have been numerous articles and books written in the aquarium hobby about the advantages and disadvantages of designs for each of these two recirculating systems (e.g., Adey & Loveland 1991, Tullock 1997, Auger 1999, Goemans 1999, Shimek 2001, Hovanec 2003, Delbeek & Sprung In press). There remains considerable debate about the most efficient design of a sediment bed for processing nutrients in a recirculating system, but to date these arguments have been based almost entirely on personal opinion and anecdotal evidence.
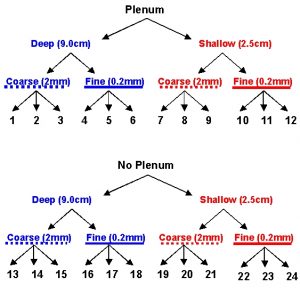
Figure 1a: Schematic of aquarium design experiment to compare directly the effects of the presence or absence of a plenum, the depth of the sediment bed, and the mean particle size of sediments in recirculating aquarium systems.
Despite the diversity of opinions on the subject, virtually all public aquaria continue to follow the plenum-based tank design. Among home aquarists, the “Berlin” and “Jaubert” systems tend to be the most common design used in Europe, and the “Deep Sandbed” and “Miracle Mud” systems tends to be more popular in North America. Likewise, the ideal sediment particle size, the depth of the sediment bed, and the presence or absence of a void-space beneath the sediment bed are all hotly debated in the popular literature (reviewed by Goemans 1999, Toonen 2000a,b, Shimek 2001).
However, there has never been a comparative experiment to determine the relative effects of sandbed depth, particle size and whether or not the presence of a void space beneath the sediments confers any advantage relative to the presence of the sediments themselves. Despite the widespread utility of these methods to academic institutions, museums, public aquaria, and hobbyists at home, there has never been a systematic test of the relative nutrient processing capacity of sandbeds of various depths and grain sizes with and without a plenum beneath them. We are the first to complete a study of this sort and have just published our findings in the journal Aquaculture (Toonen & Wee 2005). In this two part series we will explain our experiments, and present the results of this experiment to scientifically examine the relative contribution of: (1) a plenum void-space (sandbed with or without plenum); (2) the sediment depth of the bed (2.5 versus 9.0 cm); and (3) the mean particle size of sediments in the bed (2.0 versus 0.2 mm mean particle diameter) to their nutrient processing capacity and performance as a lone filtration method for recirculating aquaria.
Experimental Methods & Materials:
a) Aquarium set up and nutrient dosing
We set up a factorial design experiment with three replicate nano-tanks (27 cm long x 17 cm wide x 30 cm high) for each factor: with or without plenum, deep or shallow, and coarse or fine sediments for a total of 24 experimental aquaria (Fig. 1a,b). The entire experiment was run in a temperature-controlled environmental chamber set to 25ºC (~77ºF) that was maintained in the dark except for a single overhead fluorescent light that was turned on only when we performed our water testing. Treatments were assigned to aquaria by use of a random number generator; if an aquarium was already assigned to a previous treatment, another random number was drawn until all treatments were assigned to a single aquarium.

Figure 1b: Photographs of the aquaria used in this experiment.
The deep sandbed (no plenum) treatments had sediments deposited directly onto the aquarium bottom. Plenum treatments had sediments suspended on a plate constructed from fine nylon shade cloth attached to a 1cm plastic “egg crate” light diffusion grating with hot-melt glue. This plate was suspended 1.5cm from the bottom of the tank by five ½” ID diameter PVC rings attached with hot-melt glue to each corner of the plate and one in the center. Wet sediments were deposited carefully onto this plate prior to addition of water to the aquaria to minimize any sediments percolating through the nylon mesh into the plenum void space.
Deep sediments treatments contained 9.0 L (~2.4 gallons) of wet sediment to provide a constant depth of roughly 9.0 cm (~3.6″). Shallow sediment treatments contained 2.5 L (~0.7 gallons) of wet sediment to provide a constant depth of roughly 2.5 cm (~1″). Florida crushed coral gravel (#0, mostly oblong, averaging ~2x4mm, with a mean particle diameter ~2.0 mm) was used for the coarse sediments and Southdown Tropical Play Sand (mean particle diameter ~0.2 mm) was used for fine sediments. Fifty pounds (~23 kg) of each type of sediment were purchased from a local petshop in Sacramento, CA and autoclaved prior to use. Autoclaved sediment of each type was placed into a separate container held in a single large holding tank. The holding tank was filled with 400 L (~106 gallons) of 2.0?m-filtered natural seawater and 30ml of homogenized frozen squid (Loligo sp.) was added as a nutrient source to facilitate growth of bacteria on the sterile sediments. Sediments were well mixed by hand every other day for eight weeks until ammonia readings in the holding tank were undetectable.
After sediment treatments had been placed in each tank, 8.0L (~2.1 gallons) of 2.0?m-filtered natural seawater was trickled into each aquarium to prevent any disturbance of the sediment beds. Water was circulated in the aquaria using a Catalina Aquariums CAP-180 powerhead set to 50% (roughly 50 gallons or 189 L / h) flow placed at the end of each aquarium such that the top of the powerhead was even with the surface of the aquarium water. 3M ammonium chloride (NH4Cl) was added to each tank the following day to a final concentration of 8mg NH4+ / L. 21 days after the initial dose to8mg NH4+ / L, dosing resumed with 3M NH4Cl at the rate of 0.5 mg / L / day.
Because we realize that these numbers mean nothing to most hobbyists, we want to place this in the context of a real aquarium bioload. Tropical reef fish release an average of ~0.5 ± 0.1 ?M ammonia / g / hr, and a 3″ yellow tang weighs approximately 10.5 ± 2.2g. Thus, our addition of 0.5 mg/L/day in a tank with 8 L (2.1 gallons) of water is roughly equivalent of 2 adult yellow tangs in that tank! Most well-stocked reef aquaria produce much less than 0.5 mg NH4+ / L / day – this level is closer to high-density aquaculture systems which typically generate 0.6 – 2.0 mg NH4+ / L per day (Tseng & Wu 2004).
After the initial “cycling” period with squid paste, the sediments were rinsed with 2.0?m-filtered natural seawater, and distributed among the test aquaria. The experiment was then run for 111 days without any water exchange. To account for evaporation within experimental aquaria, deionized distilled water was added to reduce the salinity to ~53mS after each testing period.
b) Aquarium water testing
All tanks were initially filled from a large holding tank of well-mixed natural seawater, and a single 50ml sample of this water was collected and frozen at -80°C until water analyses were completed at the end of the experiment. Likewise, a single 50ml sample from each aquarium was collected at the end of the experiment and also frozen at -80ºC. At the completion of both portions of the experiment (the live animal experiment will be discussed in detail in Part 2 of this series), all water samples were transported frozen to the University of Hawaii at Manoa and water nutrient concentrations were determined using colorimetric methods on a Technicon AutoAnalyzer as outlined in Laws et al. (1999).
Each experimental aquarium was also tested at least twice per week for salinity, pH, ammonia, nitrite, nitrate, oxygen, phosphate, calcium, alkalinity, and organics using standard aquarium testing equipment from an online aquarium supplier. Salinity was determined using an electronic PinPoint salinity meter (calibrated to 53.0 mS using IAPSO seawater) and pH was measured with the electronic PinPoint pH probe (after 2-point calibration to 7.0 and 10.0). All other water parameters were measured using standard Salifert aquarium test kits compared to colorimetric standards. Comparisons of the nutrient concentration in initial and final water samples determined by AutoAnalyzer to the results obtained from the Salifert aquarium test kits were sufficiently well-correlated (r2 = 0.75, F = 64.53, P < 0.001) to use the aquarium test kit values as a relative measure of aquarium nutrients throughout the experiment.
c) Statistical analyses
If you are not familiar with statistics at all, you will probably want to skip this section. It won’t stop you from being able to read the rest of the article, but we present the details here for those readers who want to know how the analyses were done.
All statistical analyses were carried out using an Analysis of Variance as implemented in JMPin ver. 4.0.2 Academic Version (SAS Institute Inc.). We first confirmed conformity to assumptions of normality using Shapiro-Wilks, and homogeneity of variance using Bartletts test (? = 0.01) as implemented in JMP. The full ANOVA model used as the presence or absence of a plenum, the mean particle size of sediments, the depth of the bed and interactions among them as fixed effects; the salinity, pH, ammonia, nitrite, nitrate, oxygen, phosphate, alkalinity, and calcium were measured as response variables. Significant differences among treatment
pairs (plenum vs. none; fine vs. coarse particles; deep vs. shallow sediments) were determined for each response variable through effect tests as implemented in JMP. Data were plotted using PSI Plot ver, 7.01 (Poly Software International, Inc.).
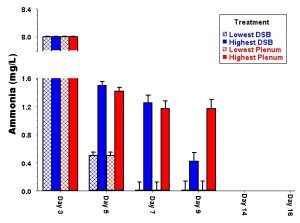
Figure 2: Variation among treatments through time in identical tanks set up without animals in the aquarium dosing experiments. Note that the lowest and highest value for each treatment is more different than the average value of all aquaria included in that experimental treatment.
Experimental versus anecdotal evidence:
In our opinion, the lack of comparative experiments to evaluate alternative approaches is a serious short-coming throughout the aquarium hobby. There are as many different approaches to aquarium keeping as there are aquarists with successful tanks. However, without controlled and replicated experiments, ultimately we know nothing more than something IS possible; we do not know whether the exact same tank set up in the exact same way by the same person would give a completely different result each time. That is why researchers go through the effort to include proper controls and replication in their experiments: we need to determine whether the variation between treatments set up in the same way is less or greater than treatments set up differently. This is particularly true in the case of a complex biological system such as an aquarium. Human beings have a remarkable capacity to delude ourselves, which is why medical researchers spend so much time worrying about the placebo effect. In fact, research has shown that any meeting between a conscious patient and a doctor has the potential of initiating a measurable placebo effect (Hróbjartsson 1996). Because it is virtually impossible to obtain a reliable control (no placebo) in medical experiments, the effects of drugs are now always tested against placebo administration instead. This is because even without any active ingredient, many people show dramatic improvement after “treatment” with a placebo drug because they believe they should be better (e.g., Hróbjartsson 1996). Given that humans are capable of convincing themselves that a disease is cured by pills that contain no active ingredients, it is not surprising that so many people are convinced that some additive or tank treatment is responsible for their tank suddenly thriving.
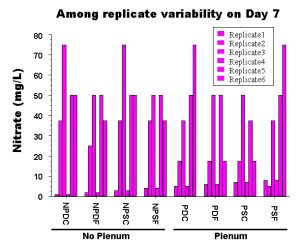
Figure 3: Actual values from 6 replicate aquaria seven days after the initial cycling period was completed. Obviously there is more variation within tanks set up in the same way than there is among the average value for each treatment.
Along those lines, aquarists across the world have spent countless hours arguing the relative pros and cons of various aquarium designs. Passion for our hobby is good, but these arguments are meaningless and a waste of time; it is impossible to make an informed decision on the best way to set up an aquarium without real DATA to evaluate how different options perform. It is critical to have data because there is always variability among experiments (see Fig. 2). A given outcome is only predictable if the variation within treatments is less than the variation from one treatment to the next. We know this may not make sense right now, but let’s work through a simple example to explain why it is so important. Let’s say you set up one tank with a canister filter and one tank with an undergravel filter and find that the tank with the canister filter looks best. From that point on, you try to set up the exact same system ten times, and some of them look better than the original and some look even worse than the original tank based on the undergravel filter. If there is that much variation from one tank to the next, it is impossible to say for sure that the differences between the filters actually have anything to do with the ultimate success or failure of your aquarium.
This may sound like an extreme example, but this is exactly what happens in reality and is clearly demonstrated in our experiments. Even in the lab, identical aquariums set up from a single well-mixed pool of gravel and seawater without any live animals in them show a dramatic amount of variation among trials (Fig. 3). I’m sure you can imagine how much more variation there would be among tanks set up by different people in different locations and with different materials and animals! It is only by having properly replicated experiments that we can evaluate whether the treatment itself has any effect, or whether the differences among tanks are simply due to random chance. If you cannot repeat the effect that you are trying to create, then the effect obviously has little to do with the treatment that you have applied. This is one of the problems with the hobby: we too often take a single example of a successful aquarium as “proof” that some miracle design or additive really works well. However, more often than not, when you as a home aquarist try to reproduce the spectacular effect of a given aquarium, the result is considerably less spectacular. This failure is not necessarily your fault, and in fact even the person who set up the original tank will probably not be able to exactly duplicate their own success.
Hopefully, you have followed this example, because the question we really need to answer is whether the average of several replicate tanks set up or treated in the same way all do better than the average of several replicate tanks without that additive or set up in a different manner. It is only when you have this kind of replicated data against which to compare the final outcome that you can determine whether or not any additive or tank design really works! The frequent posts to the effect of “My tank has never looked better” after adding Product X to my reef tank should always be viewed as the unsubstantiated opinion that it is. As Larry Jackson said in his presentation at MACNA – the phrase “My tank has never looked better” should never be uttered again!
Our Experimental Results
a) Aquarium dosing experiments
Time-series of ammonia, nitrite and nitrate concentrations in aquaria showed little difference among treatments (Figs. 4-6). After the initial 21d, there were no significant differences among ammonia, nitrite, nitrate, pH or salinity measured for any treatments through the end of the experiment. Analyses of variance also revealed no significant differences among the final concentrations of ammonia, nitrite, nitrate, oxygen, organics or salinity, nor were there any significant interactions among experimental treatments for any of these water parameters. However, there were significant differences among treatments for each of the remaining water parameters (Figs 7,8,9): pH, phosphate, alkalinity and calcium. By the end of the experiment, pH was significantly higher in aquaria with fine (7.98 ± 0.01 SE) than coarse (7.91 ± 0.01 SE) sediments (df = 1, F = 10.31, p < 0.01). Alkalinity was significantly higher in tanks with fine (2.36 meq / L ± 0.08 SE) than with coarse (1.80 meq / L ± 0.08 SE) sediments (df = 1, F = 23.21, p < 0.001), and tanks with plenums (2.20 meq / L ± 0.08 SE) than without plenums (1.99 meq / L ± 0.08 SE) (df = 1, F = 4.86, p < 0.05). In contrast, phosphate ended up significantly higher in aquaria with coarse (0.32 mg / L ± 0.01 SE) than fine (< 0.01 mg / L ± 0.01 SE) sediments (df = 1, F = 211.37, p < 0.001). No other source variables or interaction terms were significant for final pH, phosphate, or alkalinity values. Finally, calcium levels in the experimental aquaria were significantly different among depth and sediment particle size treatments, and there were significant interactions between the presence of a plenum and both particle size and sediment depth (Table 1). This more complex effect on final calcium levels means that factors such as particle size and depth of the bed have different effects when a plenum is absent than when it is present.

Figure 6: Time series plot of the mean nitrate concentration (mg / L) in experimental aquaria.

Figure 5: Time series plot of the mean nitrite concentration (mg / L) in experimental aquaria.

Figure 4: Time series plot of the mean ammonia concentration (mg / L) in experimental aquaria.
Table 1: Analysis of variance for final calcium levels with respect to the presence or absence of a plenum, the mean particle size, and sediment depth in aquarium dosing experiments. Treatments that have a significant effect on the final calcium level in the aquaria are highlighted in bold.

Figure 7: Comparison of final nutrient concentrations in experimental aquaria with and without plenums. Bars represent the mean concentration among tanks with (blue cross-hatch) and without (red cross-hatch) a plenum beneath the sediments. Error bars are standard errors among replicates, and parameters that show a significant difference between a DSB and plenum design are flagged with an asterisk. Salinity is measured in mS, alkalinity in meq, and organics are presented as a relative colorimetric measure. Nitrate, calcium, oxygen, ammonia, phosphate and nitrite are all presented in mg / L.
| Source | Df | MS | F | P-value |
|---|---|---|---|---|
| Plenum or not | 1 | 16.67 | 0.02 | 0.88 |
| Particle size | 1 | 4816.67 | 6.97 | 0.02 |
| Sediment depth | 1 | 4266.67 | 6.17 | 0.02 |
| Plenum x particle size | 1 | 4816.67 | 6.97 | 0.02 |
| Plenum x bed depth | 1 | 4816.67 | 6.97 | 0.02 |
| Particle size x bed depth | 1 | 266.67 | 0.39 | 0.54 |
| Plenum x particle size x depth | 1 | 1666.67 | 2.41 | 0.14 |
| Overall model | 7 | 2952.38 | 4.27 | 0.007 |
| Error | 16 | 691.67 |
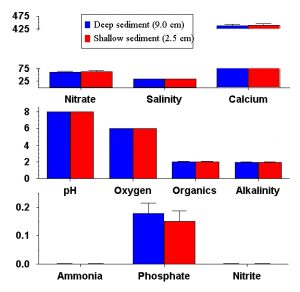
Figure 8: Comparison of final nutrient concentrations in experimental aquaria with deep (9.0cm) and shallow (2.5cm) sediments. Bars represent the mean concentration among tanks with deep (blue) and shallow (red) sediments. Error bars are standard errors among replicates, and none of the parameters show a significant difference between deep and shallow sediments. Salinity is measured in mS, alkalinity in meq, and organics are presented as a relative colorimetric measure. Nitrate, calcium, oxygen, ammonia, phosphate and nitrite are all presented in mg / L.
Discussion & Conclusions:
Public aquaria and hobbyists at home have long used recirculating systems based on some form of sediment filtration to aid in the processing of nitrogenous wastes produced by tank inhabitants (reviewed by Delbeek & Sprung 1994a,1994b,in press, Carlson 1999, Borneman & Lowrie 2001, Toonen 2002). The design of these sediment filtration units for recirculating systems to culture coral reef organisms fall largely into a few major types: berlin, plenum and sandbed-based systems. However, these systems can be viewed a continuum from virtually nosediment and complete reliance on live rock and protein-skimming in Berlin systems, to extreme amounts of sediment and no skimmer with some deep sandbed systems. Despite the diversity of opinions on the value of these designs, the relative utility of each of these types, and the most effective means to design them are still a subject of considerable controversy (reviewed by Goemans 1999, Shimek 2001, Toonen 2000a,b). There have been some studies to compare the relative performance of a given design (e.g., Paletta & Hildreth 1997, Auger 1999, Frakes 2000, Paletta 2000, Hovanec 2003), however to date these studies have been unreplicated and at most they show results based on comparisons from a single aquarium of each design. As we have shown above, even in this experiment set up in a laboratory without any live animals and with ammonia dosed in to simulate an identical bioload among tanks, there is far too muchvariability (Fig. 2) to draw any conclusions based on a single tank. We reiterate the point made by many authors before us: we need experimental rather than anecdotal evidence to draw any conclusions about the relative advantages of any particular aquarium design or additive.
The varied opinions and continuous debate of this subject were what led us to begin this experiment, and here we finally present experimental data that directly compare a variety of recirculating aquarium designs. We performed a controlled and replicated factorial design experiment to determine the relative effect of the presence or absence of a plenum, the depth of the sediments and the size of the particles in the sandbed on the concentration of nutrients in the aquarium. Putting aside all the rhetoric and opinions, our experiment shows that the presence of a plenum has no measurable benefits over simply depositing the same sediments directly on the bottom of the aquarium (at least over the few months that we tested).

Figure 9: Comparison of final nutrient concentrations in experimental aquaria with coarse (2.0mm mean diameter) and fine (0.2mm mean diameter) particles. Bars represent the mean concentration among tanks with coarse (purple) and fine (green) sediments. Error bars are standard errors among replicates, and parameters that show a significant difference between particle sizes are flagged with an asterisk. Salinity is measured in mS, alkalinity in meq, and organics are presented as a relative colorimetric measure. Nitrate, calcium, oxygen, ammonia, phosphate and nitrite are all presented in mg / L.
In terms of processing nitrogenous wastes from aquarium inhabitants (specifically ammonia, nitrite and nitrate), none of the experimental treatments (plenum vs. sandbed; deep vs shallow; coarse vs. fine) appeared to have a significant advantage (Figs. 7-9). After an initial stabilization period, all experimental treatments responded equivalently to continuous ammonia input of up to 0.5mg NH4+ / L / day. As mentioned above, this input rate is roughly equivalent to a high-density aquaculture system, and is likely above that of even the most heavily stocked reef aquaria. The significant differences among treatments in this experiment did not involve these nitrogenous wastes at all, and were instead related primarily to the buffering capacity of the sediments on the recirculating tank water (Figs. 7-9). The interaction of the depth and particle size of the sediment bed made the greatest difference to the overall performance of the system throughout these experiments, and the presence or absence of a plenum beneath those sediments showed no significant effect in any experimental parameter measured (Fig. 7).
None of the systems appeared to reach their maximum processing capacity for nitrogenous wastes, because within two weeks of the start of each experiment, no ammonia or nitrite was detectable in the aquarium water through the end of the experiment (Figs. 4-5). Likewise, the rate of increase of nitrate in the experimental tanks was far less than the rate of addition to the aquaria (Fig. 6). Thus, each sediment filtration design tested herein appeared capable of handling thetest bioload, and there did not appear to be any significant benefits for aerobic nitrogenous wasteprocessing derived from any of these various experimental designs.
Denitrification must have occurred in all experimental treatments, because nitrate concentrations did not continue to climb throughout either the dosing (Fig. 6) or live animal (discussed in detail in Part 2 of this series) experiments.
Despite continued addition of NH4+ at a rate of 0.5mg / L / day in this experiment, which was metabolized quickly enough to keep ammonia and nitrite at undetectable levels(Figs. 4-5), nitrate concentration in each tank was maintained at a fairly constant level throughout the latter 60 days of the experiment (Fig. 6). However, similar to the results seen with ammonia and nitrite processing, there was no significant differences in the ability of any of the experimental treatments (plenum vs. DSB, deep vs. shallow, or coarse vs. fine sediments) to reduce nitrate in these closed systems.
The significant differences among the experimental treatments were almost entirely in the buffering capacity of the sediments rather than the biological breakdown of nitrogenous waste products. The largest differences among the treatments were seen in the final concentration of phosphate: coarse sediment treatments had roughly 17 times the final concentration of aquaria in fine particle treatments! Because we did not sieve the various particle sizes from a single source, however, we cannot say that the differences in buffering are a result of the particle size alone. In fact, the differences seen in Figure 9 may derive entirely from differences in the chemical make-up of the sediments chosen for the experiment rather than a direct consequence of particle size. Further experimentation will be required to figure out why the phosphate concentration in coarse sediment trials were so high, but regardless of the ultimate cause, we recommend that hobbyists test the solubility of their chosen gravel before adding a large volume to their reef aquarium.
Summary:
- Our experiment shows no evidence for any of the espoused benefits of a plenum (reviewed by Goemans 1999). Instead our results suggest that any benefits seen are a direct consequence of the presence of the sediments themselves rather than the void space beneath it.
- We show that even among identical tanks set up in a laboratory without any live animals, there can be dramaticdifferences in performance from one aquarium to the next (see Figures 2 & 3 above). Our results highlight the problem with any study lacking proper replication, and in which there are no controls. We argue that anecdotal evidence is simply presentation of an opinion in cases such as this, and more than 5 years of heated debate has resulted from the staunch defense of these opinions.
- We urge hobbyists to develop a good ‘BS’ detector that will allow you to question information presented to you without any experimental evidence to support it.
In Part 2, we will present the completion of this experiment in which we now look at the performance of each aquarium design with the full complement of natural sandbed infauna, live rock, fish and invertebrates included in the design.
Acknowledgements
This research was funded in part by a Program Development Award to RJT from Hawaii Sea Grant. Additional funding came via donations from Reed Mariculture, Catalina Aquarium and my very understanding wife, Carol Fong. Water testing was performed by Saipologa Toala and Houston Lomae as part of a Pacific Islander
Undergraduate Mentorship in Environmental Biology (UMEB) internship, and we greatly appreciate their diligence and hard work assisting with this project. This manuscript was improved by discussion and comments from Eric Borneman, Anthony Calfo, Charles Delbeek, Tom Frakes, Richard Harker, Tim Hovanec, Larry Jackson, Julian Sprung and the many other excellent aquarists at the XVI Marine Aquarium Conference of North America.
References
- Adey WH, Loveland K (1991) Dynamic Aquaria: Building Living Ecosystems, Academic Press, San Diego, CA
- Auger P (1999) The quantitative comparison of two nutrient removal systems. St. Mary’s College, St. Mary’s City, MD
- Borneman EH, Lowrie J (2001) Advances in captive husbandry and propagation: An easily utilized reef replenishment means from the private sector? Bulletin of Marine Science 69:897-913
- Carlson BA (1999) Organism responses to rapid change: What aquaria tell us about nature. American Zoologist 39:44-55
- Delbeek JC, Sprung J (1994a) The Reef Aquarium, Vol. 1, Ricordea Publishing, Coconut Grove, FL
- Delbeek JC, Sprung J (1994b) The Reef Aquarium, Vol. 2, Ricordea Publishing, Coconut Grove, FL
- Delbeek JC, Sprung J (In press) The Reef Aquarium, Vol. 3, Ricordea Publishing, Coconut Grove, FL
- Frakes T (2000) EcoSystem Aquarium Comparison, SeaScope Vol. 17
- Goemans B (1999) Live Sand Secrets – A Dialog on Living Sand Filtration, Marc Weiss Companies, Inc.
- Hovanec TA (2003) A comparison of coral reef filtration systems: preliminary results. SeaScope 20:1-3
- Hróbjartsson A (1996) The uncontrollable placebo effect.European Journal of Clinical Pharmacology 50:345-348
- Laws EA, Ziemannb D, Schulman D (1999) Coastal water quality in Hawaii: the importance of buffer zones and dilution. Marine Environmental Research 48:1-21
- Paletta M (2000) The EcoSystem Aquarium Revisisted: Checking In After Two Years Aquarium Fish Magazine, February 2000
- Paletta M, Hildreth R (1997) The EcoSystem Filtration System SeaScope Vol.14
- Qian P-Y, Wu MCS, Ni IH (2001) Comparison of nutrients release among some maricultured animals. Aquaculture 200:305-316
- Shimek R (2001) Sand Bed Secrets: The common-sense way to biological filtration, Marc Weiss Companies, Inc.
- Toonen R (2000a) Are Plenums Obsolete? Another viewpoint, Part 1. Freshwater and Marine Aquarium (FAMA) 23:44-66
- Toonen R (2000b) Are Plenums Obsolete? Another viewpoint, Part 2. Freshwater and Marine Aquarium (FAMA) 23:44-70
- Toonen, Rob (2002) Ask the Reefer: The history of reef aquarium-keeping. Tropical Fish Hobbyist, #558, pp. 168-178.
- Toonen R, Wee C (2005) An experimental comparison of sediment-based biological filtration designs for recirculating aquarium systems. Aquaculture in press
- Tseng K-F, Wu K-L (2004) The ammonia removal cycle for a submerged biofilter used in a recirculating eel culture system. Aquacultural Engineering 31:17-30
- Tullock JH (1997) Natural Reef Aquariums, Vol. Microcosm Ltd., Shelburne, Vermont

0 Comments