

In my earlier articles [1,2], I evaluated data on used metal halide (MH) lamps in an effort to get a better understanding of how lamps age over time, with an intent to help the aquarists answer the question – How often should metal halide lamps be changed ? and getting a sense of what changes occur in light output of MH lamps over time. At that time, due to the difficulties of obtaining the data on the same lamp at various points in its life, getting a large enough sample, the length of time such a study would take among other reasons, used lamps sent in by several aquarists were tested, and spectral data was collected on these lamps. This provided some interesting insight in how lamps age, and the data collected established 2 two important finding – a) the spectrum of the lamp shifts downward over time, b) the blue portions of the spectrum deteriorate faster than the yellow and red portions of the spectrum. The drop in spectral output at each wavelength results in the reduction of the photosynthetic available radiation (PAR) measured as Photosynthetic Photon Flux Density (PPFD) in units of micromoles/m2/sec, and the differential changes in spectral output caused by output of blue portions dropping more than the yellow and red results in the change in the correlated color temperature (CCT) of lamps towards lower numbers.
Not knowing the initial spectral distribution of each lamp was a limitation of the earlier study. Over the last few years, I have been collecting long term data on several lamps in use over my aquarium and the aquarium at Penn State University. The initial goal was to track the spectral data of multiple lamps of the same brand, over several equally spaced time intervals. However, this was easier planned than executed. Due to the long term nature of this project, the time conflicts, availability of instrument, loss of data made it difficult to execute the experiment as initially planned. However, I was able to sample enough data points to provide meaningful data. This article presents the results from this study over several years with 3 different brands of lamps. Table 1 below provides the data on the lamps.
| Lamp | # of Lamps | Ballast Used |
|---|---|---|
| 400W XM 10000K | 4 | Magnetic (M59) |
| 400W EVC 10000K | 4 | Magnetic (M59) |
| 400W GIESMANN CORAL | 3 | Electronic – ICECAP |
XM Mogul 400W 10000K
Four new XM 400W lamps were purchased from Hellolights.com and installed on the Penn State Aquarium, in the typical manner that most aquarists replace lamps. New lamps, straight from the box on to the lighting fixtures over the aquarium. The lamps were operated by standard magnetic (ANSI M59) ballasts, and lit for 12 hours/day. Before using the lamps, the spectral output was measured, and the data collected is shown in table 2, and the spectral distribution is shown in figure 1.
| Lamp | Ballast | Power | Voltage | Amps | PPFD | CCT | Efficiency |
|---|---|---|---|---|---|---|---|
| XM 400W Lamp #1 0 hrs | M59 | 467 | 119.9 | 4.13 | 208.4 | 11614 | 0.446 |
| XM 400W Lamp #2 0 hrs | M59 | 492 | 119.6 | 4.36 | 224.4 | 10142 | 0.456 |
| XM 400W Lamp #3 0 hrs | M59 | 462 | 119.9 | 4.12 | 202.3 | 10661 | 0.437 |
| XM 400W Lamp #4 0 hrs | M59 | 488 | 120.1 | 4.3 | 218.3 | 11347 | 0.447 |
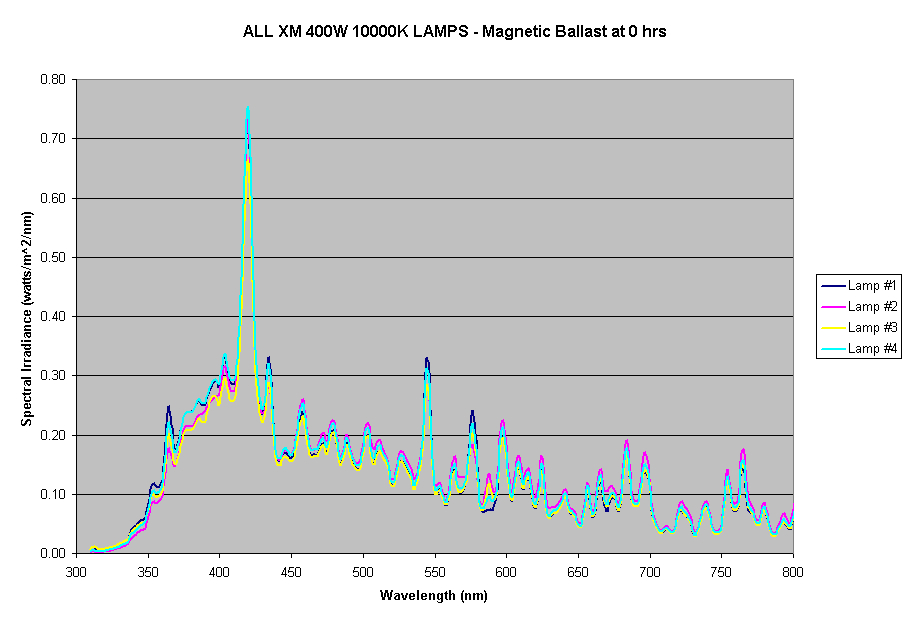
Figure 1. All XM 400W 10000K Lamps on Magnetic Ballasts at 0 hrs of use
It is interesting to note, that there is agreement in output between the 4 lamps. Some variations are always to be expected with metal halide lamps, but the differences in this case are within 10%. Another interesting point is to note that the PPFD values that are higher also show an increased use of power consumed.
The initial plan for these lamps, was to measure the output when they were put into use and then measure the final output when the lamps were replaced. Based on my past experiences with metal halide lamps, the plan was to replace these at 15 months of use. During the course of the use of these lamps, lamp #3 had a catastrophic failure of the outer envelope within the first few weeks of use. Lamp #4, failed to start after a few months of use. So I was left with just two working lamps.
These two lamps were removed from service at 17 months of use. The performance data for these lamps is shown in table 3, and the spectral plots are shown in figures 2 and 3.
| Lamp | Ballast | Power | Voltage | Amps | PPFD | CCT | Efficiency |
|---|---|---|---|---|---|---|---|
| XM 400W Lamp #1 17m | M59 | 533 | 122.4 | 4.58 | 211 | 7518 | 0.395 |
| XM 400W Lamp #2 17m | M59 | 570 | 121.3 | 4.92 | 250 | 6853 | 0.438 |
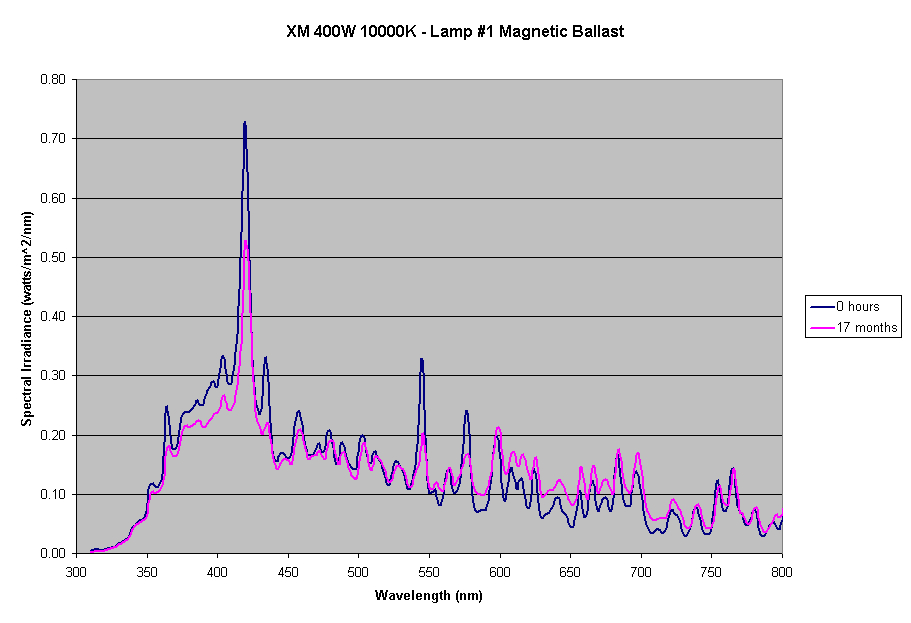
Figure 2: Spectral Plot for Lamp #1 at 0hr and after 17 months of use
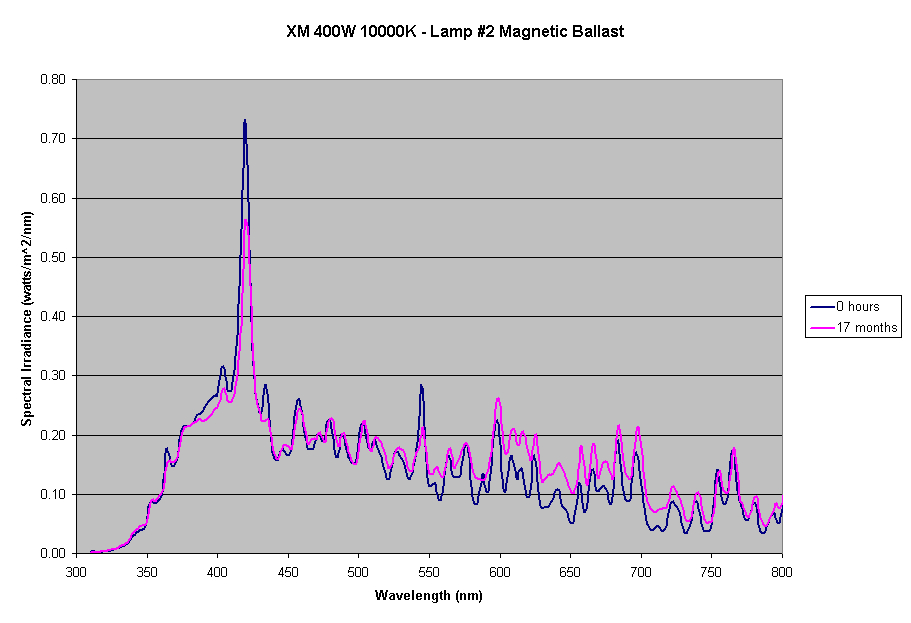
Figure 3: Spectral Plot for Lamp #2 at 0hr and after 17 months of use
The data showed some surprising information. The output PPFD of the lamps showed a slight increase in one of the lamps, while the other stayed almost the same. If one were to use a quantum meter to measure the output to determine if the lamp should be changed, it would show little change in output even after 17 months of use. The spectral plot shows where the changes occurred over time, and as expected there is a drop in the blue spectral region, but there was an increase in the spectral range from green to the reds, which made up for the lost output in the blue region. This also clearly shows in the drop in color temperature from the 10000-11000K range when new to 6000-7000K range after 17 months of use. Further analysis of the data showed that while there was little drop in the PPFD, there was a significant increase in the power being consumed by the used lamps. The power consumption increased between 60-70 watts. As observed with MH lamps the output tends to increase with increase in power consumption. From a visual perspective, there was very little change in most of the corals’ color or visual look of the tank. The blue color of the corals did fade somewhat.
EVC Mogul 400W 10000K
Four EVC 400W 10000K lamps were purchased and installed on the Penn State Aquarium. The lamps were used for 12hrs/day for 13 months. Table 4 shows all the data collected over the life of these lamps. Figures 4 and 5 show the spectral plots of the lamps at various points in the life of the lamps.
| Lamp | Ballast | Power | Voltage | Amps | PPFD | CCT | Efficiency |
|---|---|---|---|---|---|---|---|
| Lamp #1 0 hrs | Magnetic (m59) | 503 | 122.5 | 4.32 | 205.4 | 7168 | 0.408 |
| Lamp #2 0hrs | Magnetic (m59) | 502 | 122.8 | 4.29 | 209.9 | 7197 | 0.418 |
| Lamp #3 0hrs | Magnetic (m59) | 488 | 122 | 4.27 | 209.3 | 8718 | 0.429 |
| Lamp #4 0hrs | Magnetic (m59) | 502 | 122 | 4.34 | 238.9 | 7559 | 0.476 |
| Lamp#1 3 months | Magnetic (m59) | 548 | 123.5 | 4.61 | 224 | 7538 | 0.409 |
| Lamp#2 3 months | Magnetic (m59) | 519 | 124.3 | 4.37 | 230.9 | 7002 | 0.445 |
| Lamp#3 3 months | Magnetic (m59) | 504 | 124.3 | 4.25 | 211.3 | 7998 | 0.419 |
| Lamp#4 3 months | Magnetic (m59) | 557 | 122.8 | 4.73 | 232.9 | 5898 | 0.418 |
| Lamp#1 7 months | Magnetic (m59) | 512 | 120.2 | 4.43 | 240.2 | 6035 | 0.469 |
| Lamp#2 7 months | Magnetic (m59) | 495 | 120.5 | 4.35 | 171.7 | 6550 | 0.347 |
| Lamp#3 7 months | Magnetic (m59) | 503 | 120.1 | 4.41 | 218 | 6787 | 0.433 |
| Lamp#4 7 months | Magnetic (m59) | 511 | 21.1 | 4.43 | 220.6 | 6549 | 0.432 |
| Lamp#1 13 months | Magnetic (m59) | 650 | 120.2 | 5.71 | 288 | 4287 | 0.443 |
| Lamp#2 13 months | Magnetic (m59) | 564 | 121.5 | 4.85 | 213 | 5648 | 0.378 |
| Lamp#3 13 months | Magnetic (m59) | 569 | 122.6 | 4.82 | 245 | 6718 | 0.431 |
| Lamp#4 13 months | Magnetic (m59) | 573 | 121.7 | 4.89 | 242 | 5719 | 0.422 |

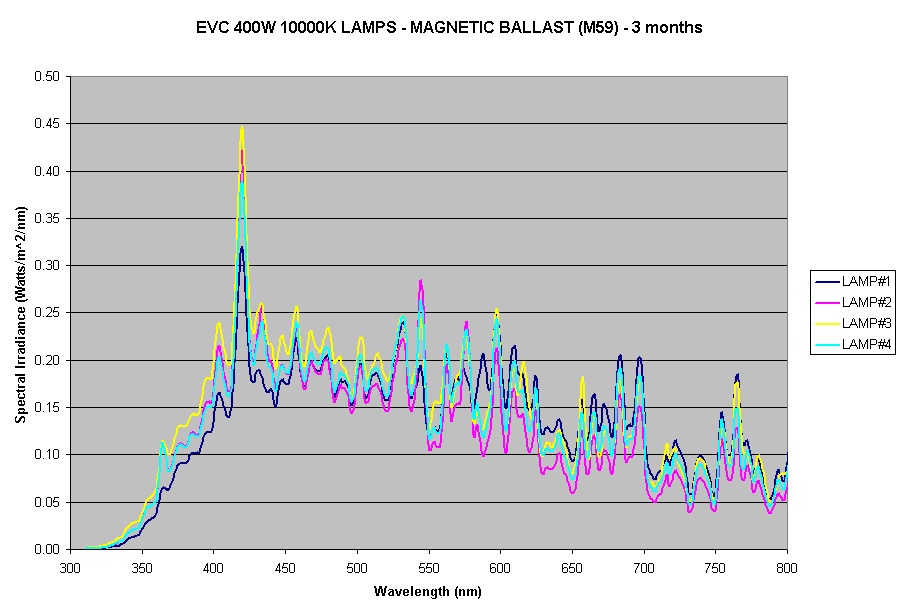

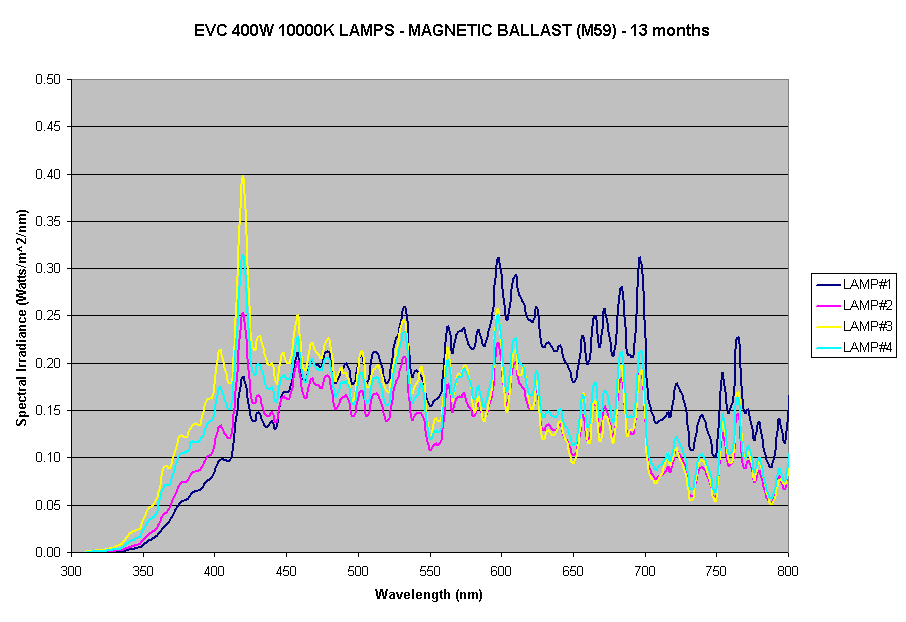
Figure 4: Spectral plots of the 4 EVC lamps over time
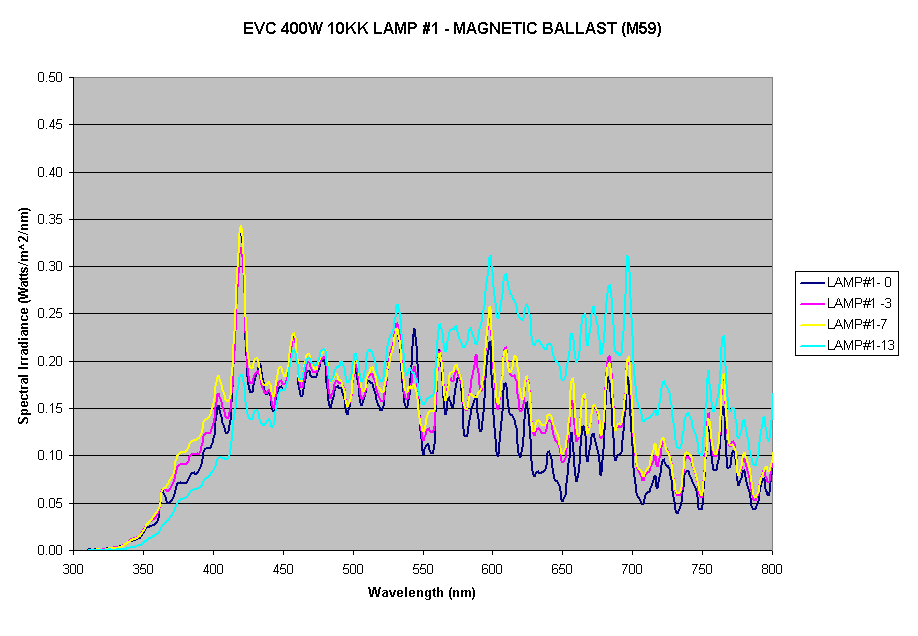

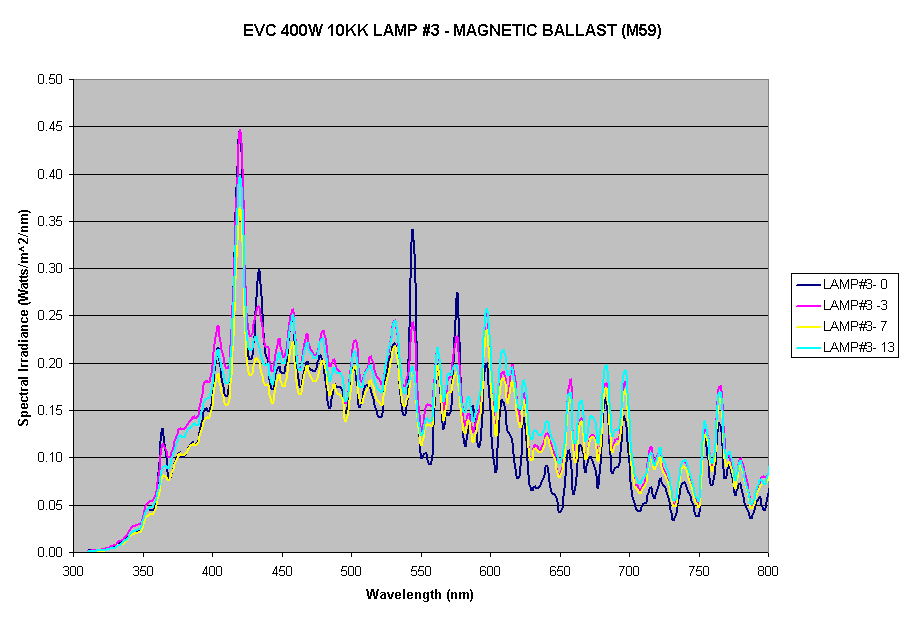
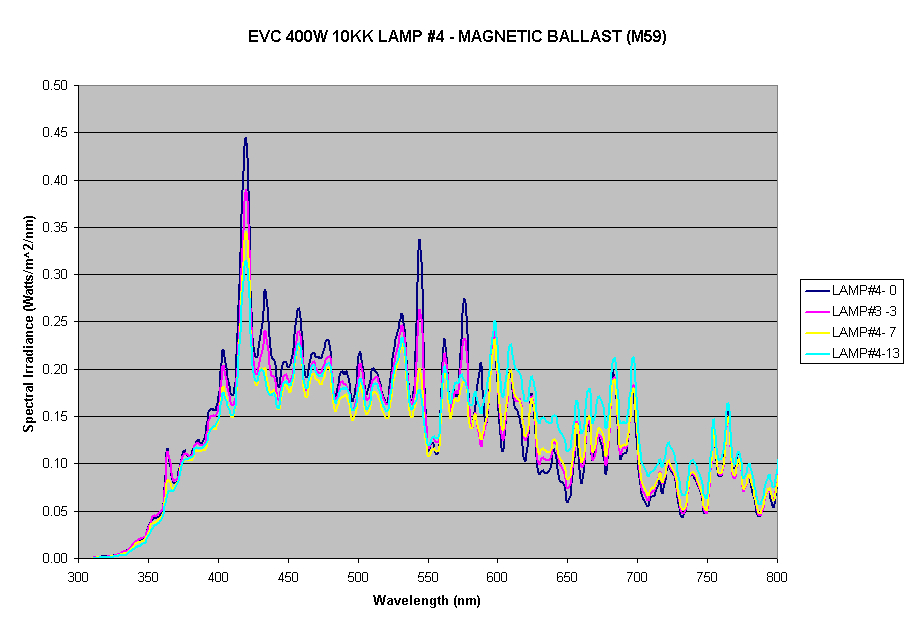
Figure 5: Spectral plots of the 4 EVC lamps – by lamp
In comparison to the XM 400W 10000K lamps, the EVC lamps showed a larger spectral variation at 0 hrs. Overtime this spectral variation persisted. Interestingly once again, these lamps also showed an increase in output when measured at 13 months, with one lamp showing a much larger increase brought about by the large amount of increase in output over the yellow and red spectral ranges, and a corresponding increase in power consumption, and decrease in color temperature. These lamps were replaced at 13months, by this point the color of the corals was getting visually affected, even though once again the PPFD output of the lamps had in fact increased.
Giesmann Mogul 400W Coral Lamps
Three 400W Giesmann Coral lamps were installed on my personal 500G aquarium at home in December 13th 2006 and removed from service May 20th 2008. These lamps were driven by 400W Icecap Electronic ballasts. These lamps were used for 9 hrs/day. Once again data was collected over the life of these lamps. Table 5 shows all the data collected over the life of these lamps. Figures 6 and 7 show the spectral plots of the lamps over time as well as by lamp. Due to accidental over writing of some data files, the spectral plots for 6 months for all lamps, and spectral plot for 3.75months for lamp #3 were lost.
| Lamp | Ballast | Power | Voltage | Amps | PPFD | CCT | Efficiency |
|---|---|---|---|---|---|---|---|
| #1 – 0m | Icecap | 426 | 120.9 | 3.64 | 160.2 | 25969.7 | 0.3761 |
| #2 – 0m | Icecap | 428 | 120.4 | 3.66 | 162.6 | 27708.7 | 0.3799 |
| #3 – 0m | Icecap | 428 | 120.6 | 3.65 | 155.3 | 19823 | 0.3629 |
| #1 – 1m | Icecap | 434 | 121.4 | 3.66 | 145.3 | 13638 | 0.3348 |
| #2 – 1m | Icecap | 432 | 122.1 | 3.64 | 146.2 | 15404 | 0.3384 |
| #3 – 1m | Icecap | 434 | 122.5 | 3.63 | 150.2 | 14292 | 0.3461 |
| #1 – 2m | Icecap | 435 | 121.7 | 3.66 | 139 | 10367 | 0.3195 |
| #2 – 2m | Icecap | 434 | 121.9 | 3.65 | 146.2 | 13374 | 0.3369 |
| #3 – 2m | Icecap | 432 | 121.9 | 3.64 | 148 | 13510 | 0.3426 |
| #1-3.75m | Icecap | 432 | 122.5 | 3.63 | 151.6 | 12907 | 0.3509 |
| #2-3.75m | Icecap | 432 | 122.2 | 3.64 | 129.5 | 11169 | 0.2998 |
| #3-3.75m | Icecap | 433 | 122.3 | 3.64 | 135.8 | 13462 | 0.3136 |
| #1 – 6m | Icecap | 428 | 121.3 | 3.57 | 153 | 14050 | 0.3575 |
| #2 -6m | Icecap | 428 | 121 | 3.57 | 137.3 | 12769 | 0.3208 |
| #3 – 6m | Icecap | 428 | 121.3 | 3.56 | 126.5 | 11228 | 0.2956 |
| #1 -7.75m | Icecap | 432 | 121.4 | 3.72 | 137 | 13201 | 0.3171 |
| #2 -7.75m | Icecap | 432 | 121.1 | 3.72 | 131.3 | 11061 | 0.3039 |
| #3 -7.75m | Icecap | 430 | 121 | 3.71 | 127.7 | 10309 | 0.2970 |
| #1 – 13.25m | Icecap | 430 | 122.5 | 3.63 | 130.3 | 7475 | 0.3030 |
| #2 – 13.25m | Icecap | 430 | 122.2 | 3.64 | 120.4 | 9024 | 0.2800 |
| #3 – 13.25m | Icecap | 428 | 122.6 | 3.61 | 121.3 | 7708 | 0.2834 |
| #1 – 17.5m | Icecap | 426 | 123.1 | 3.58 | 123.5 | 8208 | 0.2899 |
| #2 – 17.5m | Icecap | 425 | 123 | 3.58 | 134.4 | 9148 | 0.3162 |
| #3 – 17.5m | Icecap | 427 | 122.8 | 3.59 | 122.9 | 8611 | 0.2878 |
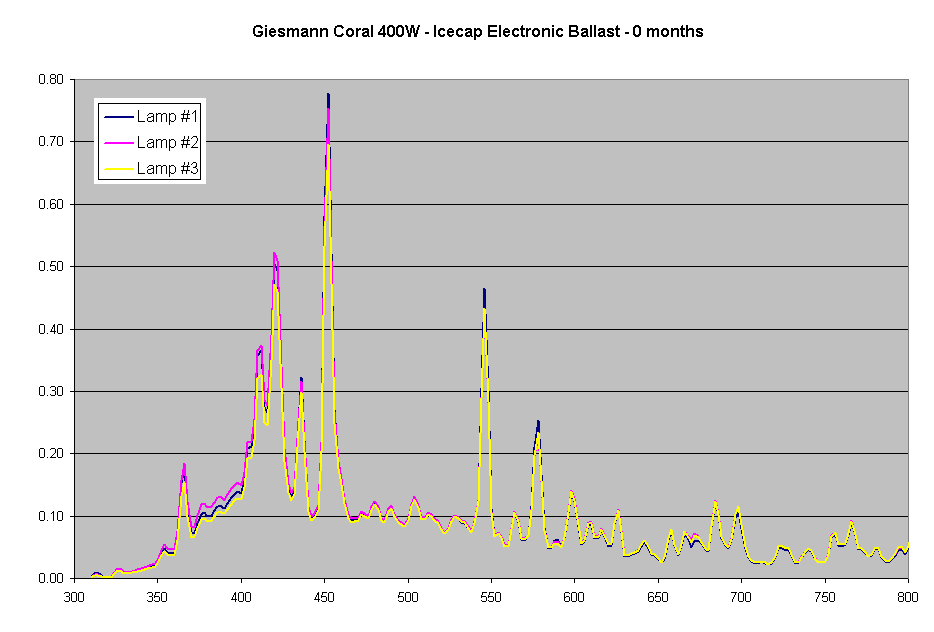
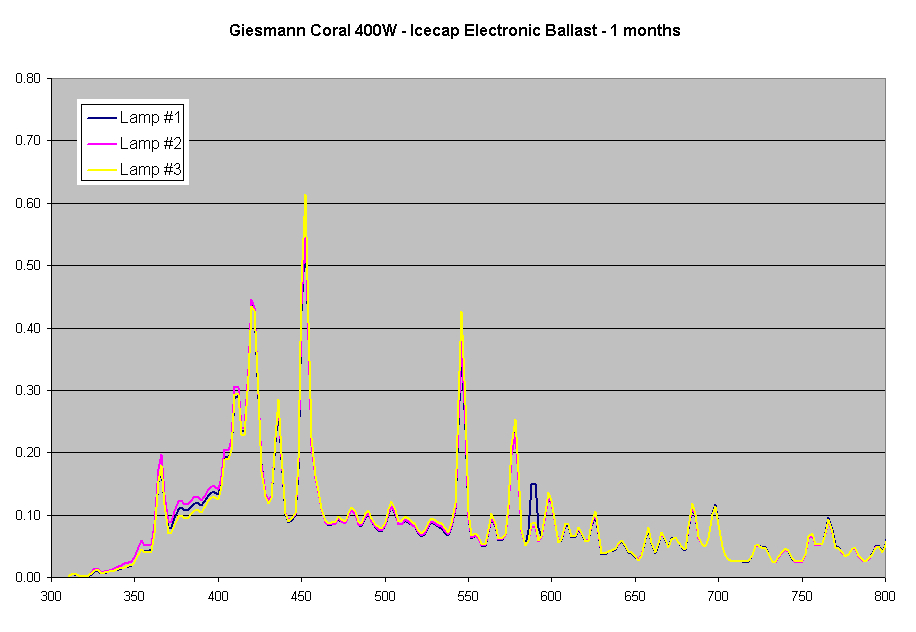
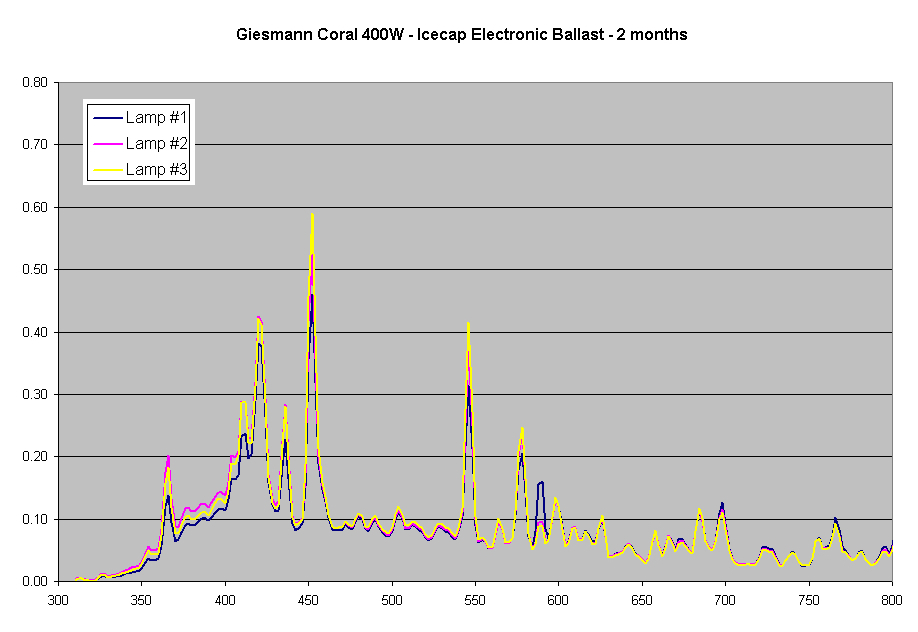
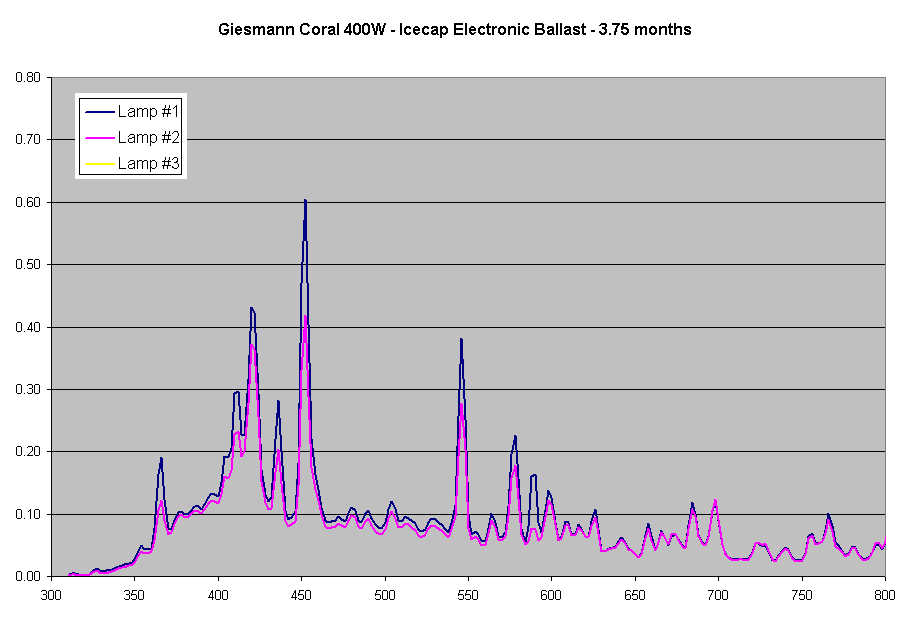
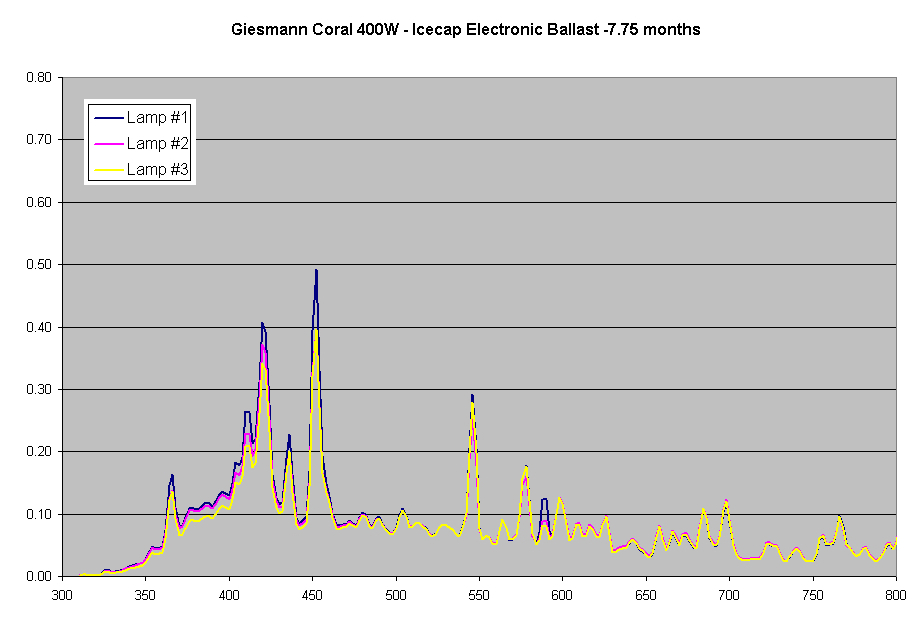
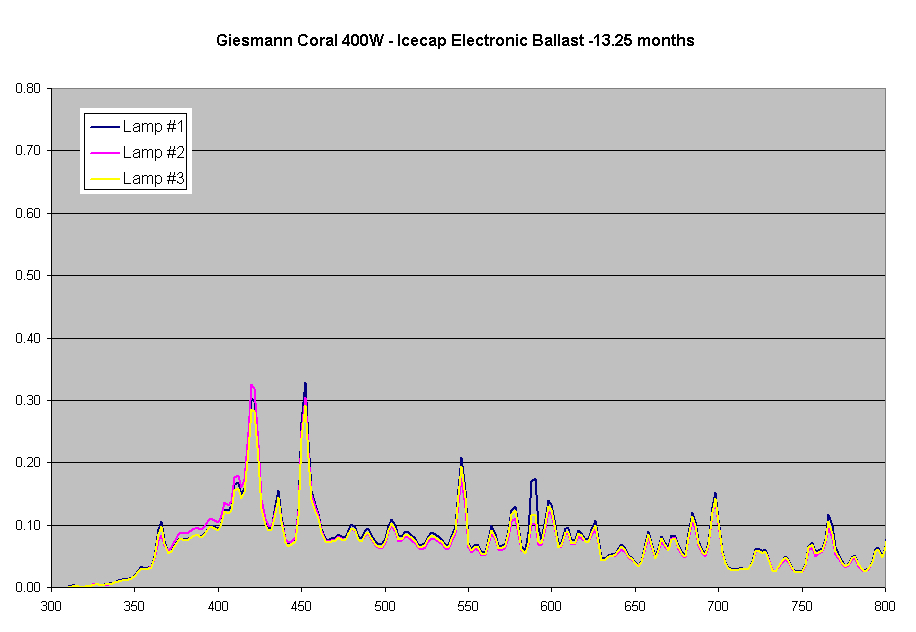
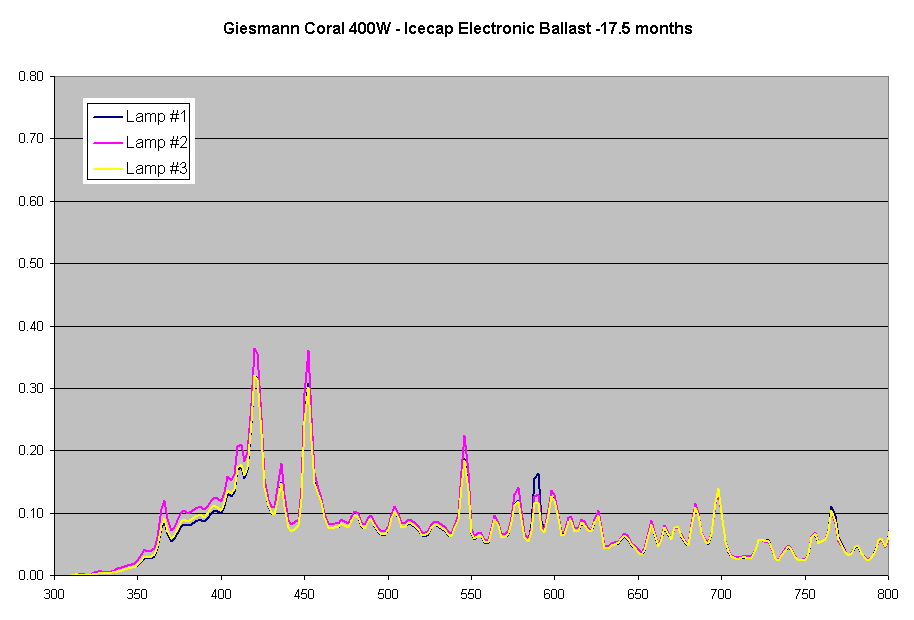
Figure 6: Spectral plots of the 3 GIESMANN CORAL lamps over time
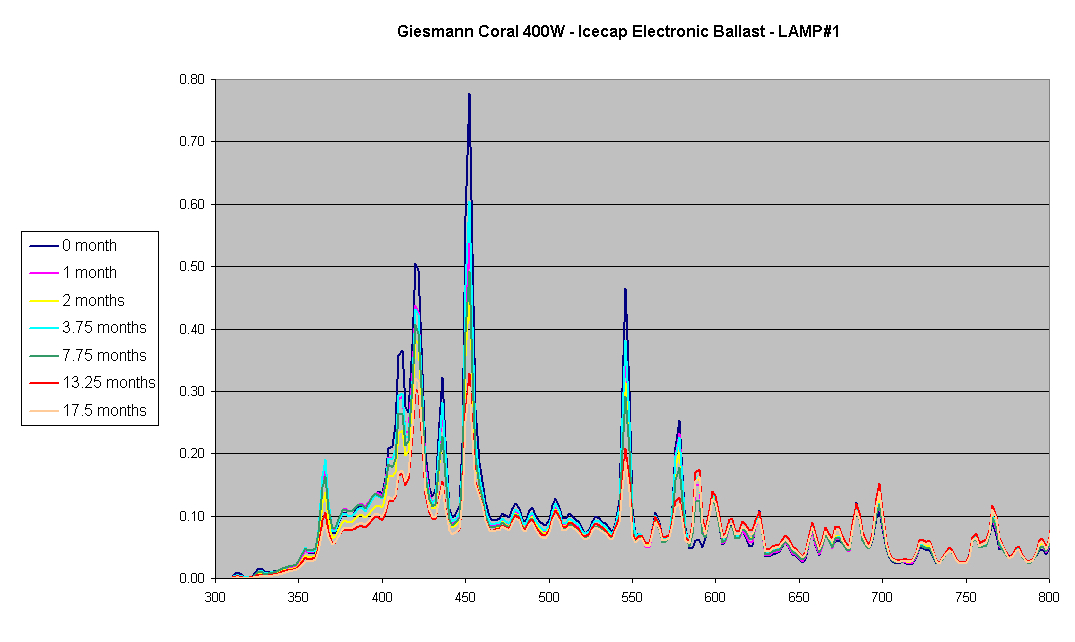
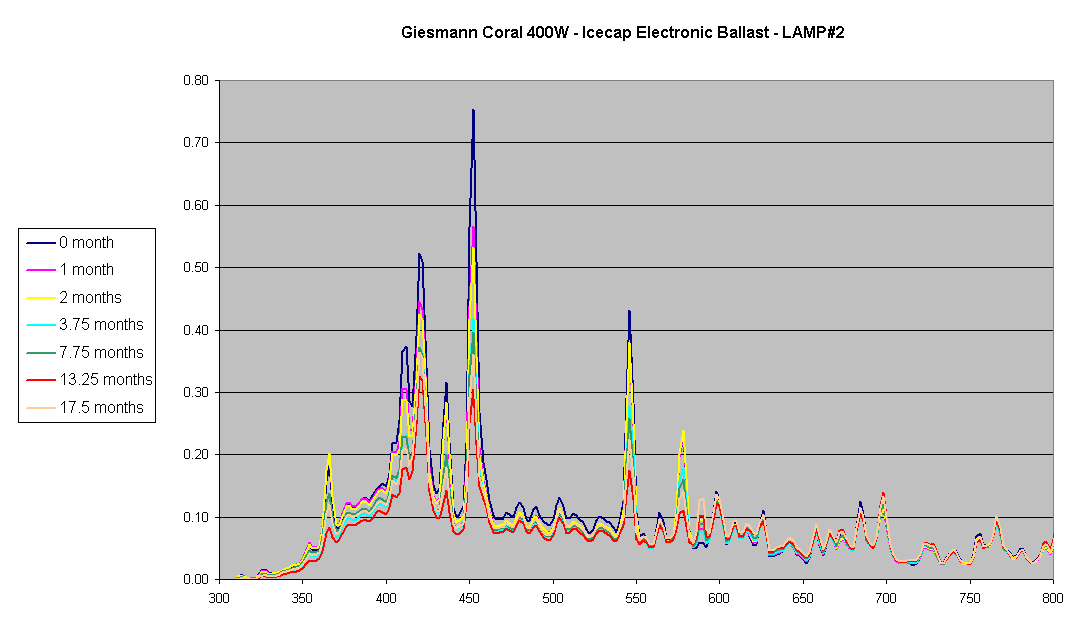
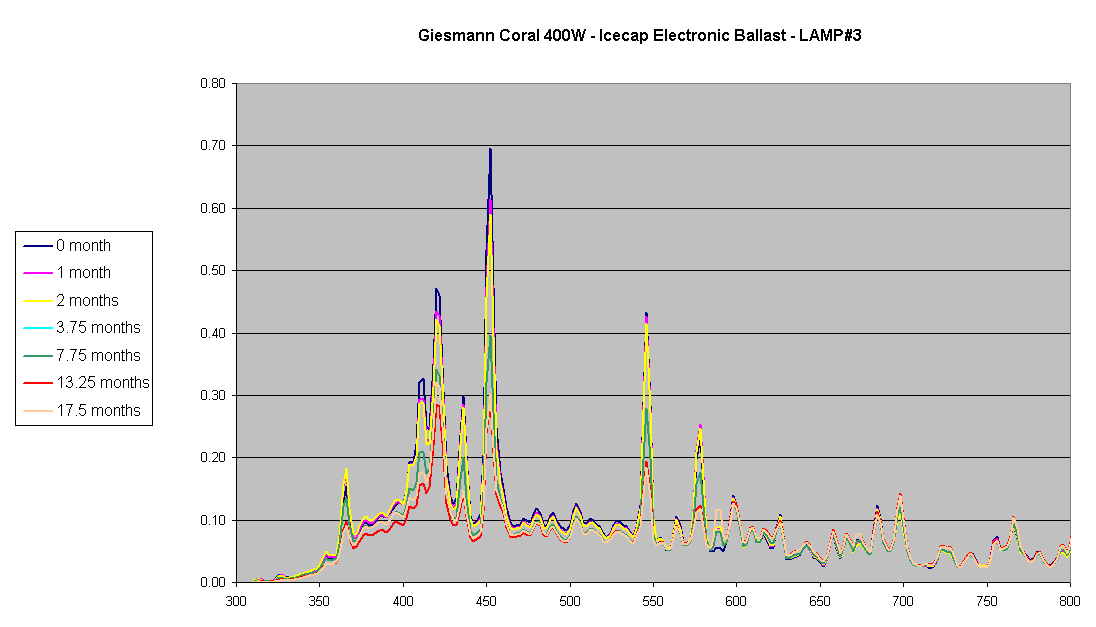
Figure 7: Spectral plots of the 3 GIESMANN CORAL by Lamp
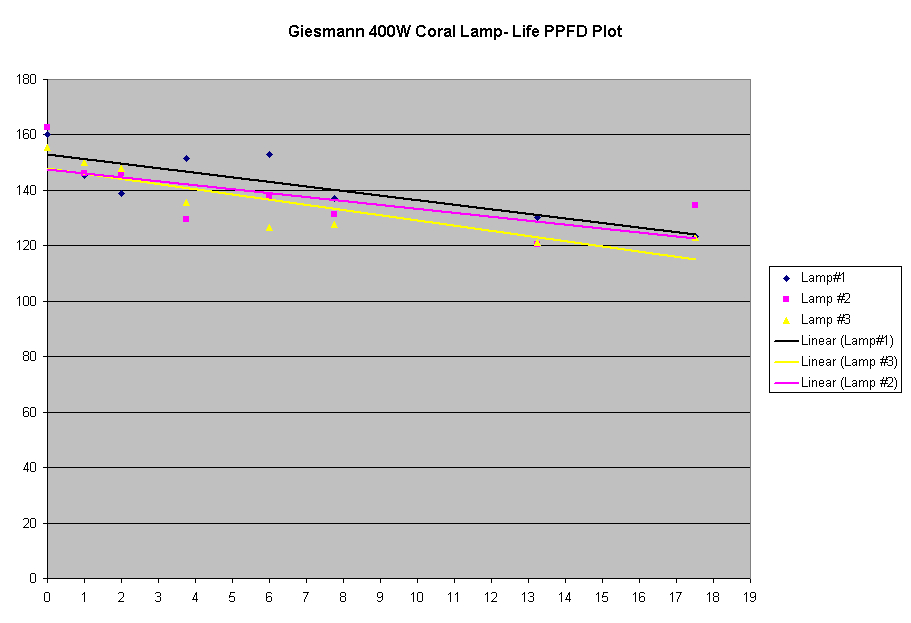
Figure 8: PPFD output of the 3 GIESMANN CORAL lamps over time
Unlike the other lamps (XM, EVC) these lamps did not show an increase in output over time. This could be due to the fact that electronic ballasts were used and they may regulate the current draw by the lamp better than magnetic ballasts and not allow the lamps to draw more power and increase the output. Once again, it can be seen that there is a larger drop in the blue region of the spectrum resulting in a change in the CCT to lower values. The PPFD over 17.25 months of use only dropped by an average of 21.4%. While this change in output did not seem to have an effect on the coral growth, there were visible changes to the colors of some of the SPS corals as compared to colors when the lamps were new, primarily the darkening of some of the corals, with a fading of some of the blue colors. Personally I could have lived with the color change (it would not be obvious to anyone seeing the tank for the first time) and used the lamps for a month more.
Conclusion
The study presented some very interesting data on the life of metal halide lamps. It reinforced the view that the spectral qualities change over time resulting in the change of the CCT of the lamps to lower values due to reduction in output of the blue portions of the spectrum. In 2 of the lamps (XM, EVC) it also showed an unexpected increase in the PPFD output which can possibly be explained by the fact that there was also a corresponding increase in power consumed. This effect was not seen in the Giesmann Coral lamp, possibly due to the electronic ballasts being better at regulating the power draw. Another point to note was that the drop in output over almost 17 months of use was around 21%, lower than I would have expected. A similar study by Allen Chantelios [3] using seven 250W DE Phoenix 14000K with Icecap electronic ballasts shows a similar trend of gradual decay over time – of an average of 25% over 12 months. If the change in spectral output is not a big concern, these lamps can be used for much longer periods of time, especially if the fixtures can be lowered by a couple of inches to compensate for the loss in light output.
References
- Joshi, S. and Morgan D. 1999. Spectral Analysis of Metal Halide Lamps Used in the Reef Aquarium Hobby Part II: Used 400-watt Lamps. Aquarium Frontiers. Jan 1999.
- Joshi, S. and Morgan, D. 1999. Spectral Analysis of Metal Halide Lamps Used in the Reef Aquarium Hobby Part III: New and used 250-watt Lamp. Aquarium Frontiers
- Allen Chantelios, “Light Output of the Phoenix 14,000K DE MH Bulb Over Time” Reefkeeping Magazine, April 2007. http://www.reefkeeping.com/issues/2007-04/ac/index.php

0 Comments