

These questions will be probed through review of the relevant literature on (non-aquarium) field studies and by experimentation on marine aquarium water samples taken from a range of aquarists’ tanks:
- What are Dissolved Organic Carbon (DOC), Particulate Organic Carbon (POC), and Total Organic Carbon (TOC)?
- What is the natural level of carbon (dissolved and/or particulate) in tropical reef waters? In the deep ocean?
- Which organisms produce carbon, and which organisms consume carbon in a reef environment?
- What role does organic carbon play in the health of the corals living in our marine aquariums?
- Might imbalances in carbon content underlie episodes of reef tank crashes?
- Do our reef tanks accurately mimic the natural levels of carbon on thriving reefs?
Introduction: Plausible Connections between DOC, TOC, Coral Bacteria, and Coral Health
The economic value of coral reefs worldwide has been estimated at $375B/yr as a consequence of fishing, tourism, and coastal protection (Costanza, 1997). Unfortunately, in many areas of the world, the coral reefs are dying; for example, Caribbean reefs have suffered approximately an 80% loss in coral population over the past 30 years (Gardner, 2003). These interdependent facts have galvanized efforts amongst many areas of science to both identify the causative agents for the corals’ (= reef’s) demise and to pursue possibly ameliorative interventions. Many anthropogenic (= attributable to human activity) intrusions into the coral reef ecosystem have been recognized as contributing to the stress and even mortality of corals on tropical reefs, although naturally occurring stressors cannot be excluded either. All of this activity has brought into sharp focus the ecological significance of reef-building corals and their responses to changes in their environment. Many of the observations of coral distress/mortality made on tropical reefs can be duplicated in our (stressed) aquariums as a result of unplanned and unwelcome deviations in husbandry practices. Thus, maintaining the health and insuring the survivability of the fragile organisms that we so carefully cultivate in our home aquariums remains a significant challenge, especially as tanks age and waste materials can accumulate.
Fortunately, a great body of information, some anecdotal and some verified by rigorous experimentation, is available to the conscientious aquarist to aid in this task. Many (most?) of the canonical parameters associated with successful husbandry have been identified. Issues of lighting, flow, temperature, feeding, etc. usually can be addressed by several different and effective approaches. Maintaining water chemistry can be trickier, as consumption/removal and production/addition of key and trace water components must be balanced. Nevertheless, acceptable ranges for the major elements/compounds are documented, and the methodologies necessary to monitor and maintain appropriate levels of salinity, alkalinity, calcium, magnesium, strontium, iodide, nitrate, ammonia, phosphate etc., are well known and readily available. Missing from the above list of marine aquarium water components is one notable, perhaps even key, player: carbon.
What is Dissolved Organic Carbon (DOC), Particulate Organic Carbon (POC), and Total Organic Carbon TOC)?
Carbon in this context is a catchall phrase which refers to carbon-containing (i.e., organic) chemicals that are either dissolved in the water itself (= Dissolved Organic Carbon, DOC) or suspended in the water as small particles, including single-cell organisms (= Particulate Organic Carbon, POC) (Holmes-Farley, 2004). Together, these carbon sources are called Total Organic Carbon, TOC. The divide between DOC and POC is arbitrary and is based strictly on the capabilities of commercially available filtering materials. At present, the operational definition of DOC includes carbon-containing material that passes through the pores of a 0.2 micron filter. Any carbon-containing material left behind, which includes most bacteria/single-celled organisms, then is labeled Particulate Organic Carbon (POC) (Benner, 2002).
Organic carbon in both its particulate and dissolved forms has been called “the soil of the sea” in recognition of its role at the very foundation of the entire marine ecosystem (Ducklow, 2002). It is the sustenance of the microbiota in the oceans and the entire marine food pyramid rests on the availability of this fuel source. Greater than 97% of the organic matter in the oceans is in the form of DOC, and attempts to quantitate the amount of DOC in all of the oceans’ water leads to staggering values: 650 – 700 x 1015 grams of C, a number of the same order of magnitude as the total amount of carbon (as CO2) in the atmosphere (~ 750 x 1015 grams) (Hedges, 2002; Benner, 2002).
The chemical makeup of this aggregate DOC remains largely a mystery as a consequence of difficulties in both separation and characterization of very small amounts of discrete molecules in exceedingly complex mixture of like species. Nevertheless, some progress has been made with the aid of modern separations (chromatography) techniques and sophisticated characterization methods (nuclear magnetic resonance, mass spectrometry) (Benner, 2002). Members of broad classes of biological metabolites have been identified, and the best estimates of DOC composition hover around the following values:
- ~ 6% of DOC from hydrolyzable sugars, including glucose, galactose, fucose, mannose and xylose.
- ~ 3% from hydrolyzable amino acids, including glycine, arginine, alanine, phenylalanine, serine, threonine, aspartic acid, valine, histidine, isoleucine, glutamic acid, lysine, methionine, and leucine.
- ~ 1% from hydrolyzable amino sugars, including N-acetyl glucosamine and N-acetyl galactosamine.
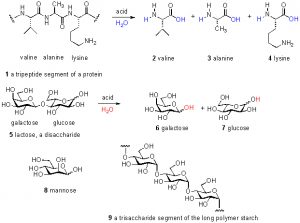
Figure 1. Examples of amino acids, peptides, sugars, and oligosaccharides.
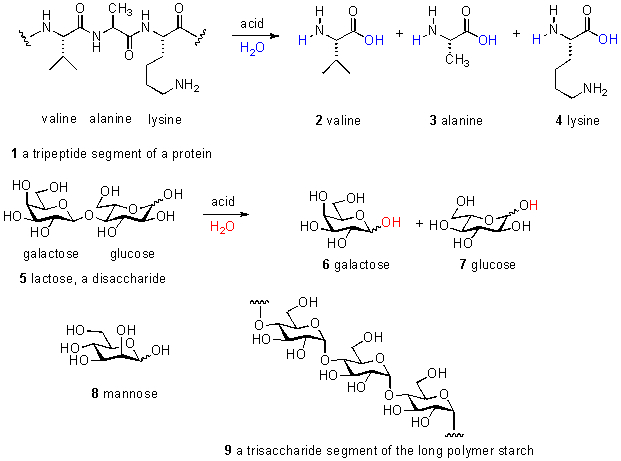
Thus, only about 10% of the total DOC can be accounted for by these common biochemical species; the remaining 90% of DOC remains uncharacterized. This unknown majority of carbon has been variously called “marine humic substances” or “refractory carbon”, but these labels offer no useful chemical insight. In fact, even claiming that the carbohydrates and amino acids listed above are present in DOC is misleading; these species actually exist primarily as polymers, wherein many amino acids are connected together in a chain called a peptide or protein and many individual sugar molecules likewise are attached together in (sometimes branched) chains called oligosaccharides. Only through acid-catalyzed hydrolysis (= chemical addition of water) can these polymers be broken apart to their individual components and characterized as noted above. Some examples of these species as individual units, and as part of polymer chains, are shown in Fig. 1. The majority of the DOC in the oceans is consumed over a time span on the order of hours-to-weeks. The remainder eventually settles in the deep ocean, and 14C (= radioactive carbon) dating techniques have placed its age in the 4000 – 6000 year range (Benner, 2002).
Examining the chemical structures illustrated in Fig. 1 emphasizes the fact that there are many other elements that are required to construct the molecules of life. The percentage of carbon (by dry weight) of different organisms has been measured/calculated, and reliable values for a few examples are: benthic invertebrates 30 – 49% C; pelagic invertebrates 45-50% C; humans 28% C (Liess, 2006; Sterner, 2002). Thus, when a value of 1 ppm of C is reported in an assay, the actual amount of organic material is somewhere between 2 and 3.3 ppm by mass.
What is the natural level of carbon (dissolved and/or particulate) in tropical reef waters? In the deep ocean?
The measurement of organic carbon levels (DOC and POC) in the oceans has had a long and colorful history. The first published attempts date back to 1892 by Natterer, and the topic has remained on the chemical oceanographers’ vista since that disclosure. The detection of a small amount of carbon immersed in a “sea” of salt and inorganic carbon (bicarbonate, HCO3–) has proven to be a vexing challenge, and many methodologies have been explored. It was not until the 1990’s that the currently “best” method emerged as a consequence of commercial instrumentation availability, although “home-made” versions of the key instruments date back to the 1960’s. This method, called High Temperature Oxidative Combustion (HTOC), literally burns all organic residues in a sample to generate CO2 from the carbons, and then that newly formed CO2 can be identified and quantified with the appropriate detector. Even with this advance, issues with high
instrument “blanks” plagued early attempts to gain useful data on ocean DOC levels, but a conference in 1991 and subsequent follow-ups has led to a regularization of the methodology with respect to sample preparation and appropriate blank utilization (Sharp, 1993; Sharp, 2002).
The commercial instrument of choice is the Shimadzu 5000 TOC Analyzer. After the instrument details were worked out, many reliable measurements of DOC, POC, and TOC content on reefs and in the open ocean were documented, Table 1. The generally accepted value of deep ocean TOC ( DOC in this instance) ranges from ~ 0.45 – 0.60 ppm, a number that appears to be insensitive to collection location. On reefs, however, the DOC (and TOC) value is considerably higher. Even with this point noted, the values of DOC on reefs from the South Pacific to Japan to the Caribbean to the Red Sea are remarkably consistent in their range: 0.7 – 1.6 ppm. Anomalously high values for some sites at Ponape Island were attributed to terrestrial runoff (= pollution), similar to the high values seen in Tokyo Bay and Florida Bay. Thus, there appears to be a consensus value of 1.1 ± 0.4 ppm of carbon in the bulk water of healthy thriving reefs. These reefs, at least in the South Pacific, are just the types of ecosystems which harbor the corals, fish and other livestock that make up our aquarium biota.
| Entry | Location | Depth(ft) | DOC(ppm) | POC(ppm) | TOC(ppm) | Ref. |
|---|---|---|---|---|---|---|
| 1 | Haraiki lagoon, FPa | 27 | 0.76 | 0.17 | 0.93 | Pagès (1997) |
| 2 | Hikueru lagoon, FP | 58 | 0.93 | 0.11 | 1.04 | Pagès (1997) |
| 3 | Hiti lagoon, FP | 26 | 0.92 | 0.12 | 1.04 | Pagès (1997) |
| 4 | Kauehi lagoon, FP | 104 | 0.82 | 0.09 | 0.91 | Pagès (1997) |
| 5 | Marokau lagoon, FP | 65 | 0.85 | 0.11 | 0.96 | Pagès (1997) |
| 6 | Nihiru lagoon, FP | 58 | 0.72 | 0.11 | 0.73 | Pagès (1997) |
| 7 | Rekareka lagoon, FP | 3 | 1.00 | 0.22 | 1.22 | Pagès (1997) |
| 8 | Taiaro lagoon, FP | 39 | 1.67 | 0.19 | 1.86 | Pagès (1997) |
| 9 | Tekokota lagoon, FP | 10 | 0.72 | 0.09 | 0.81 | Pagès (1997) |
| 10 | Tepoto Sud lagoon, FP | 16 | 0.74 | 0.12 | 0.86 | Pagès (1997) |
| 11 | Majero Atoll, Marshall Is. | <1 | 0.62-2.18c | Yoshinaga (1991) | ||
| 12 | Ponape Island, Micronesia | <1 | 1.61-4.51c | Yoshinaga (1991) | ||
| 13 | Great Astrolabe lagoon, Fiji | 65-120 | 1.37 | Torréton (1999) | ||
| 14 | Shiraho reef, Japan | <1 | 0.86 | 0.04 | 0.90 | Hata (2002) |
| 15 | Curacao, NAb (day) | 23 | 1.55d | van Duyl (2001) | ||
| 16 | Curacao, NA (night) | 23 | 1.16d | van Duyl (2001) | ||
| 17 | Coral Reef Nat. Res., Israel | 29 | 0.86 | 0.09 | 0.95 | Yahel (2003) |
| 18 | Tokyo Bay | <1 | 1.92 | Ogawa (1992) | ||
| 19 | open ocean, Majero Atoll | 1-162 | 0.88-1.66c | Yoshinaga (1991) | ||
| 20 | open ocean, eq. Pacific | <1 | < 0.06 | 0.84 | Sharp (1995) | |
| 21 | open ocean, eq. Pacific | 13000 | < 0.01 | 0.47 | Sharp (1995) | |
| 22 | open ocean, near FP | — | 1.00 | 0.05 | 1.05 | Pagès (1997) |
| 23 | open ocean, Sargasso Sea | 6 | 0.88 | Sharp (1993) | ||
| 24 | open ocean, Sargasso Sea | 7150 | 0.59 | Sharp (1993) | ||
| 25 | Florida Bay, Florida | <1 | 10.5 | Boyer (1997) | ||
| aFrench Polynesia. bNetherlands Antilles. cRange of several collection sites. dWet chemical oxidation method, cross-correlated with HTOC method. | ||||||
Which organisms produce carbon, and which organisms consume carbon in a reef environment?
The major consumers of the DOC in the reef environment are heterotropic (= can’t make their own food) bacteria (Moriarty, 1985). These bacteria can be living in the water column or tightly associated with substrate, detritus, corals and other benthic organisms, etc. Bacteria are a critical component in the food web of the reef, as they occupy the role of “middle man” in the transfer of energy from the source (= sunlight) to the consumers on the reef (Eppley, 1980; Ducklow, 1983, Crossland, 1980; Johannes, 1967; Ducklow, 1979; Gottfried, 1983). Sunlight impinging on the reef kicks off the energy cycle by promoting photosynthesis within free-swimming plankton in the water column and also within the zooxanthellae of the scleractinian corals that we obsess about in our aquaria. Photosynthesis utilizes the sunlight’s energy to “fix” (= attach) inorganic carbon in the form of CO2 to organic chemical structures that eventually become carbohydrates (cf. Fig. 1). These
carbohydrate building blocks are chemically manipulated further by the zooxanthellae and/or the coral host and then secreted by the coral as coral mucus (a combination of complex polysaccharides, amino acid oligomers/polymers, lipids, etc., cf. Fig. 1). The carbohydrates and amino acids within the mucus serve as food sources for the bacteria and other microbiota that comprise the foundation of the marine food pyramid (Kirchman, 1990; Rich, 1996; Weiss, 1999; Wild, 2004; Sharon, 2008). The remaining reef inhabitants, including the very corals that house the zooxanthellae, then feed on these energy rich microbes (or, in turn, on the organisms that eat the microbes, ad infinitum), thus perpetuating the reef’s nutrient recycling food web. In addition to corals, sponges are some of the most prolific repositories of marine bacteria. In fact, some sponges have been studied as effective bioremediation agents in marine aquaculture as a consequence of their exceptional ability to absorb TOC (Fu, 2007).
Where does the DOC come from? Phytoplankton are major contributors, and the intriguing hypothesis that DOC release is a means to dispose of excess, photosynthetically generated “fixed” carbon when nutrient levels are not high enough for growth, has been proposed (Hessen, 2008). As discussed above, some of the major producers of DOC on the reef are the corals themselves (Crossland, 1987). Using some rather creative carbon-balance accounting, Sorokin has estimated that ~ 20% of the DOC in the waters of a tropical reef can be attributed to coral mucus production (Sorokin, 1993). In an independent study, a similar value (10 – 20%) of the total TOC that is metabolized by the reef’s sedimentary community was attributed to coral mucus (Wild, 2004); Johannes, using different estimation methodology and at a different locale, scales this value back to ~ 2% (Johannes, 1967). Even given the large error bars in these numbers due to the assumptions made, it is astonishing that the corals contribute so much organic material to the reef water column, and by inference, to the closed systems of our (overstocked?) reef aquariums.
Several additional lines of evidence support the contention that corals, via their mucus secretions, literally flood the reef with DOC. For example, measurement of the DOC content of the contact surface water surrounding Montastraea faveolata and Madracis mirabilis on a reef near Curacao NA resulted in higher values (~ 2.28 ppm) compared with nearby reef water (1.60 – 1.94 ppm) (van Duyl, 2001). In another (laboratory-based) study, Galaxea fascicularis was observed to emit a DOC “spike” every morning and every afternoon lasting about an hour. Specimens fed with artemia secreted a larger DOC spike compared to unfed control: for the fed Galaxea, the measured DOC value within a 5 liter reservoir raised from a base value of 1.2 ppm up to 4.8 – 20.4 ppm; unfed Galaxea raised the base DOC level of the water only a few ppm during the spike emission. In both cases, within 2 hours of the spike, the DOC content of the reservoir fell back to basal levels (Ferrier-Pagès, 1998). Carbon balance calculations suggested that ~ 11-14% of the photosynthetically fixed carbon (i.e., originating in HCO3– <-> CO2) is released as DOC, a value in line with many prior studies (Sorokin, 1993; Crossland, 1987).
Where does the DOC go when the Galaxea spike subsides? 14C labeling studies suggest that it is rapidly consumed by bacteria that live in and on the coral itself and not by bacteria present in the water column. Shutting down these endogenous bacteria by antibiotic treatment abolished DOC uptake.
In a subsequent study, Ferrier-Pagès and colleagues expanded this type of experiment to include a more richly diverse coral tableau in their laboratory aquarium (Ferrier-Pagès, 2000). Specimens of Stylophora sp., Acropora sp., Favia sp., Galaxea sp., and Euphyllia ancora in one experimental tank, and similarly, Montipora sp., Favia sp. and again Euphyllia ancora in a second independent tank, were treated with microplankton (tank 1) and marine bacteria (tank 2). In both cases, a DOC increase of 5 – 13-times baseline was detected 2 – 7 hrs after feeding. These DOC bursts subsided after about 2 hrs and the DOC level dropped to pre-feeding values. A control tank (substrate but no corals) did not exhibit any surge of DOC during the course of the experiment. Means and Sigleo can be credited with similar observations on Acropora palmata as well (Means, 1986). Taken together, these consistent observations of a correlation between coral feeding and subsequent DOC production and then consumption, across a wide range of coral species and food types, begin to speak to the generality of the phenomenon. In fact, these observations might foreshadow the development of a hypothesis positing that the coral deliberately regulates the amount and content of its bacterial population by metering out food in the form of DOC (see Rohwer, below).
The apparently tight coupling between corals and their associated microbiota, possibly at least partially mediated by DOC production/consumption, suggests that the overall “health” of this bacterial population might impact on the overall health of the coral itself. This concept has been expanded and codified by Rosenberg as “the hologenome theory of evolution”, which stipulates that a host organism (i.e., coral) and its associated microbiota (bacteria, zooxanthellae, etc.) should be viewed as a single unit of evolution; the holobiont (Rosenberg, 2007). The value of this perspective can be seen when considering the reproduction time of bacteria (minutes) compared with the reproduction time of corals (months? years?). The genetic information of the microbiotic symbionts can change much more rapidly through mutation and/or horizontal gene transfer than can that of the host coral, ensuring that the holobiont can more rapidly adapt via natural selection to quickly changing environmental conditions. In support of this concept, measured bacterial populations in the coral mucus layer are 100 – 1000x that in the surrounding water. In addition, work by LaJeunesse has demonstrated that there is a correlation between host coral species and the specific clade(s) of zooxanthellae (= symbiotic algae) that associate with it, and that these correlated associations are responsive to evolutionary pressure (LaJeunesse, 2005a; LaJeunesse, 2005b; see also Baker, 2003). Likewise, similar bacterial population compositions are found in the same species of coral at differing geographic locations, whereas juxtaposed corals of different species have largely different bacterial components to their holobiont (Rohwer, 2001, 2002; Bourne, 2005; Rosenberg, 2007; Ritchie, 2008). Alternatively, some evidence has emerged that implicates environmental gradients (e.g., depth, pollution) as determinants of bacterial populations (Klaus, 2007). Thus, whereas the final picture of coral/bacteria association is undoubtedly going to be complex and multifactoral, there appears to be some measure of persistent coral-microbe selectivity indicative of purposeful matching of symbiont with host. Do corals and their associated microbiota in our aquaria respond similarly to the corals studied on reefs? Preliminary evidence suggests that, in fact, the microbial population of identical Fungia granulosa corals in aquaria and in the wild is different enough to be a point of interest (Kooperman, 2007). The authors suggest that the differences in microbiota in the aquarium specimens vs. the reef specimens are an example of the adaptability of the coral holobiont to its environment. It is intriguing to speculate that corals deliberately control their bacteria population to confer a survival advantage, and that DOC secretion may be one mechanism by which this control is implemented. Some encouraging circumstantial evidence on this point has been recorded. For example, different species of algae contribute compositionally different DOC, and those differences in chemical composition apparently correlate to the recruitment of different bacterial species (González, 2000; Pinhassi, 2004; Grossart, 2005; see also Covert, 2001 for a related example). More specifically, laboratory treatment of oceanic water samples containing both the marine bacteria Pseudoalteromonadaceae (P) and Alteromonadaceae/Cotwelliaceae (A/C) with defined inputs of various carbohydrates and amino acids (as models for DOC components) led to conspicuous differences in the P:A/C ratio as a function of carbon source input (Allers, 2007a; Allers, 2007b). Finally, the observation has been made that (1) the chemical composition of coral mucus differs between species (Meikle, 1988), and that (2) different genetic variants of the water- and coral-born bacteria Alteromonadaceae macleodii associate with different corals (Bourne, 2005; Lampert,
2006); could (1) correlate to (2) in a deterministic way?
What role does organic carbon play in the health of the corals living in our marine aquariums?
If DOC is a factor in microbiota control and maintenance within the coral holobiont, then what happens when something goes “wrong”? This question is currently at the forefront of coral microbiology research, given the backdrop of reef crashes and coral mortality in the Caribbean in particular and also around the globe (Rosenberg, 2007b). A few examples serve to illustrate some coral pathologies associated with problems arising in the microbial assemblage of certain corals. Perhaps the best-studied case involves bleaching of the Mediterranean coral Oculina patagonica. Bleaching was proposed to be a direct consequence of infection by the bacteria Vibrio shiloi (Rosenberg, 2007a). Whether this bacterium invades and then overwhelms the native biota, or whether it is always present but held in check, is unknown. In either case, once present, raised water temperatures appear to initiate a series of biochemical processes in V. shiloi that ultimately led to
bleaching of the host coral. This explanation for O. patagonica bleaching has been challenged recently, and alternative hypotheses that do not require bacterial invasion have been proposed (Ainsworth, 2008).
Rohwer and colleagues recently have published two provocative papers that attempt to link DOC levels with bacterial population levels in the holobionts of certain corals, and ultimately to the health of the corals themselves (Kuntz, 2005; Kline, 2006). Treatment of encrusted fragments of Montastraea annularis, Agaricia tenufolia, and Porities furcata in a controlled laboratory setting with 5 mg/L (= 2 ppm of C) of lactose, a disaccharide (see Fig. 1), killed most of the A. tenufolia specimens over 30 days, but did not cause any increased mortality vs. control for the M. annularis and P. furcata samples. However, a similar 30-day experiment with 25 mg/L of lactose (= 10 ppm of C) led to almost complete mortality with the M. annularis and A. tenufolia of course, but P. furcata remained unperturbed. Extension of this experimental protocol to other sources of carbon led to similar results. Mannose (a monosaccharide, see Fig. 1) at 25 mg/L (= 10 ppm of C) was particularly lethal to P. furcata, but not to M. annularis. Starch (a polysaccharide, see Fig. 1) at 25 mg/L ( 10 ppm of C) on the other hand, posed no threat to P. furcata but was deadly to the M. annularis samples. The resilience of P. furcata to all insults (except mannose!) was not unexpected, as this coral has adapted to life in far-from-pristine environments that suffer wide fluctuations in temperature, sedimentation and salinity. With this exception noted, these experiments, for the first time, provide unambiguous evidence for coral mortality as a consequence of exposure to carbohydrates that are related to components of DOC in the oceans.
What is the biochemical connection between carbohydrate dosing and coral mortality? These elevated carbohydrate levels, as surrogates for DOC, lead to a order-of-magnitude increase in microbial growth rates within the subsurface mucopolysaccharide layer of Montastraea annularis (Kline 2006). Interestingly, dosing M. annularis frags in a laboratory aquarium with a bolus of bacteria cultured from the subsurface mucopolysaccharide layer of several corals (Montastraea franksi, Agaricia tenufolia, Porites astreoides, and Diploria strigosa) killed the coral directly (Kline, 2006). This treatment did no more than essentially instantaneously double the coral’s bacterial population; it did not introduce any new pathogenic bacteria to the coral. In addition, the expressed pathologies of the dying corals upon carbohydrate dosing resemble the symptoms of several bacterially induced coral band diseases. This circumstantial evidence encouraged Rohwer et al. to speculate that the introduction of carbohydrates (= a fuel source) will generate an imbalance in the bacterial component of the holobiont, and that this departure from equilibrium leads to coral mortality. The mechanism by which this induced bacterial proliferation causes coral death remains to be elucidated, and this pivotal issue must be addressed before this intriguing hypothesis can gain further traction. Nevertheless, the empirical evidence can be construed to support a robust relationship between elevated DOC levels, correspondingly increased bacterial populations, and coral mortality.
Any discussion on the relationship between DOC levels and coral health would be remiss without a digression into the currently popular practice of dosing reef tanks with carbon sources, specifically vodka (= ethanol), sugar, and/or vinegar (see http://glassbox-design.com/2008/achieved-through-observation-and-experimentation/ for a timely discussion). The logic behind this husbandry technique stems from the speculation that the increase in DOC provided by these chemicals will promote bacterial growth, and this increase in bacterial growth will in turn boost the removal of nitrogen and phosphorus-containing nutrients from the water column. The increased bacterial mass can then be removed by efficient skimming, leading to a net export of undesirable nutrients (N, P) from the aquarium. A standard recipe has been developed by Eric of Glassbox-Design: 200 mL of 80-proof vodka, 50 mL of vinegar, and 1.5 tablespoons sugar, mixed together. The dosing recommendation with this mixture involves starting with 0.1 mL/20-gal per day, and gradually increasing to a maintenance dose of 0.5 mL/20-gal per day. How do these carbon input values compare to the carbon (via carbohydrate) input values of Rohwer? In fact, the Eric/Glassbox-Design protocol is equivalent to raising the aquarium water by about 1.1 ppm of C at the maintenance dose. The Rohwer carbon dosing values that led to coral mortality over a 30-day exposure were in the range 2 – 10 ppm of C. So, it appears that the Eric/Glassbox-Design recipe does not leave much margin for error in dosing levels; overdosing by 2-3X might lead to coral mortality.
Might imbalances in carbon content underlie episodes of reef tank crashes?
The inexplicable mass mortality of corals in seemingly healthy reef aquaria remains one of the most perplexing and frustrating events in the hobby. Reef bulletin boards all too frequently contain threads that begin “Help! My tank is crashing; my corals are dying, but all of my measurable water parameters are within expected ranges. What’s wrong?” Could it be possible that elevated levels of DOC, for whatever the reason, are contributing to, or even causing, the coral loss? Might increases in DOC lead to runaway growth of the corals’ bacterial symbiont population that in turn might precipitate a critical imbalance in (some of) the bacterial components of the coral holobiont? These questions are not answerable at present, since there is a complete lack of data on DOC (or TOC) levels in marine aquariums. Thus, basic data like basal TOC levels in successful aquariums, and how those levels might change in response to various stimuli (i.e., tank inhabitants, feeding, different husbandry techniques, ± skimming, ± GAC, ± ozone, etc) have yet to be recorded. Only after a broad and comprehensive database of marine aquarium DOC (TOC) levels has been compiled can some judgments about the significance of DOC levels on coral (and overall livestock) health be offered.
A first attempt to acquire some of these data is described below.
Do our reef tanks accurately mimic the natural levels of carbon on thriving reefs?
Accurate and reliable reports of DOC and/or TOC levels in thriving reef aquariums have not yet been reported. However, this type of information is essential for evaluating the hypothesis that DOC/TOC levels can impact on the health of the livestock, particularly the corals, in this captive environment. Measured DOC/TOC values in tanks that were established and maintained under different types of husbandry protocols can begin to provide glimpses into that part of the relationship between “aquarist style” and overall outcome (i.e., coral health) that is mediated by the water’s carbon content. In order to approach this goal, an initial series of studies on the author’s reef aquarium were performed. TOC and not DOC was chosen as the measured parameter, because measuring DOC would (1) require filtration of the tank water samples prior to analysis in order to remove POC (particulate organic carbon). Other researchers have found that this filtration procedure contaminates samples with carbon. On this point, control experiments showed that 0.2 micron filters required washing with as much as 50 mL of ultrapure MilleQ distilled/RO/DI 18.2 M water in order to diminish the carbon measurement of a water sample to pre-filtering levels. That operation was not practical for the amount of samples examined. (2) Eliminate the POC component, which is also a food source, and (3) provide no further useful information, as DOC is typically > 95% of TOC in any event. The Shimadzu 5000 TOC analyzer, the same instrument/method used in the authentic reef TOC/DOC measurements reported in Table 1, was used in these experiments as well. Each data point was recorded as the average of three independent measurements on samples drawn within 1 minute of each other.
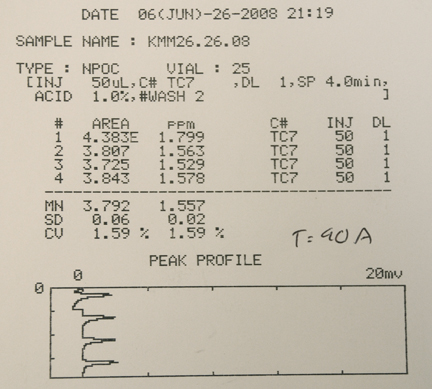
Experimental protocol: Each sample was collected by dipping an inverted 40 mL pre-washed I-CHEM custody seal vial (VWR catalogue # 15900-022) under the surface of the aquarium to a depth of about 6 inches, and then rotating it so that it filled with tank water. There is some discussion in the aquarium hobby that the surface of a reef tank collects organics at the air-water interface, but our measurements of TOC content in surface water vs. 6″ depth water vs. 24″ depth water provided no support for that hypothesis. The vial was immediately removed, sealed with a Teflon-septum cap, labeled, and the cap area was tightly covered with aluminum foil to exclude dust from settling on the Teflon septum. The vial was then placed in a -23 oC freezer to quickly freeze the contents. The vials from an experiment were collectively thawed in warm water and submitted to the Shimadzu Analyzer within 60 min of removal from the freezer. A sample of 18.2 M water was added directly to a clean vial as a blank, and the TOC reading from that blank was subtracted from the TOC values of all of the samples. Typical blank readings ranged from ~ 0.12 ppm to 0.25 ppm. Experience with the Shimadzu instrument suggests that the origin of this “blank” carbon lies with residue in the combustion tube itself, and not in the 18.2 M water. Thus, blank subtraction is a legitimate and necessary component of the analysis. The TOC Analyzer reports ppm C values based on a calibration curve using potassium hydrogen phthalate as a standard, over the range 0.5 ppm to 11 ppm of C. Using this particular calibration chemical, and preparation of the calibration curve, is standard operating procedure with the Shimadzu 5000. Each sample is analyzed 3 – 5 separate and independent times, until the spread of the TOC values falls within a preset range. An example of a typical output is shown in Fig. 2.

Figure 2. Aquarium researcher Kelly Maers and the Shimadzu 5000 TOC Analyzer; an example of a typical experimental TOC output.
The TOC content of the author’s tank, and ORP readings at the same time points, were measured over the course of a typical week, Fig. 3. This tank is a 175 Oceanic bowfront equipped with a sump holding a total water volume of 167 gallons (Feldman, 2006). A survey of the livestock contained in this reef tank can be seen in Figs. 7 and 8. No change in stocking occurred during the experimental period. A 17% water change was conducted at T = 0 hr, and then water samples (in triplicate) were removed at several intervals during the day, for 7 days (until the next water change). The lighting schedule is illustrated in Fig. 3; illumination was provided by two 400W Geismann 14K MH bulbs and one 175W Iwasaki 15K bulb. An H&S A200/1260 skimmer was run continuously except for a 2-hr time period after the heavy feedings. A calcium reactor and a UV sterilizer were run continuously. The water temperature was held at 75 – 77 oF by heaters and a chiller slaved to an
Aquacontroller II. Water circulation was provided by a SeaSwirl on the sump return, two Vortek MP40w pumps and one tunze 6100 pump. The feeding schedule is illustrated as F1 (heavy feeding) or F2 (light feeding) on the graph of Fig. 3, and actual food portions are pictured in Fig. 4. The fish eat the larger chunks of meaty food, whereas the fine particles of zooplankton, phytoplankton, cyclopeeze and even copepods are more geared to the feeding requirements of the various invertebrate filter feeders, including the large- and small-polyped corals. The fish readily consumed their portion of the heavy feeding’s food over the course of 1-3 min. The light feeding’s food (Formula 1) was consumed primarily by the C. interruptus over approximately a 10-min period.
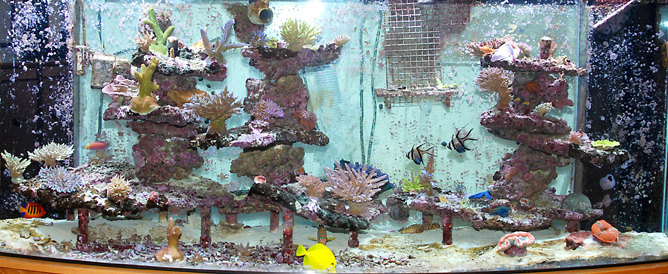
Figure 3. A week in the life. Total Organic Carbon (TOC) and Oxidation/Reduction Potential (ORP) measurements over the course of a week for the author’s reef tank.
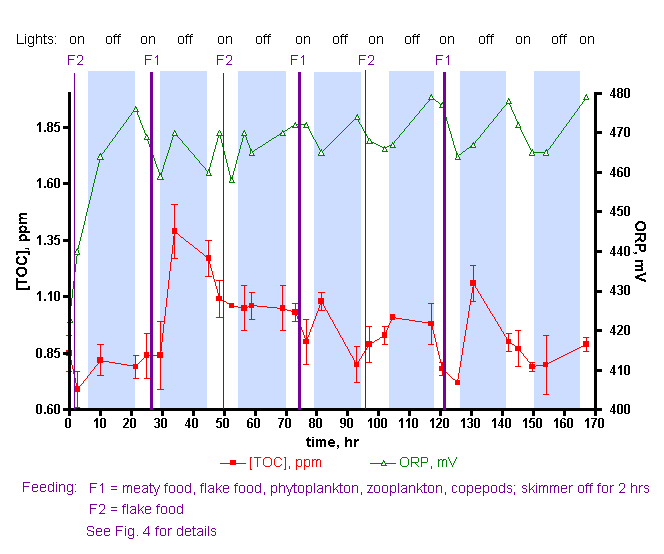
Even cursory inspection of the data displayed in Fig. 3 reveals five immediate conclusions: (1) the TOC level is responsive to food addition, with maxima occurring approximately 6 – 9 hrs after (heavy) feeding. (2) The overall TOC levels span a range (~ 0.7 ppm – 1.4 ppm) that is completely coincident with values observed in the water over tropical reefs (cf. Table 1). (3) There is no useful correlation between TOC values and ORP values. (4) The illumination cycle didn’t seem to influence the TOC levels. (5) Only the heavy feedings appear to contribute materially to the TOC level; the light (Formula 1) feedings, which consisted of food not sized appropriately for immediate consumption by corals, bacteria or other filter feeders, has no measurable effect on TOC levels. It is rapidly eaten by the interruptus before it has a chance to work its way down to the lower levels of the food chain.
Looking beyond the obvious, two intriguing questions emerge from considering the rise and fall of TOC levels after heavy feeding. The results of Ferrier-Pagès on the Galaxea fascicularis system provide guidance on these topics.
- What is the origin of the TOC spike that appears after feeding?

Figure 4. Examples of food used in the “week in the life” tank study.
- What is the origin of the post-spike TOC decrease?

What is the origin of the TOC spike that appears after feeding?
In the several corals examined by Ferrier-Pagès and independently by Means, a delay in DOC level rise following feeding was observed, suggesting that secondary organic molecule emissions and not primary food particulates were responsible for the elevation in DOC levels. Argument-by-analogy suggests that the TOC spike in the author’s tank therefore is not likely due to the food itself. Consistent with this interpretation are the observations that (a) there was no visible evidence of food particulates in the water samples, and (b) the immediate TOC measurement 2-3 hr after heavy feeding did not display elevated TOC levels; in fact the TOC level actually decreased slightly during that time period. It was only approximately 6-9 hrs later that the TOC level peaked. Similar delays were documented in the Ferrier-Pagès studies. In both the various Ferrier-Pagès studies and in the author’s tank, the several-hour delay between feeding and TOC discharge is consistent with the intervention of coral-based metabolic processes that convert food into emitted DOC, the signature of which is coral mucus secretion. Of course, other tank inhabitants absent in the Ferrier-Pagès work might contribute to DOC emissions as well.
What is the origin of the post-spike TOC decrease?
The fairly rapid decrease of TOC levels after the post-feeding spike also is reminiscent of the behavior of the various corals of Ferrier-Pagès. In fact, the TOC levels return to values very near the pre-feeding ones within a specific number of hours in both the Ferrier-Pagès studies (~ 2 hrs) and the week-in-the-life study of Fig. 3 (< 10 hrs). The Galaxea system observations were interpreted by Ferrier-Pagès as evidence for DOC consumption by coral bacteria. In addition, the carbohydrate dosing experiments of Rohwer indirectly support the notion that the coral bacteria in the author’s tank are prime consumers of TOC.
On the other hand, the TOC decrease in the author’s tank also might fall within the expectations of nutrient export via protein skimming as provided by the H&S A200, a device absent in the Galaxea experiments. Is it just TOC consumption by coral bacteria and possibly other microbiota, or does the aggressive skimming of the H&S A200 contribute to the general drop in TOC levels by physically removing at least some components of TOC? Using Ferrier-Pagès experiments as a guide, it is not necessary to invoke skimmer participation; the drop in TOC levels may be attributable largely to coral bacteria feeding. But, is that the whole story, or does the skimmer contribute to the TOC depletion as well? This question can be answered through the experiments illustrated in Figs. 5 and 6.
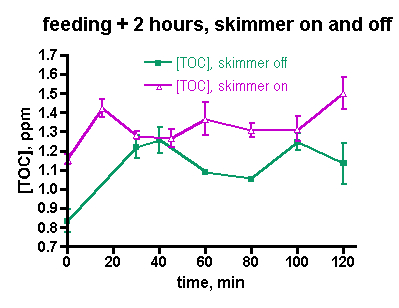
Figure 5. TOC levels with and without active skimming, up to 2 hrs after feeding.
The data of Fig. 3 were taken under routine tank husbandry conditions that including turning the skimmer off for 2 hrs after heavy feeding. In order to focus on the TOC depletion capabilities of the skimmer itself, a pair of skimmer-on/skimmer-off trials was run on successive days. On the first day, the tank was heavily fed and the TOC level was monitored every 15 minutes for 2 hrs. The skimmer was off during the feeding and the 2 hr experimental time period. On the second, day, the skimmer was left on during the feeding and subsequent 2 hr period. The TOC levels under both experimental regimes were remarkably similar, Fig. 5. In both cases, the TOC level elevated, but the relative increase in the skimmer-on case was only half that seen in the skimmer-off experiment (22% vs. 45%, respectively). In neither case did the TOC level drop significantly over the 2 hr experimental period. Based on these data, it is possible that the skimmer marginally removes some TOC early in the experiment, but the impact is not dramatic. The TOC data from these experiments covers a region in time (the first two hours after feeding) that was not examined in the week-in-the-life measurements; therefore, it is not possible to draw any conclusions about whether these data sets are similar to, or disparate from, the week-in-the-life data.
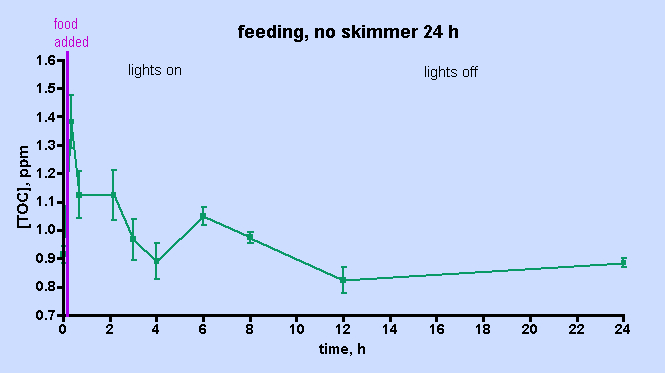
Figure 6. TOC levels over a 24 hr period after feeding, with the skimmer off.
The data displayed in Fig. 5 was intriguing and also counterintuitive in that it appears to assign a rather limited role to the skimmer in depleting the aquarium water of TOC. However, the short experimental time frame might provide an incomplete picture of the skimmer’s effect; perhaps examining the TOC level over a longer period of time under skimmerless conditions will provide more conclusive evidence on the role of the skimmer one way or the other. Therefore, the skimmer-off experiment was repeated, with data collection continuing over a 24 hr period, Fig. 6. The TOC level spiked after about 30 min (~ 50% increase) and then it begins to decrease by the 1 hr mark. In total, these data unequivocally demonstrate that the H&S skimmer is not required to deplete the aquarium water of TOC. Apparently, naturally biological processes are sufficient in and of themselves to return the post-feeding TOC levels to their pre-feeding values after about 4 hrs or so. A small spike follows at the 6 hr mark, an increase in TOC level similar to that seen at 6-9 hr after heavy feeding in the “week-in-the-life” data of Fig. 3. After that spike, the TOC level declines to the pre-feeding value by the 12- and 24-hr marks; again similar behavior was seen in the “week-in-the-life” data. Thus, the post-feeding TOC decrease displayed in the data of Fig. 3 can be explained by simply citing TOC consumption (by coral bacteria?) and not TOC removal by the skimmer. The skimmer may in fact contribute to the depletion of TOC, but its participation is not required by the data. Clearly the skimmer is doing something, given the copious residue accumulated in the collection cup at the end of the week. Perhaps, however, the residue removed by the skimmer is only a rather small, even inconsequential, portion of the entire TOC load that develops in the aquarium water over the course of a week as a consequence of both feeding and all of the photosynthetic activity (CO2 –> organic carbon (carbohydrates)) contributed by the tank’s phototrophic (= conducting photosynthesis) inhabitants. If the skimmer was much more efficient at removing TOC than it appears to be, then perhaps the TOC level within an aquarium might drop down below the “healthy reef” region defined by the data in Table 1 and into the oligotrophic (= nutrient poor) region of the deep ocean, an environment not hospitable to corals (cf. Table 1). That type of TOC decline might prove disastrous for the coral holobiont, which presumably has evolved to thrive in waters with a TOC content in the 0.7 – 1.6 ppm range. This provocative speculation really raises the question, “Is it necessary to purchase a large “killer” skimmer, or will a more modestly priced and smaller unit serve equivalently for keeping the TOC level in the range acceptable to corals and other inhabitants of our reef aquariums?”


Fish population in the author’s tank during the “week in the life” study.
Editor’s Note: Part II of this article will be published in next month’s Advanced Aquarist.


0 Comments