

In the first part of this series we began our discussion of carbonate chemistry by identifying each parameter of the carbonate system in sea water as well as normal values for each in the sea water overlying coral reefs. In the second part we considered the important interactions among these parameters. We saw that seawater pH (at a given temperature and pressure) is controlled principally by the interaction of total CO2 (TCO2) with total alkalinity. The total CO2 tugs seawater pH down while the total alkalinity pulls it back. The pH we measure at any given moment is the result of this tug of war between total CO2 and total alkalinity. Dissolved calcium and magnesium don’t directly participate in the battle for H+, but they do directly affect the precipitation and dissolution of carbonate minerals.
As calcifying marine organisms produce their calcified structures, they reduce the calcium concentration, alkalinity, and, to a smaller extent, magnesium concentration of the water in which they reside. To keep our organisms healthy, happy, and growing we must replace calcium, alkalinity, and magnesium lost to calcification, and by using methods that will keep the pH within a tolerable range for the organisms in our aquaria. Further, pH itself plays a critical role in the precipitation and dissolution of carbonate minerals because of its strong influence on CO32- concentration.
A variety of methods have been devised for maintaining carbonate chemistry parameters in aquaria. Some have proven very effective while others are much less so. Each method comes with a set of caveats, and each can have slightly different effects on the carbonate system, depending on the specifics of that method. This month we’ll discuss methods that are commonly utilized by aquarists to manipulate carbonate chemistry, yet prove to be less than ideal at encouraging growth in calcifying organisms.
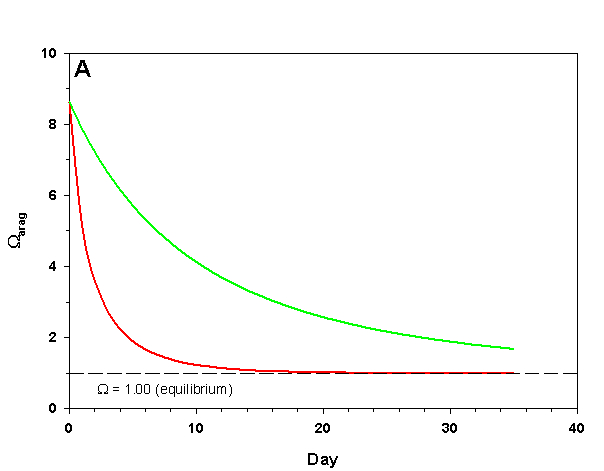
Figure 1a. Effects of method 1 on water chemistry parameter ‘Arag’ (supplement nothing) for the “high demand” (red) and “low demand” (green) aquaria. See text for details on aquaria.
Methods That Don’t Work Well
Method 1: Supplement nothing
This is the simplest of all methods: do nothing, and hope for the best. While it may be clear to some why this method isn’t going to be effective at growing calcifying organisms, let’s consider why that is a bit more specifically.
Let us imagine a pair of aquaria with identical starting conditions: 412 ppm Ca2+, 4.0 meq kg-1 (~ 11.5 dKH) total alkalinity, constant atmospheric CO2 (380 atm), salinity (35 ppt), temperature (25 °C), and pressure (1 atm), and negligible phosphate and silicate concentrations-typical of the sea water we might find in a home aquarium. The first aquarium we’ll define operationally as a “low demand” aquarium with regard to calcium and alkalinity: 0.2 meq kg-1 of alkalinity and 4 ppm Ca2+ are consumed by the calcifying organisms over the course of a day at the starting conditions. The other aquarium we’ll define operationally as a “high demand” aquarium: 1.0 meq kg-1 of alkalinity and 20 ppm Ca2+ are consumed by the calcifiers over the course of a day at the starting conditions. These two rates of consumption encompass the range often seen in aquaria.
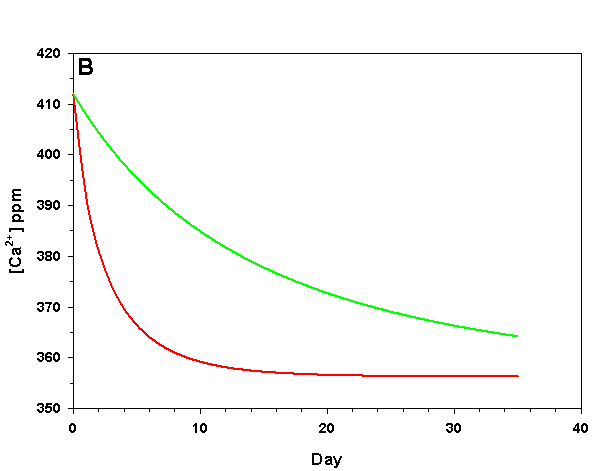
Figure 1b. Effects of method 1 on water chemistry parameter ‘Ca’ (supplement nothing) for the “high demand” (red) and “low demand” (green) aquaria. See text for details on aquaria.
The rate of CaCO3 precipitation can be described by an equation of the form,
R = k(-1)n
where R is the rate of precipitation, k is a rate constant, is the saturation state, and n is the order of the reaction (i.e., first order, second order, etc.).
For this thought exercise let us assume that the rate of calcification in our model organisms is directly proportional to the aragonite saturation state (arag). While this assumption isn’t necessarily appropriate for all organisms, it is still useful for our purposes, and likely to be reasonably analogous to a net community response. As we discussed last time, arag is an index of how much “extra” CaCO3 is dissolved in water. When arag is greater than 1 we expect to see net precipitation (calcification, in this context) and when arag is less than 1 we expect to see net dissolution. In order for our model organisms to grow their shells/skeletons arag therefore has to be higher than 1.00. The lower arag is, the slower they calcify. Assuming a direct relationship between arag and calcification, the order of the reaction (n) is 1 and k is easily calculated from the initial rate of CaCO3 consumption (0.2 and 1.0 meq kg-1 of alkalinity) and the initial chemistry.
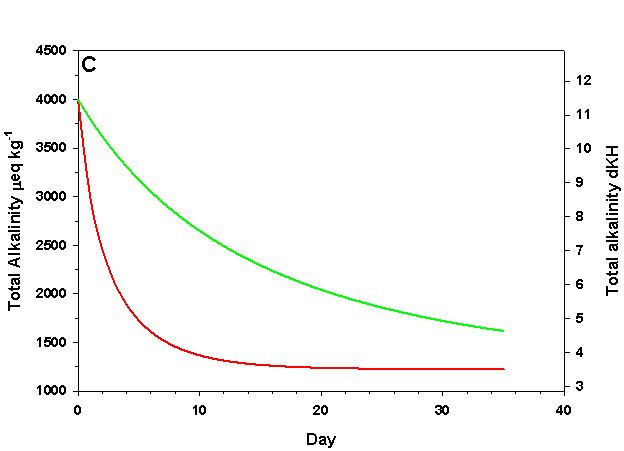
Figure 1c. Effects of method 1 on water chemistry parameter ‘total alkalinity as eq kg-1 (left) and dKH (right)’ (supplement nothing) for the “high demand” (red) and “low demand” (green) aquaria. See text for details on aquaria.
If we fill up our aquaria with seawater, add calcifying organisms and wait we will see a decrease in arag over time, as the organisms reduce Ca2+ concentration and alkalinity through calcification. The pH will also fall due to the reduced alkalinity at constant pCO2. From a starting value of arag = 8.63 (very good for calcification) we see that in the high demand aquarium arag rapidly falls to near 1.00 over the course of 25 days (Figure 1). In our low demand aquarium we see a slower drop in arag, but the same general pattern (Figure 1).
How does this method compare to the results we would expect if we were to maintain Ca2+ and alkalinity at the initial values? After 35 days the organisms in our low demand aquarium will have calcified only 34% as much as if Ca2+ and alkalinity had been maintained. For our high demand aquarium the results are much worse: after 35 days the organisms will have calcified 8% as much as if we had maintained our parameters, and will experience zero net calcification after 25 days. If our goal is to promote rapid, healthy growth in calcifying organisms this method is clearly a poor choice even in low demand aquaria, and is wholly ineffective in high demand aquaria.
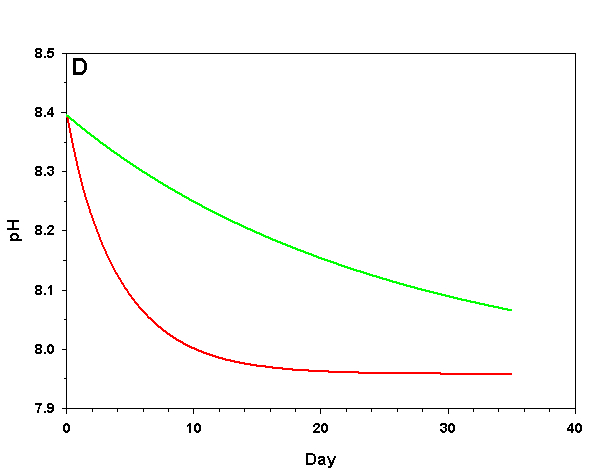
Figure 1d. Effects of method 1 on water chemistry parameter ‘pH’ (supplement nothing) for the “high demand” (red) and “low demand” (green) aquaria. See text for details on aquaria.
Method 2: Rely on water changes to replace calcium and alkalinity
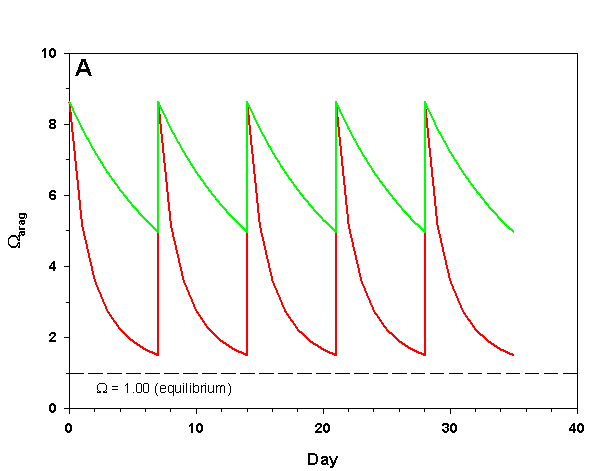
Figure 2a. Effects of method 2 (water changes) on water chemistry parameters for the “high demand” (red) and “low demand” (green) aquaria. See text for details on aquaria. Results of 100% weekly water changes on Arag.
This method is a variation of method 1, supplement nothing. Here, however, we are at least replenishing some of the calcium and alkalinity lost to calcification through water changes. This method can produce much better or only marginally better results than method 1, depending on how it is employed. Even so it is still clearly suboptimal.
We will consider our two example aquaria, as defined in the section above, but with two water change regimes: a 100% weekly exchange and a 10% weekly exchange. These two regimes encompass the range I have seen advocated when using this method. The changes in water chemistry with these two regimes are depicted in Figure 2.
With a 100% weekly water change our low demand aquarium attains 83% as much calcification after 35 days as we would expect if we were maintaining parameters. Our high demand aquarium attains 36% as much calcification after 35 days as we would expect maintaining parameters. With 10% weekly water changes we obtain results little better than doing none at all: our low demand aquarium calcifies 44% as much after 35 days as what we would expect if we were maintaining parameters; our high demand aquarium calcifies 11% as much after 35 days as we would expect maintaining parameters. Replacing calcium and alkalinity with frequent, large water changes in low demand aquaria can be functional, albeit suboptimal. Infrequent water changes, or frequent, large changes in high demand aquaria, is little better than doing nothing at.
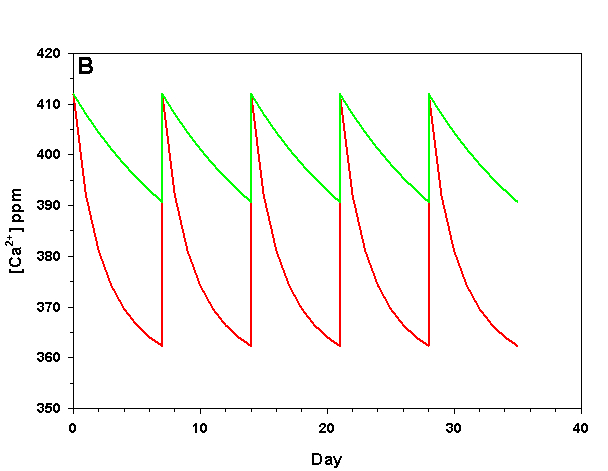
Figure 2b. Effects of method 2 (water changes) on water chemistry parameters for the “high demand” (red) and “low demand” (green) aquaria. See text for details on aquaria. Results of 100% weekly water changes on calcium concentration.
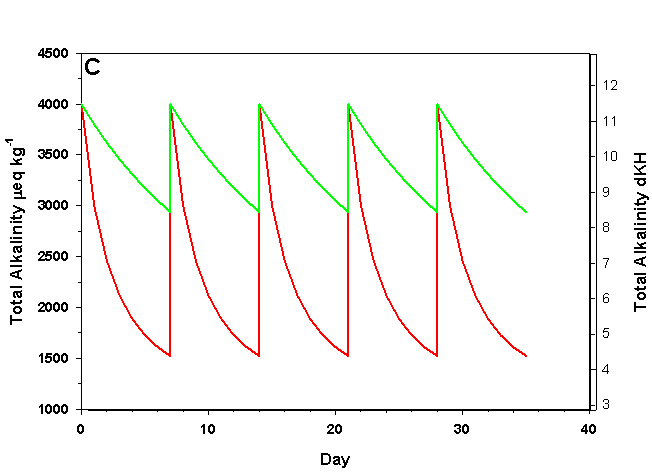
Figure 2c. Effects of method 2 (water changes) on water chemistry parameters for the “high demand” (red) and “low demand” (green) aquaria. See text for details on aquaria. Results of 100% weekly water changes on total alkalinity as eq kg-1 (left) and dKH (right).
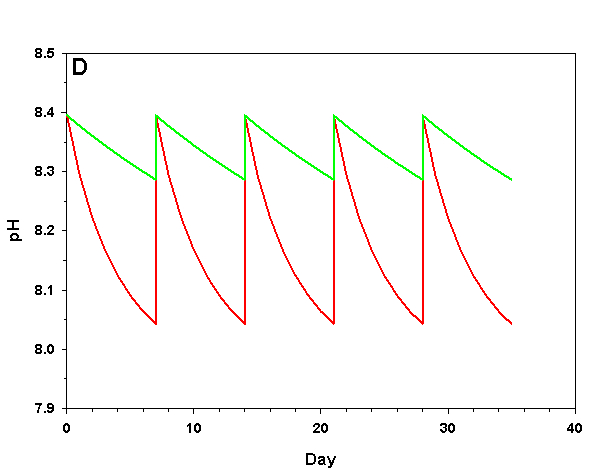
Figure 2d. Effects of method 2 (water changes) on water chemistry parameters for the “high demand” (red) and “low demand” (green) aquaria. See text for details on aquaria. Results of 100% weekly water changes on pH.
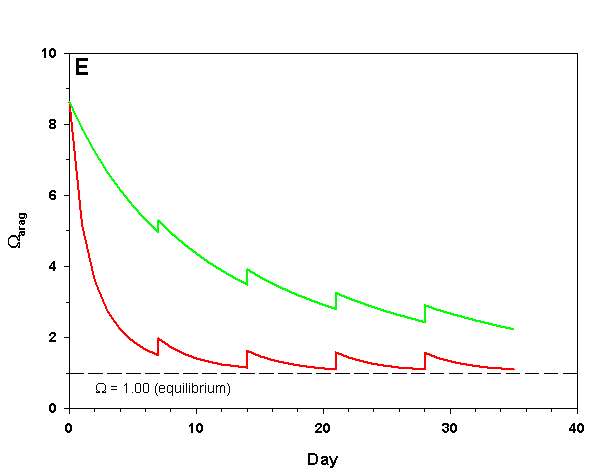
Figure 2e. Effects of method 2 (water changes) on water chemistry parameters for the “high demand” (red) and “low demand” (green) aquaria. See text for details on aquaria. Results of 10% weekly water changes on Arag.
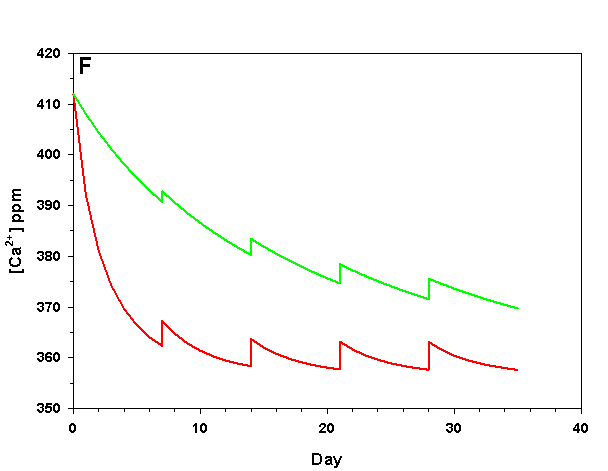
Figure 2f. Effects of method 2 (water changes) on water chemistry parameters for the “high demand” (red) and “low demand” (green) aquaria. See text for details on aquaria. Results of 10% weekly water changes on calcium concentration.
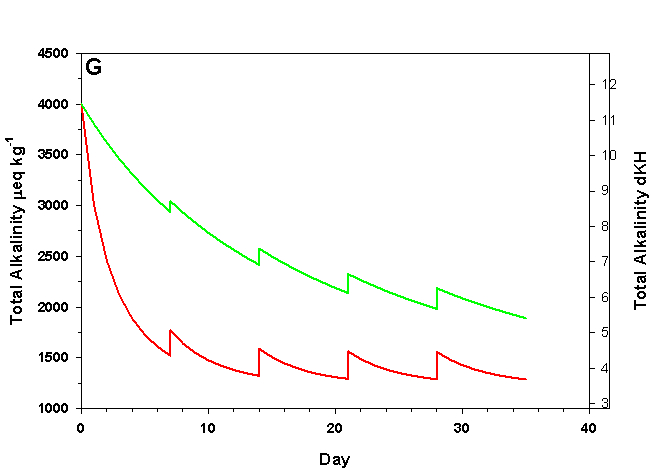
Figure 2g. Effects of method 2 (water changes) on water chemistry parameters for the “high demand” (red) and “low demand” (green) aquaria. See text for details on aquaria. Results of 10% weekly water changes on total alkalinity as eq kg-1 (left) and dKH (right).
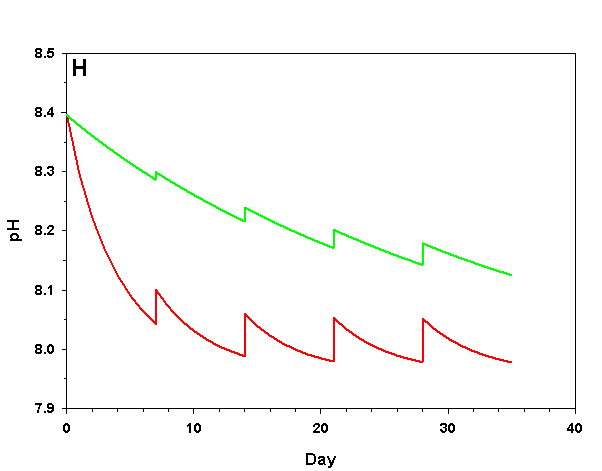
Figure 2h. Effects of method 2 (water changes) on water chemistry parameters for the “high demand” (red) and “low demand” (green) aquaria. See text for details on aquaria. Results of 10% weekly water changes on pH.
Method 3: Rely on CaCO3 dissolution in the tank to replace calcium and alkalinity
I’ve personally viewed aquaria that had been run literally for years without any significant water exchanges (< 10% per year) and no calcium or alkalinity supplementation of any kind. Instead, thick beds of aragonite sand and gravel were placed on the bottoms of the tanks with the intention that they would dissolve and provide needed calcium and alkalinity to the calcifying organisms. Indeed, many companies that sell calcareous sand/gravel for use in aquaria prominently advertise the supposed buffering effect of such substrates as a means to help stabilize and maintain calcium and alkalinity in aquaria. Unfortunately, such claims make mountains out of proverbial mole hills.
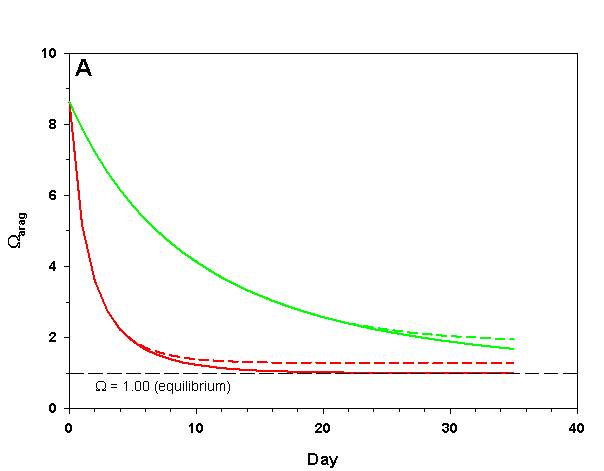
Figure 3a. Effects of method 1 (do nothing) (solid lines) compared to method 4 (CaCO3 dissolution) (dashed lines) on water chemistry parameters for the “high demand” (red) and “low demand” (green) aquaria. This graph shows details for Arag.
The first point to consider here is whether or not solid carbonate minerals (usually as aragonite as sand/gravel beds) are likely to dissolve in our aquarium water at all. Our model organisms only calcify to the point that arag drops to 1.00. In order for aragonite sand/gravel to dissolve, arag must drop to less than 1.00, which does not occur in the main water column (on average). Hence, aragonite sand/gravel exposed to the ambient sea water is about as likely to dissolve as the skeletons of the organisms in our aquaria. Under these conditions aragonite does not and cannot buffer the water.
Once we penetrate below the surface of a sand bed or of live rock we encounter an environment chemically different from the ambient aquarium water. In these interstitial spaces high densities of microbes and infaunal organisms (polychaete worms, sipunculans, sponges, etc.) make a living. They draw food from the water column, whether detritus, plankton, or whatever else, into these spaces, digest it, and release CO2 as a respiratory byproduct. As a result, the dissolved CO2 concentration in porewater is typically much higher than in the overlying water column, resulting in lower pH, CO32- concentration, and than in the overlying water column. Because of this local reduction of dissolution of carbonate minerals can occur in sand beds and live rock. In addition, some bioeroding organisms, such as boring sponges, actively secrete organic acids into the reef structure, dissolving out a place to live. The aragonite sand in sand beds and the aragonite + hi-Mg calcite in our live rock can, at times, dissolve in our aquaria due to the locally low conditions in the porewater. The real question, however, is not does this mechanism exist, the question is how fast sand and live rock dissolve, and can they dissolve fast enough to buffer against the drop in Ca2+ and alkalinity caused by our calcifying organisms?
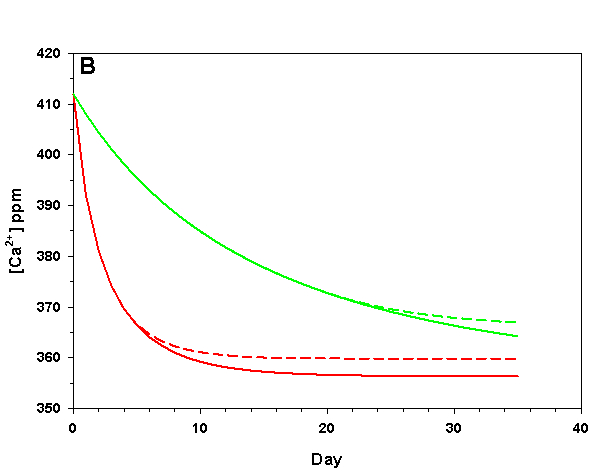
Figure 3b. Effects of method 1 (do nothing) (solid lines) compared to method 4 (CaCO3 dissolution) (dashed lines) on water chemistry parameters for the “high demand” (red) and “low demand” (green) aquaria. This graph shows details for Calcium concentration.
The rate of CaCO3 dissolution can be described by an equation of the form,
R = k(1-)n
where R is the rate of dissolution, k is a rate constant, is the saturation state, and n is the order of the reaction. The general form of this equation is very similar to that for carbonate precipitation (above), but note that the rate constant, k, and order of the reaction, n, are usually distinct for the forward and reverse reactions.
Here again we refer back to our two model aquaria, as defined in method 1. For sake of simplicity, and because the data were collected from natural reefs, I have utilized data from Yates and Halley (2006) as a guide for rates of carbonate dissolution we are likely to encounter in our aquaria. In particular, I have used data collected over natural carbonate sand. It is important to note that dissolution measured by Yates and Halley (2006) under natural conditions was likely due principally or even entirely to dissolution of hi-Mg calcite (produced by the abundant coralline algae, echinoderms, etc. on reefs) and therefore likely sets an upper limit to the rate of dissolution of sand and live rock we are likely to encounter in our aquaria. For this calculation I have set a ratio of 400 l volume to 1 m2 surface area for our two aquaria, which is approximately similar to the volume to surface area ratio for a 20 gal tall or 75 gal aquarium. Only drastically different volume to surface area ratios (e.g., 10 l volume to 1 m2 surface area) are likely to significantly alter our results. I have also assumed that any abiotic cementation occurring within the sand bed or live rock has already been taken into account with our measured rates of CaCO3 consumption.
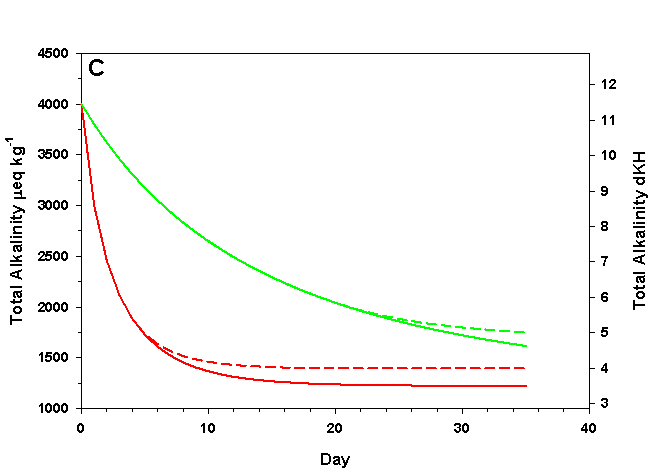
Figure 3c. Effects of method 1 (do nothing) (solid lines) compared to method 4 (CaCO3 dissolution) (dashed lines) on water chemistry parameters for the “high demand” (red) and “low demand” (green) aquaria. This graph shows details for total alkalinity as eq kg-1 (left) and dKH (right).
As we see in Figure 3, the sand and/or live rock in our tanks would begin to slowly dissolve without CaCO3 supplementation. Solid CaCO3 begins to dissolve after only three days in our high demand aquarium, or after 19 days in our low demand aquarium. However, the initial rates of dissolution are very low, and insufficient to counteract the ongoing calcification in either aquarium. After 17 days arag in our high demand aquarium has dropped low enough that the rates of calcification and dissolution are equal. Our low demand aquarium follows the same pattern, albeit more slowly. Our sand bed/live rock have indeed buffered the aquarium water, keeping net calcification from dropping to zero. Unfortunately, the rate of calcification in the chemistry where our aquaria will stabilize is < 4% the rate we would obtain if we were maintaining our parameters, and this is an estimate of a likely upper limit for the buffering effect of a sand bed/live rock.
Aragonite sand and live rock can and do dissolve very slowly in our aquaria, and in so doing provide a tiny buffer against calcification. This buffer effect, however, is so small as to be essentially inconsequential and is sufficient to offset only an extremely low rate of calcification. The amount of calcification we could obtain after a year with supplementation would take perhaps 25 yrs to achieve by relying on the dissolution of our sand bed and live rock. Clearly this method is a poor choice.
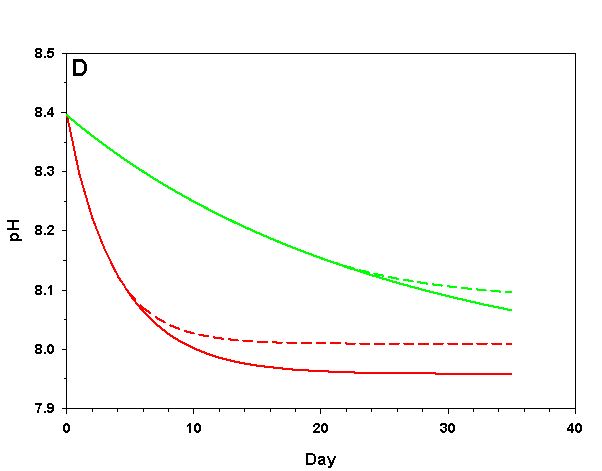
Figure 3d. Effects of method 1 (do nothing) (solid lines) compared to method 4 (CaCO3 dissolution) (dashed lines) on water chemistry parameters for the “high demand” (red) and “low demand” (green) aquaria. This graph shows details for pH.
Method 4: Supplement the aquarium with solid CaCO3
There are quite a number of reef aquarium supplements that are comprised largely or entirely of fine CaCO3 sand or powder, and there seem to be new ones introduced almost every year. A few of the common supplements that fall into this category include: AragaMight, AragaMilk, Fiji Gold, and Purple Up (though Purple Up does have some CaCl2 as well, which can raise Ca2+ slightly). I have no doubt that they will be joined by other similar products in the future. These supplements are ineffective buffers for the reasons outlined above. They do not dissolve unless exposed to undersaturated conditions, unlike those that occur in our aquaria, except in the porewater within sand beds and live rock. These supplements are not necessarily any more effective for supplementing CaCO3 than the sand beds and live rock already in most aquaria, though they are usually sold for much steeper prices than a mere bag of aragonite sand. In fact, dosing these products may reduce Ca2+ and Mg2+ concentrations and alkalinity, not raise them. These supplements provide ideal nucleation sites for the abiotic precipitation of hi-Mg calcite from the water column, potentially reducing Ca2+ and Mg2+ concentrations and alkalinity to lower levels than would be obtained if they were not used at all. These supplements are not only ineffective for the purpose of maintaining Ca2+, Mg2+, and alkalinity in aquaria, they may be counterproductive. I recommend that this type of supplement be entirely avoided by aquarists.
Conclusion
While the above supplementation schemes are often utilized by aquarists, none of them prove very effective for growing calcifying organisms in captivity. Under any of these schemes Ca2+ and alkalinity fall rapidly, yielding somewhat lower to substantially lower rates of calcification as compared to what we would expect if we were maintaining parameters. If we wish to promote strong growth in corals, clams, coralline algae, and other calcifying organisms it is vital that we choose a supplementation scheme that is sufficient to maintain carbonate system parameters over time. Each of the methods outlined above is best left by the wayside in favor of better methodology. Next time we will consider common methods used to manipulate carbonate chemistry parameters that have proven extremely effective in aquaria.
References
- Yates KK, Halley RB (2006) CO32- concentration and pCO2 thresholds for calcification and dissolution on the Molakai reef flat, Hawaii. Biogeosciences. 3:357-369.
0 Comments