

The rather counterintuitive observation that protein skimmers remove only 20 – 35% of the measurable Total Organic Carbon (TOC) in reef aquarium water (Feldman, 2009; Feldman, 2010) begs the question, “what is all that “stuff” that collects in our skimmer cups?” Is it really TOC, or at least a labile, or “skimmable”, fraction of TOC? Attempts to identify TOC components from authentic ocean water are still in their infancy, and to date this material has resisted detailed chemical analysis. Recent efforts primarily by Hatcher and colleagues (Mopper, 2007; De la Rosa, 2008) using sophisticated mass spectrometry and nuclear magnetic resonance spectroscopy techniques have revealed that authentic ocean TOC is comprised of tens of thousands of discrete compounds that include chemical representatives from all of the major biochemical groups; lipids, peptides, carbohydrates, heterocycles, aromatics, etc. The relationship between ocean TOC and aquarium TOC still remains to be established, but it seems likely that the TOC in our aquaria is equally diverse and rich in its chemical complexity. Thus, it is equally unlikely that a chemical breakdown of aquarium TOC will be forthcoming in the near future. Nevertheless, there are analytical methods that can reveal and quantify most of the elemental components of TOC, and with a little chemical intuition, allow for the assignment of some of these components to chemical categories. These analytical methods are called Elemental (or Combustion) Analysis and Inductively Coupled Plasma Atomic Emission Spectroscopy. Both methods are available from many commercial operations; we used Columbia Analytical Services in Tucson AZ for our skimmate samples (http://www.caslab.com/).
Experimental Results
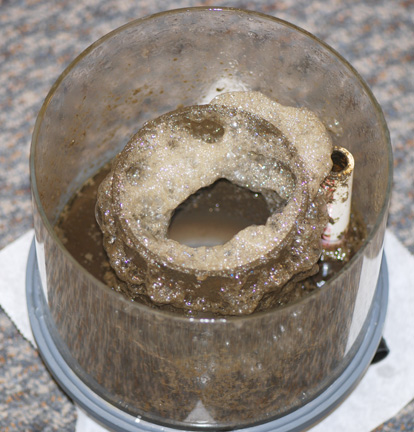
Figure 1a. Skimmate from 4 days of collection with an H&S 200-1260 on an unfed tank, before concentration.
All skimmate samples were obtained from the collection cup of an H&S 200-1260 skimmer running on a 175-gallon reef tank under the author’s care. During the time of these collections, the tank contained 10 fish (pair of Pterapogon kauderni (Banggai cardinals), pair of Liopropoma carmabi (candy bass), Centropyge loriculus (flame angel), Centropyge interrupta (Japanese pygmy angel), Oxycirrhites typus (longnose hawkfish), Zebrasoma flavescens (yellow tang), Amblygobius bynoensis (byno goby) and Synchiropus splendidus (mandarin)), approximately 40 coral colonies from the SPS, LPS and chalice categories, and a few dozen snails and hermit crabs. No soft corals or clams were present. Typical daily feedings included one cube of Hikari mysis shrimp, one cube of PE mysis shrimp, a pinch of flake food, and a pinch of pellet food. Thrice weekly, the Reef Nutrition products Phytofeast, Rotifeast, Oysterfeast and Arctipods were used, and a sheet of nori was added once per week. The skimmer cup was cleaned weekly, and Granular Activated Carbon (GAC), Granular Ferric Oxide (GFO), a calcium reactor, and a UV sterilizer all were used continuously. Seventeen percent of the water volume was changed weekly, and tank parameters were measured on a weekly basis as well; [TOC] = 1.4 ppm (1 hr after feeding) – 0.5 ppm (24 hrs after feeding), [Ca] = 390 – 410 ppm, [Mg] = 1230 – 1260 ppm, [alk] = 3.5 – 4 meq/L, salinity = 34.5 – 36 ppt, pH = 7.8 (lights on) – 8.1 (lights off), [NO3] < 0.5 ppm, no measurable NH4, NO2, or PO4. Illumination was provided by two 400W 14K Geissmann metal halide bulbs and one 175W 15K Iwasaki metal halide bulb on an 8-hr on, 16-hr off cycle. No additives except CaCl2•2H2O were used.
Our initial experiment was designed to probe the composition of the water-insoluble solid material removed by a protein skimmer. Skimmate was collected over 4 days without any food addition to the aquarium, Fig. 1. The liquid and solid contents of the H&S 200-1260 skimmer cup were carefully removed after this time period and concentrated to dryness through initial liquid evaporation under reduced pressure and then vacuum drying at 110 oC/0.2 mm. This procedure effectively removes almost all of the water (see below), and of course any volatile components of the skimmate. Seventeen grams of gray-brown solid resulted, see Fig. 1.
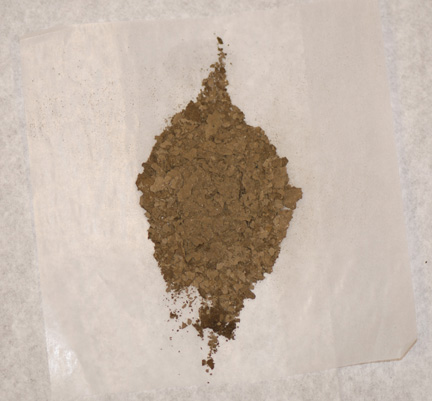
Figure 1b. Skimmate from 4 days of collection with an H&S 200-1260 on an unfed tank, after concentration.
Four grams of this crude skimmate were suspending in 100 mL of distilled water and vigorously stirring for several hours. The mixture was then separated by centrifugation at 6000 rpm/10 min, and the supernatant was poured off and discarded. This procedure was repeated 3 times, and then the remaining material was vacuum dried at 110 oC/0.2 mm for 48 hours to afford 0.47 gm of gray-green solid. Note that CaCO3 must be heated to > 900 oC to burn off CO2. This solid was subjected to elemental analysis as described above at Columbia Analytical Services:
- C: 21.08 %
- H: 2.39 %
- N: 2.22 %
- Ca:17.43 %
- Mg: 1.35 %
- Si: 4.76 %
- P: 0.16 %
These data can be interpreted with some application of chemical intuition and some assumptions.
1) Calcium analysis
17.43 % by weight Ca implies that the total amount of Ca in the 470 mg sample is 82 mg. Assuming that all of this Ca is in the form of calcium carbonate (CaCO3, MW = 100), then the 470 mg of dried skimmate contains 205 mg (44 %) of CaCO3. Since carbon is 12 % (by weight) of CaCO3, then the 470 mg of dried skimmate contains ~ 25 mg (~5.2 %) of (inorganic) carbon contributed from the calcium carbonate.
2) Magnesium analysis
1.35 % by weight Mg implies that the total amount of Mg in the 470 mg sample is 6.3 mg. Assuming that all of this Mg is in the form of magnesium carbonate (MgCO3, MW = 84), then the 470 mg of dried skimmate contains 22 mg (~ 4.7 %) of MgCO3. Since carbon is 14 % (by weight) of MgCO3, then the 470 mg of dried skimmate contains ~ 3 mg (~0.7 %) of (inorganic) carbon contributed from the magnesium carbonate.
3) Nitrogen analysis
Living organisms are ~ 5 – 9 % by dry weight nitrogen (we’ll use 7% for simplicity), (Sterner, 2002) and so, if we neglect inorganic sources of nitrogen (NH4, NO3, and NO2, which are immeasurably low in the tank water), the 2.22 % by weight of nitrogen implies that there are 10.4 mgs of nitrogen in the 470 mgs of skimmate, which calculates to 149 mgs (~32 %) of organic material present.
4) Hydrogen analysis
Living organisms are ~ 7 % by dry weight hydrogen. (Sterner, 2002) The 2.39 % by weight of hydrogen implies that there are 11.2 mgs of hydrogen in the 470 mgs of skimmate, which calculates to 160 mgs (~34%) of organic material present. Compare this value to the nitrogen analysis-based prediction of organics from (3); 32% – very close agreement!
5) Carbon analysis
21.08 % by weight C implies that the total amount of C present in the 470 mg skimmate sample is 99 mgs. Subtracting the amount of C from the CaCO3 contribution (25 mgs of C) and the MgCO3 contribution (3 mgs of C) leaves 71 mgs of C remaining. What is the source of this carbon? Two possibilities seem likely; ejected particulate carbon from the GAC filter, or TOC originating from organic sources. Living organisms are 40 – 50% by dry weight carbon (we’ll use 45% for simplicity), (Sterner, 2002). If all of the 71 mg of carbon came from organic sources (= TOC), then there would be ~ 158 mgs (~34 %) of organic material present. Compare this value to both the nitrogen analysis-based prediction of organics from (3); 149 mgs (~ 32%), and the hydrogen analysis-based prediction from (4); 160 mgs of TOC (34%). The concordance between the TOC-carbon-based calculation and the independent hydrogen- and nitrogen-based calculations cannot be ignored. Thus, there
is no evidence to contraindicate the conclusion that the remaining 71 mgs of carbon can be attributed to organic sources as TOC; there is no reason to invoke GAC filter ejecta as a source for this carbon.
6) Silicon analysis
The 4.76% by weight silicon present in the 470 mgs of skimmate suggests that there are 22.4 mgs in total of Si present. If we assume that the Si is contributed by biogenic opal from the skeleta of diatoms, (Brzezinski, 1985; Mortlock, 1989) then the Si is in a hydrated polymer of SiO2 (approx. molecular formula for opal is SiO2•0.4H2O, 42% Si by mass). Therefore, we can approximate the amount of biogenic opal present as 53 mgs (~ 11%).
7) Phosphorus analysis
The 0.16% by weight of P present in the 470 mgs of dry skimmate implies that there is 0.75 mgs of P present. Assuming that all of the P is present as phosphate, PO43- (MW = 95, unknown counterion), then there are ~ 2.3 mgs (~ 0.5%) of PO43- present in the 470 mgs of dry skimmate. This amount equals ~ 4900 ppm of phosphate, which is vastly more than the < 0.02 ppm of phosphate in the tank water. Thus, skimming does concentrate phosphate.
Elemental Analysis Summary
In summary, the skimmer is pulling out a solid, water-insoluble mixture of compounds that consist by weight of (approximately):
- 44 % of CaCO3
- 5% of MgCO3
- 11% of biogenic opal
- 34% of organic material
- 0.5% of phosphate
Therefore, a total ~ 95% of the dry water-insoluble skimmate is accounted for! What are the sources of these chemical compounds in the skimmate? The biogenic opal is likely from the shells of diatoms, small members of the phytoplankton family of marine microbes. The CaCO3 (and MgCO3) might have both biogenic and abiological sources. A calcium reactor was operating throughout the experimental skimmate collection period, and so some of the CaCO3 might just be microparticulates emitted from this device. Alternatively, the CaCO3 might arise from the shells of planktonic microbes from the coccolithophore (Mitchell-Innes, 1987; Stanley, 2005) and foraminifera families. These plankton components are prevalent under certain conditions in seawater, but there presence in aquarium water has not been established. It is not possible to distinguish between these biological and abiological sources of CaCO3 at present. Future experiments in
which skimmate is collected without a running calcium reactor might shed some light on this point. The phosphate present in the skimmate could not come from inorganic phosphate in the water column; that ion would have been removed by the thorough washing with water. It is possible that some of this phosphate is in the form of insoluble calcium phosphate, but that occurrence would be unlikely as Ca3(PO4)2 is formed at rather high pH, which is not characteristic of the skimmate liquid (pH = 7.67, see below). By default, then, it is most likely derived from organic phosphate; that is, many biochemicals within diatoms and all other living organisms (coccolithophores, foraminifera, bacteria, humans, etc) have attached phosphate groups. Aquarium organisms recruit these phosphate molecules from the inorganic phosphate in the water column and then attach them to the organic biochemicals. Thus, they effectively concentrate phosphate from the water, and that
phosphate is then removed (within the intact organism) upon skimming. From this perspective, skimming does contribute to the removal of inorganic phosphate from aquarium water.
An interesting and perhaps unanticipated observation is that only 34% of this solid skimmate material can be assigned to “organic carbon”, TOC. Thus, 2/3 of the solid, water-insoluble part of the skimmate is not TOC, but rather inorganic material that may (or may not) have biogenic origins. If a substantial amount of this inorganic material does come from the shells of plankton, then it stands to reason that a large part of the detected organic material (TOC) probably constitutes the “guts” of these organisms. Thus, perhaps not that much of the TOC removed by skimming is actually free-floating organic molecules. One caveat on this interpretation, of course, is the fact that ~ 90% of the crude original skimmate was washed away with water. Perhaps that water-soluble fraction contained significant quantities of dissolved organic carbon, which would be undetected by the above analysis.
A second, more comprehensive skimmate chemical analysis was pursued to address this concern. In this experiment, the tank was fed daily with a mixture of PE and Hikari mysis shrimp, Ocean Nutrition Formula 1 flakes, Omega One Veggie Flakes, and Aqueon Marine Granules as described above. This daily feeding amounted to a dry weight (110 oC/0.2 mm for 48 hrs) of 0.87 gms/day. No Reef Nutrition products were used during this experiment. After 7 days of this feeding regime, the solid and liquid skimmate collected by the H&S 200-1260 skimmer was carefully removed from the skimmer cup and separated by centrifugation (6000 rpm, 40 min). The light brown clear supernatant was poured off and its volume measured; 125 mL. The solid residue was dried in vacuo at 110 oC/0.2 mm for 24 hours => 5.18 gm brown solid. 110 mL of the liquid was concentrated under reduced pressure and then vacuum dried (110 oC/0.2 mm/24 hr) to yield 2.91 gm of brown solid ( =>
3.31 gms of solid from the original 125 mL of liquid recovered). The 15 mL of remaining liquid skimmate was assayed with a Salifert test kit for alkalinity: [alk] = 8.0 meq/L. In addition, the refractive index of 1.023 indicated 31 ppt salinity, and pH = 7.67. An endpoint could not be detected with the Ca or Mg Salifert kits, the Merck phosphate kit, or the Salifert NO3 kit due to the interfering light brown color of the skimmate liquid. Note that the exceedingly high [alk] measurement does not necessarily suggest that the concentrations of HCO3– or CO32- are high; there may be organic acid carboxylates from the TOC pool that are being detected by this alkalinity assay (see below).
The solid derived from evaporation of the liquid portion of the skimmate as well as the solid obtained after centrifugation were both submitted to Columbia Analytical Services for elemental analysis. The results are tabulated in Table1. In addition, the dried food was analyzed for select elements. Natural seawater element content is included for comparison.
| Element | Solid skimmate (weight %) | Liquid skimmate(weight %) | Natural sea watersolids (weight %) | Food(weight %) |
|---|---|---|---|---|
| C | 22.50 | 4.50 | 0.08 | |
| N | 2.72 | 0.68 | 0.04 | |
| H | 2.37 | 1.33 | ||
| S | 1.18 | 2.47 | 2.6 | |
| Ca | 10.52 | 0.60 | 1.1 | |
| Mg | 1.99 | 3.21 | 3.7 | |
| Si | 8.94 | 1.40 | < 0.01 | |
| Na | 3.45 | 27.25 | 30.9 | |
| Cl | 0.40 | 43.2 | 55.4 | |
| K | 0.38 | 1.17 | 1.1 | |
| Fe | 0.93 | <0.02 | < 0.01 | |
| P | 0.46 | 0.08 | < 0.01 | 1.57 |
| I | < 0.01 | < 0.1 | ||
| Cu | < 0.01 | < 0.006 | ||
| Sum | 55.84 | 85.89 | 95 |
Food Analysis
The desiccated food was assayed for phosphorus, copper, and iodine content. Neither copper nor iodine registered in these analyses; there can be no more than 100 ppb of either in the food. The phosphorus content, however, was detectable, and 1.57% by weight of P corresponds to approximately 14 mg pf phosphorus in the 0.87 gm of dried food fed to the tank daily. Assuming that all of the P is present as phosphate, PO43- (MW = 95), then there are ~ 42 mgs (~ 5%) of PO43- present in the 0.87 gm of dried food. Note that the frozen mysis shrimp cubes were washed thoroughly with tap water until thawed, and so phosphate content in the water for freezing can be discounted. The daily 42 mg phosphate addition to the 168 gallons of the aquarium water volume represents a nominal addition of approximately 0.06 ppm of phosphate per day. Since Merck phosphate test kit analysis indicates a phosphate level of < 0.02 ppm (test kit limit), the added phosphate appears to be readily removed from the water column.
Skimmate Liquid Analysis
1) Sulfur analysis
The 2.47% by weight sulfur present in the 3.31 gm of solid derived from the skimmate liquid equates to approximately 82 mg of S. This sulfur most likely comes from sulfate, SO42- (MW = 96, 33% S by weight). There is certainly a small amount of “organic” sulfur in the DOC, but that is not likely to add much to the total sulfur %, since sulfur is only ~ 0.1% of the dry weight of living matter. (Sterner, 2002) So, 82 mg of S in the dried liquid skimmate corresponds to 248 mg (7.5%) of sulfate in the dried skimmate liquid.
2) Nitrogen analysis
The 0.68% by dry weight of nitrogen in the 3.31 gm of dried skimmate liquid corresponds to 23 mg of N. Sources of the nitrogen include organic matter (DOC), and of course, inorganic ions; ammonium (NH4+), nitrite (NO2–), and nitrate (NO3–). There is essentially no measurable (i.e., < 1 ppm) NH4, NO2 or NO3 in the aquarium water, so to a first approximation, the nitrogen in the skimmate can be attributed to “organic” nitrogen. Since organic material derived from living sources is approximately 7% by dry weight nitrogen (see above), the 23 mg of N present in the skimmate liquid suggests that, overall, there is approximately 329 mg (~ 10%) of organic material present.
3) Carbon analysis
The 4.50 % by weight of carbon present in the 3.31 gm of dried skimmate liquid corresponds to 149 mg of C present. Sources of carbon in the skimmate liquid include inorganic carbon as part of the carbonate equilibria, organic carbon (DOC), and carbon particles ejected from the GAC filter. Based upon the argument advanced in (5) above, it seems unlikely that the GAC filter is a source of this carbon. It is not possible to distinguish between the remaining two sources based upon the elemental analysis measurement or the independent [alk] measurement, since that latter assay will detect (organic) carboxylates as well as the inorganic forms, bicarbonate HCO3–, and carbonate CO32-. However, it is possible to set an upper limit on the inorganic (bicarbonate and carbonate) content of the skimmate liquid from the Salifert alkalinity measurement. The measured alkalinity via a Salifert test kit was 8 meq/L. If we assume for the purposes of setting this upper limit that all of that alkalinity was due to the carbonate system, then 8.0 meq/L corresponds to 1.0 mmol of alkalinity in the 125 mL of skimmate liquid collected from the centrifugation run. Further, if we assume that all of that alkalinity is in the form of bicarbonate, HCO3– (actually, at pH = 7.67, [HCO3] is about 96% of the carbonate present), then we would have 1.0 mmol, or 61 mg, of HCO3– present in the 3.31 gm of dried skimmate liquid. Thus, at a maximum, 61 mgs of HCO3– (= 20% C by weight) would only account for 12 mgs of the total 149 mgs of carbon present in the dried skimmate liquid. In this scenario, 137 mgs of the measured carbon then would be derived from organic sources. Using the estimate that organic material derived from living sources is 45% carbon, then the amount of DOC in the dried skimmate liquid would be 304 mg (~ 9%); not too far off from the nitrogen analysis figure of ~ 10% organic material. If, at the other extreme, all of the measured alkalinity could be attributed to organic carboxylates (assume C18 species on average, so C = 76% of carboxylate mass), then the 1.0 mmol of alkalinity would correspond to 283 mgs of organic carboxylates, 76% of which (= 215 mg) would be carbon. Since the total carbon measured was only 149 mgs, this latter scenario is of course impossible. Most likely, ~ 3 or 4 meq/L of the alkalinity can be assigned to HCO3–, so the remaining organic carbon is around 143 mgs => 318 mgs (~ 10%) of organic material – the same value derived from the nitrogen calculation.
4) Hydrogen analysis
The 1.33% by weight hydrogen in the 3.31 gm sample of dried skimmate liquid implies that there are 44 mg of H present. This hydrogen can be contributed from biologically derived organic sources, inorganic sources (HCO3– and HSO4–), and possibly from water left over from incomplete drying. If all of the measured hydrogen were contributed only from biologically derived organic sources (at ~ 7% by dry weight hydrogen), then we would predict that the dried skimmate liquid contained approximately 629 mg (~ 19%) of organic material. Clearly that value is too large compared to the nitrogen and carbon analyses values, so at least some of the hydrogen must come from either inorganic ions or from water. The amounts contributed from bicarbonate HCO3– and carbonic acid H2CO3 are negligible, given their relatively small concentrations (see Carbon analysis, above). In addition, at pH = 7.67, there is a vanishingly small amount of bisulfate, HSO4–; its pKa = 1.9. So, it is likely that the liquid skimmate sample was not completely dried, and the remaining hydrogen likely comes from that source. Given from the nitrogen analysis that the solid derived from the skimmate liquid contains about 329 mg of organic material, and organic material is about 7% hydrogen, then the hydrogen contributed from this organic material is about 23 mg of the solid residue. If the remaining measured hydrogen (44 – 23 = 21 mg) is from H2O, then there is 189 mg (~ 6 %) of water present.
5) Silicon analysis
The 1.40% of silicon by weight in the 3.31 gm of solid recovered from the skimmate liquid works out to 46 mg of silicon. This silicon may be derived from either water-soluble orthosilicic acid (Si(OH)4, 29% Si, 4% H) or from biogenic opal constituting the shell of diatoms as described above (approx. molecular formula for opal is SiO2•0.4H2O, 42% Si, 1% H). Note that in either case, the amount of hydrogen contributed by either source of Si is minuscule (~ 0.04% by weight of the original skimmate liquid’s derived solid) and scarcely influences the hydrogen analysis’s conclusions above. It is not possible to determine how much silicon derives from inorganic orthosilicic acid, and how much can be attributed the shells of diatoms, but the % silicon in each is not that different, and so we will use an average value (36%) to calculate the amount of “SiOxHy” in the crude skimmate liquid’s derived solid; approximately 128 mg (~4%) of the skimmate liquid’s
solid is some form of silicate, SiOxHy.
So, overall, the solid derived from concentration of the skimmate liquid can be partitioned into:
- Inorganic ions (Na, Cl, K, Ca, Mg, SO42-, HCO3–, SiOxHy) 87%
- Dissolved organic carbon 10%
- Water 6%
- Total 103%
So, we have overshot the theoretical maximum content of 100% by 3%; not too bad, given the many approximations and assumptions that went into the acquisition of these percentages. The bottom line, however, is that the skimmate liquid contains mostly the common inorganic ions that constitute the major ions in seawater. Only a small amount of this material can be arguably assigned to dissolved organic carbon, DOC.
The chemical analysis of the 5.18 gm of skimmate solid follows a similar approach as that described for the heavily washed skimmate solid discussed above. However, in this case, the solid was not washed repeatedly, and so some water-soluble compounds persist, although most of the water was likely removed through vacuum drying. These water soluble species consist of 3.45 wt % sodium, 0.40 wt % chloride, 0.38 wt % potassium, and 1.18 wt % sulfur (= 3.6 wt % sulfate). Furthermore, it is likely that at least some of the measured Ca, Mg, C (as HCO3) and P might come from water soluble compounds in addition to compounds within the insoluble solid, but the overall amounts of the water soluble fraction of these particular inorganic ions are likely to be small, since the most abundant ion, sodium, is only 3.45 % by weight of the isolated solid (Na/Ca = 28 in seawater). So, to a first approximation, we will neglect their contribution to the water-soluble inorganic part of the solid skimmate. From this perspective, the dried skimmate solid contains about 8 % by weight of normally water-soluble inorganic ions.
1) Calcium analysis
10.52 % by weight Ca implies that the total amount of Ca in the 5.18 mg sample is 545 mg. Assuming that essentially all of this Ca is in the form of water-insoluble calcium carbonate (CaCO3, MW = 100), then the 5.18 mg of dried skimmate contains 1.36 gm (26 %) of CaCO3. Since carbon is 12 % (by weight) of CaCO3, then the 5.18 gm of dried skimmate contains ~ 163 mg (~3.2 %) of (inorganic) carbon contributed from the calcium carbonate.
2) Magnesium analysis
1.99 % by weight Mg implies that the total amount of Mg in the 5.18 gm sample is 103 mg. Assuming that all of this Mg is in the form of magnesium carbonate (MgCO3, MW = 84), then the 5.18 gm of dried skimmate contains 361 mg (~ 7.0 %) of MgCO3. Since carbon is 14 % (by weight) of MgCO3, then the 5.18 gm of dried skimmate contains ~ 51 mg (~ 1 %) of (inorganic) carbon contributed from the magnesium carbonate.
3) Nitrogen analysis
Living organisms are ~ 5 – 9 % by dry weight nitrogen (we’ll use 7% for simplicity), (Sterner, 2002) and so, if we neglect inorganic sources of nitrogen (NH4, NO3, and NO2, which are immeasurably low in the tank water), the 2.72 % by weight of nitrogen implies that there are 141 mgs of nitrogen in the 5.18 gm of skimmate solid, which calculates to 2.01 gms (~39 %) of organic material present.
4) Hydrogen analysis
Living organisms are ~ 7 % by dry weight hydrogen. (Sterner, 2002) The 2.37 % by weight of hydrogen implies that there are 123 mgs of hydrogen in the 5.18 gm of skimmate solid, which calculates to 1.75 gms (~34%) of organic material present. Compare this value to the nitrogen analysis-based prediction of organics from (3); 39% organic carbon. In this instance, the hydrogen results are not as close to the nitrogen-based results as they were in the preceding two analyses, but they are not that far off. This hydrogen analysis assumes that there is no water present, or some of the H would be attributable to water and not organics, and the H-based organic calculation would be even smaller.
5) Carbon analysis
22.50 % by weight C implies that the total amount of C present in the 5.18 gm skimmate sample is 1.17 gm. Subtracting the amount of C from the CaCO3 contribution (163 mgs of C), and the MgCO3 contribution (51 mgs of C) leaves 952 mgs of C remaining. If we again discount the GAC filter as a source of this carbon, then most (all?) of this carbon comes from “organic” sources. Since living organisms are 40 – 50% by dry weight carbon (we’ll use 45% for simplicity), (Sterner, 2002) then 952 mgs of organic C implies that there are ~ 2.12 gms (~ 41 %) of organic material present. Comparison to the nitrogen- (39% organics) and hydrogen- (34% organics) derived values provides a consistent picture of the organic content.
6) Silicon analysis
The 8.94 % by weight silicon present in the 5.18 gm of skimmate solid suggests that there are 463 mgs in total of Si present. If we assume that the Si is contributed by biogenic opal from the skeleta of diatoms, (Brzezinski, 1985; Mortlock, 1989) then the Si is in a hydrated polymer of SiO2 (approx. molecular formula for opal is SiO2•0.4H2O, 42% Si by mass). Therefore, we can approximate the amount of biogenic opal present as 1.10 gm (~ 21%).
7) Phosphorus analysis
The 0.46% by weight of P present in the 5.18 gms of dry skimmate solid implies that there is 24 mgs of P present. Assuming all of the P is present as phosphate, PO43- (MW = 95, unknown counterion), then there are ~ 74 mgs (~ 1.4 %) of PO43- present in the 5.18 gm of dry skimmate solid. This amount equals ~ 14300 ppm of phosphate, which again is vastly more than the < 0.02 ppm of phosphate in the tank water.
8) Iron analysis
The 0.93 % by weight of Fe in the 5.18 gms of dried skimmate solid amounts to 48 mg of Fe present. Inorganic iron salts are quite insoluble in water, and so it is likely that almost all of this iron is either “organic” iron that resided within the bodies of microbes like bacteria, etc. or it is from colloidal iron particles expelled from the GFO reactor. The skimmate’s carbon-to-iron weight-percent-ratio of 24 can be compared to the dry weight C:Fe ratios of several planktonic organisms: heterotrophic bacteria: 28500:1, cyanobacteria: 11250:1, eukaryotic phytoplankton: 71250:1. (Tortell, 1996). Since the detected Fe:C ratio is 10000x that of planktonic species, it is highly unlikely that much of the skimmed iron is “organic” in origin. A more likely scenario is that particulate ferric oxide is expelled from the GFO reactor, and that material then constitutes the majority of the iron removed by the skimmer. Ferric oxide has a nominal chemical formula of Fe2O3,
and it is approximately 70% iron by weight. So, the 48 mg of iron in the skimmate solid corresponds to about 69 mg of Fe2O3 (~ 1.3% by weight).
In summary, the skimmer is pulling out a solid mixture of compounds that consist by weight of (approximately):
- 8% inorganic ions
- 26 % of CaCO3
- 7% of MgCO3
- 21% of biogenic opal (SiO2)
- 38% of organic material
- 1.5% of phosphate
- 1.3 % of ferric oxide
These materials sum up to ~ 103%, which is pretty close to the theoretical maximum of 100%. Any discrepancies can be easily explained by the numerical uncertainty introduced through all of the assumptions. That is, even with all of the assumptions and approximations cited in this analysis, the sum total of the mass works out to within 3% of “perfect”. Once again, the organic material removed in the skimmate solid is a minor component, although at an average of 38% (C vs. N vs. H analysis), it is a little higher than the 34% value derived from the heavily washed skimmate solid sample and much higher that the amount of DOC in the liquid fraction (~ 10%). In total, the 8.49 gm of total solids removed during the week of skimming contain approximately 318 mg of water-soluble organics (~ 4%) and approximately 2.12 gms of water-insoluble organics (~ 25%). Thus, by a large margin, the bulk of the organics removed by skimming are not DOC (dissolved organic carbon). The inorganic compounds CaCO3 and SiO2 constitute the majority of the skimmate solid mass, much as they did in the heavily washed skimmate sample analyzed first. As discussed in that analysis, the source of these compounds is not assignable from these data, but a biological source for the SiO2 (biogenic opal), diatom shells, is likely. The CaCO3 might arise from both inorganic sources (i.e., calcium reactor CaCO3 particle ejection) and organic sources (the shells of foraminifera and/or coccolithophores).
One of the surprising observations to emerge from the original skimmer performance studies is that only approximately 20 – 35% of the measurable TOC in aquarium water is removed by skimming. That observation might now seem a little less surprising when viewed in the context of the skimmate component analysis. Thus, only ~ 29 % (25% from the solid + 4% from the liquid) of the skimmate removed by the H&S 200 skimmer from authentic reef tank water over the course of a week can be assigned to organic material. So, skimming does not remove all that much of the TOC present in aquarium water, and the skimmate does not contain all that much TOC.
So what, exactly, does skimming do? On the subject of water remediation; the most conservative, permissible (but not compelling!) answer is that skimming removes lots of (living or dead? unknown) microorganisms that populate the aquarium water, and in so doing removes the (organic) carbon, phosphorus, and nitrogen that comprise their biochemical makeup. In addition, dissolved organic compounds may also be removed, but the data do not support the proposition that these dissolved organic species constitute a major amount of the total organics removed. In addition to these water purification functions, skimmers serve to oxygenate the water and facilitate gas exchange in general, which are useful activities independent of organic waste removal.
Conclusions
The chemical/elemental composition of skimmate generated by an H&S 200-1260 skimmer on a 175-gallon reef tank over the course of several days or a week had some surprises. Only a minor amount of the skimmate (solid + liquid) could be attributed to organic carbon (TOC); about 29%, and most of that material was not water soluble, i.e., was not dissolved organic carbon. The majority of the recovered skimmate solid, apart from the commons ions of seawater, was CaCO3, MgCO3, and SiO2 – inorganic compounds! The origin of these species is not known with certainity, but a good case can be made that the SiO2 stems from the shells of diatoms. The CaCO3 might be derived from other planktonic microbes bearing calcium carbonate shells, or might come from calcium reactor effluent. To the extent that the solid skimmate consists of microflora, then some proportion of the insoluble organic material removed by skimming would then simply be the organic components (the “guts”) of these microflora. These microflora do concentrate P, N, and C nutrients from the water column, and so their removal via skimming does constitute a means of nutrient export.
Acknowledgments
We thank the Eberly College of Science at the Pennsylvania State University and E. I DuPont de Nemours and Co. for financial support, and Drs. Sanjay Joshi (Penn State) and Craig Bingman (U. Wisconsin) for many helpful discussions.
References
- Brzezinski, M. A. 1985. “The Si:C:N Ratio of Marine Diatoms: Interspecific Variability and the Effect of Some Environmental Variables.” J. Physiol., 21, 347-357.
- De la Rosa, J. M.; González-Pérez, J. A.; Hatcher, P. G.; Knicker, H.; González-Vila, F. J. 2008. “Determination of Refractory Organic Matter in Marine Sediments by Chemical Oxidation, Analytical Pyrolysis and Solid-State 13C Nuclear Magnetic Resonance Spectroscopy.” Eur. J. Soil Sci., 59, 430-438.
- Feldman, K. S.; Maers, K. M.; Vernese, L. F.; Huber, E. A.; Test, M. R. 2009. “The Development of a Method for the Quantitative Evaluation of Protein Skimmer Performance.” Advanced Aquarist http://www.advancedaquarist.com/2009/1/aafeature2/
- Feldman, K. S.; Maers, K. M. 2010. “Further Studies on Protein Skimmer Performance.” Advanced Aquarist
- Mitchell-Innes, B. A.; Winter, A. 1987. “Coccolithophores: a Major Phytoplankton Component in Mature Upwelling Waters Off the Cape Peninsula, South Africa in March, 1983.” Marine Biol., 95, 25030.
- Mopper, K.; Stubbins, A.; Ritchie, J. D.; Bialk, H. M.; Hatcher, P. G. “Advanced Instrumental Approaches for Characterization of Marine Dissolved Organic Matter: Extraction Techniques, Mass Spectrometry, and Nuclear Magnetic Resonance Spectroscopy.” Chem. Rev., 107, 419-442.
- Mortlock, R. A.; Froelich, P. N. “A Simple Method for the Rapid Determination of Biogenic Opal in Pelagic marine Sediments.” 1989. Deep-Sea Res., 36, 1415-1426.
- Stanley, S. M.; Ries, J. B.; Hardie, L. A. 2005, “Seawater Chemistry, Coccolithophore Population Growth, and the Origin of Cretaceous Chalk.” Geology, 33, 593-596.
- Sterner, R. W.; Elser, J. J. 2002. Ecological Stoichiometry. Princeton University Press, Princeton.
- Tortell, P. D.; Maldonado, M. T.; Price, N. M. “The Role of Heterotrophic Bacteria in Iron-Limited Ocean Ecosystems.” 1996. Nature, 383, 330-332.
0 Comments