

The wavelength of visible light is between 400-700nm. Incidentally, these also happen to be the majority of wavelengths of light that are relevant to photosynthesis. The combined effect of the complete range of radiation between 400-700nm appears as white light to the human eye. Radiation with a wavelength of 400 nm generates a response in the human eye that makes it perceived as violet, while radiation with a wavelength of 700nm appears red. The different colors of the rainbow (ROYGBV – red, orange, yellow, green, blue and violet) are arranged in descending order of their wavelength. Roughly, we can break down the various colors into wavelength bands as follows:
- Violet – 400 to 440nm
- Blue – 440 to 490nm
- Green – 490 to 540nm
- Yellow – 540 to 590nm
- Orange – 600 to 650nm
- Red – 650 to 700nm
Radiation below 400 nm wavelength is called ultraviolet (UV) radiation, and is typically divided into three segments: UV-A (400-315nm), UV-B (315-280nm) and UV-C (280-100nm). UV radiation is not visible to the human eye, but it can have a damaging impact on humans (as well as corals). The UV-A segment, the most common in sunlight, overlaps slightly with the shortest wavelengths in the visible portion of the spectrum. UV-B is effectively the most destructive UV radiation from the sun, because it penetrates the atmosphere and can injure biological tissues. UV-C radiation from the sun would cause even more injury, but it is absorbed by the atmosphere, so it almost never reaches the Earth’s surface.
Infrared (IR) radiation has slightly longer wavelengths than visible light. The IR region of the electromagnetic spectrum is also divided into three segments: IR-A (780-1400 nm), IR-B (1400-3000 nm) and IR-C (3000-10600 nm). Infrared radiation is thermal and is felt as heat.
A typical spectral distribution of a light source is measured using an instrument called a spectroradiometer. A spectroradiometer simply is an instrument that has a sensor and associated hardware and software to determine the distribution of energy (measured as power density in Watts/m2) at different wavelengths of the electromagnetic spectrum. The power density at different wavelengths is also called the spectral irradiance. The data is usually displayed as a graph with the wavelength on the X-axis and the spectral irradiance on the Y-axis, and is called the Spectral Power Distribution (SPD) plot. One such SPD plot is shown in Figure 1 below. This is the most important piece of information about a light source, and all relevant light measures can be mathematically derived from it. A point of note here – since the measurement is in terms of watts/m2, changing the distance of the light source to the sensor will result in a change in the absolute measured values. Hence for comparison purposes, either the measurements must be made at the same distance or the data scaled and normalized.
The spectral distribution of light from the Metal Halide lamps has been characterized extensively in earlier research ( see http://www.manhattanreefs.com/lighting for a catalog of spectral output of various metal halide lamps). However, little is known about the spectral characteristics of the LEDs currently available to the hobby and how they compare to the spectral characteristics of the metal halide and other light sources that have been used successfully in the past to maintain reef aquariums. The spectral characteristics of light impact both the coral and photosynthetic organisms and the visual aesthetics of the aquarium.
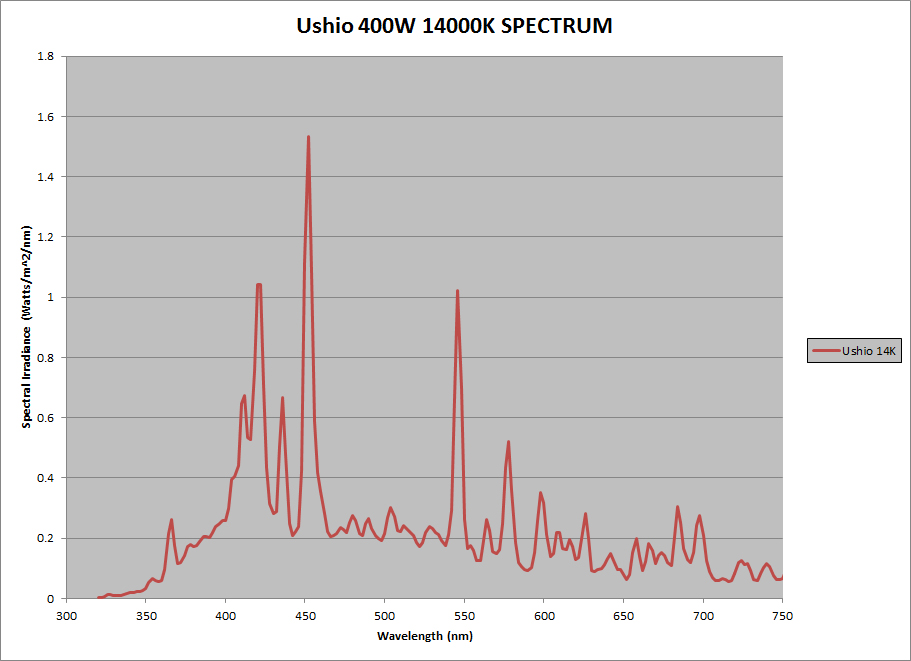
Figure 1: Example of a Spectral Power Distribution plot
Most of the new LED fixtures for reef lighting are configured with a mix of blue and white LEDs, or more recently with 4 or more different colored LEDs. The resulting light is a blend of the light output of the various LED colors. The light intensity and spectrum is typically a simple additive effect of the individual spectral output of the various LEDs.
Methods and Approach
For the purpose of this study, several popular LED fixtures (Table 1) were analyzed for their spectral distribution. The spectral distributions were measured using the Licor LI-1800 spectroradiometer. The spectral data was collected from the various LEDs and normalized such that integrated light output (spectral irradiance) between the wavelengths of 400-700 nm was 100 Watts/m2. Data was collected at full power output for the individual channels of light control (eg. Blue, white) along with data with ALL LEDs on at full power. The data was normalized so that the full output was at 100 Watts/m2 over the wavelength range 400-700 nm. The various LED color outputs were then scaled by the same scale factor to allow of determination of the contribution of the various LEDs to the full output. The results are plotted as a SPD plot. Additionally, the spectrum is compared to two popular metal halide lamps – 400W Radium driven by a HQI ballast and a 400W Ushio 14000K driven by an Icecap Electronic ballast. The Radium 400W is a popular bulb among reef aquarists who prefer a “blue” look to the tank, and the 14000K Ushio is the bulb that I currently use on my tank and is a preferred choice for those who prefer a whiter look to the tank. Based on vast amounts of reported success with these lamps, these 2 were chosen as a reference to compare the light spectrum of the various LED fixtures.
| Fixtures |
|---|
| radion X30 |
| Orphek PR-156 |
| Ecoray 112 |
| Mvava-2 |
| Aquaillumination SOL White |
| Aquaillumination SOL Blue |
| Aquaillumination SOL Warm White |
Radion XR30W
The Ecotech radion is one of the few LEDs that offers multiple color LEDs, with 2 types of LED blue, white, green and red leds. A total of 8 Cree XP-G Cool White LEDs run at 5W each, 8 Cree XP-E Blue LEDs run at 3W each, 10 Cree XP-E Royal Blue LEDs run at 3W each, 4 Cree XP-E Green LEDs run at 3W each and 4 Osram Oslon SSL Hyper Red LEDs run at 3W each. There are 4 separate channels of control that allow user to customize the light output by adjusting the output of the various channels independently via software program.
The contribution of each of the individual LEDs at full power to the overall resultant spectrum is seen in the figure 2a below. As seen from the figure the final resultant spectrum in a sum of the output of the different spectrums. This is one of the few LEDs with green and red LEDs, in an effort to provide a wider coverage of the light spectrum. The addition of the red leds help improve the color rendition especially for the red/pink corals as well as fish. Also, Chlorophyll in corals has an absorption band in the red region, hence it is speculated that the addition of red will enhance photosynthesis. Figure 2b shows how this compares to the Metal Halide lamps. It is interesting to note that the amount of Red spectrum is quite comparable to that of Radium.
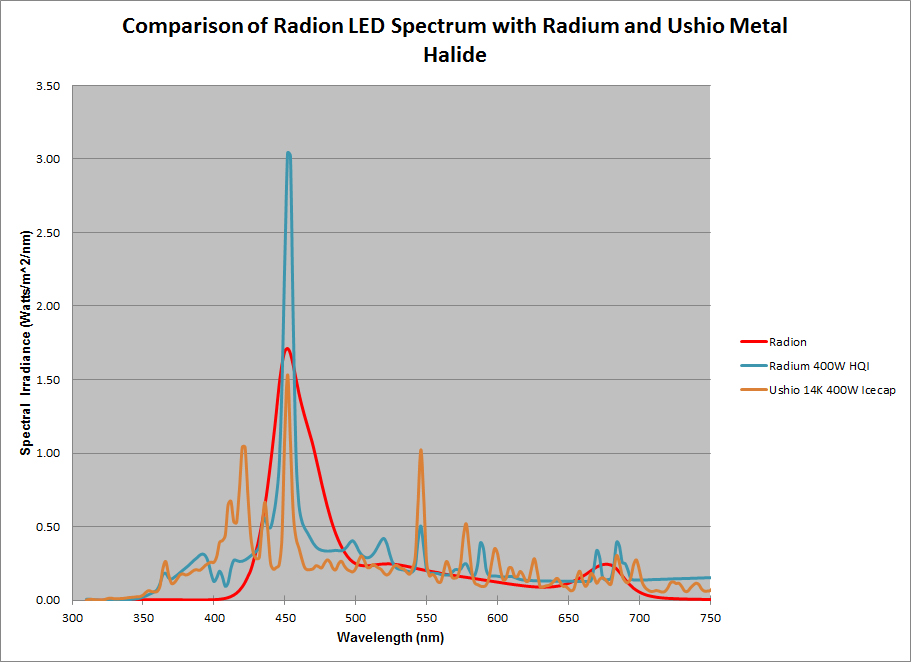
Figure 2a. Spectral Output of the different LED components – Radion XR30W
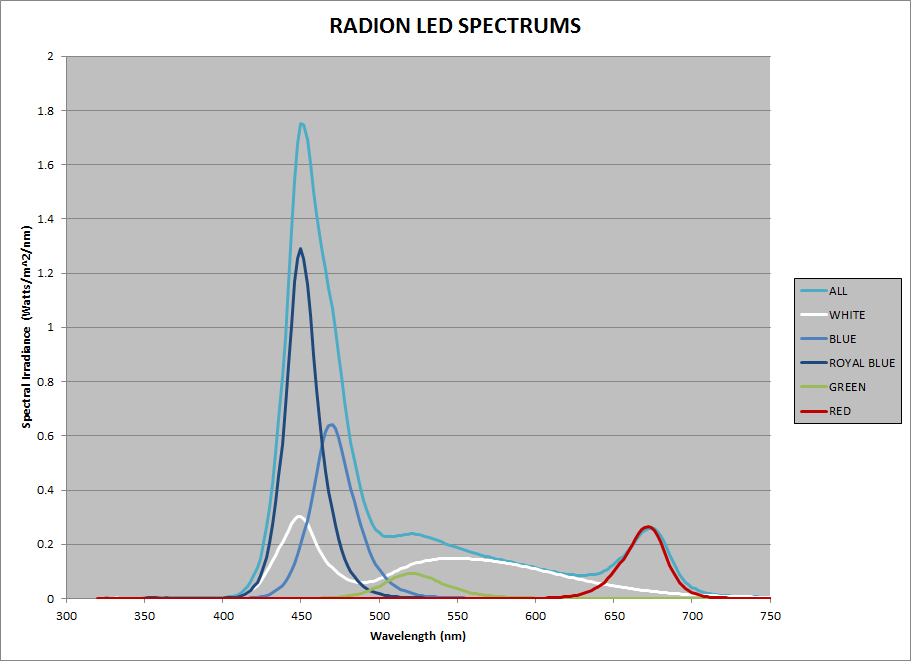
Figure 2b. Spectral Output of the Radion XR30W compared to Metal Halide
Orphek PR-156
The Orphek array PR-156 is one of the newer models that includes 4 UV LEDs, in addition to the blue and white LEDs. A total of 60 LEDs running at around 2W each make up the complete array. The UV LEDs cannot be individually controlled, hence their output is combined with the main output with all LEDs turned ON. As seen in the figure 3a, the UV LEDs show in the spectral plot between 350 and 400 nm. The amount of UV is still less than what is output by the metal halide lamps as seen in Figure 3b. The Orphek PR 156 allows the moon lights to be controlled separately.
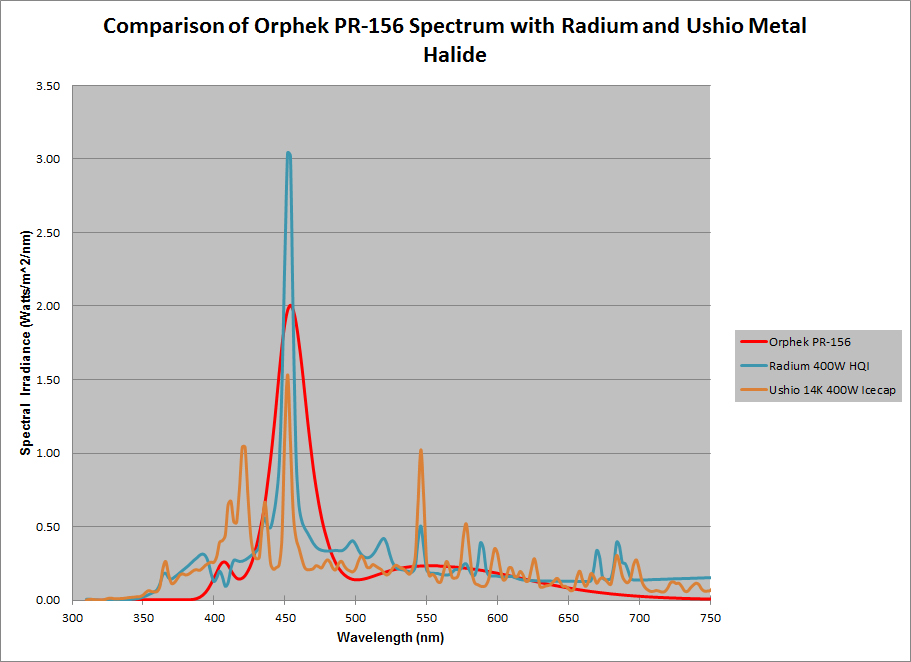
Figure 3a. Spectral Output of the different LED components – Orphek PR-156
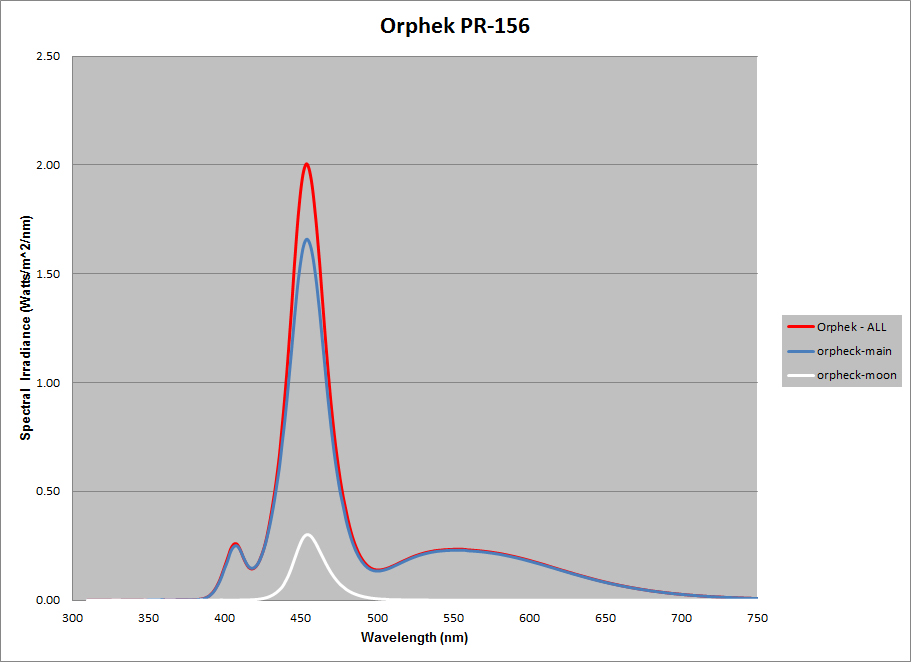
Figure 3b. Spectral Output of the Orphek PR156 as compared to Metal Halide
Ecoray 112
Similar to the Ecoray 60 in design, this is the larger version with 112 LEDs – 56 White High Power 1 Watt LED, (color temperature 12000K – 160000K) and 56 Blue Actinic High Power 1 Watt LED (Wave Length 450-460 nm) arranged in a 8X14 grid. The white and blue LEDs can be controlled separately, only in 2 states ON or OFF. The spectral output for the different channels and all LEDs ON is shown in figure 4a along with the comparison to metal halide in figure 4b.
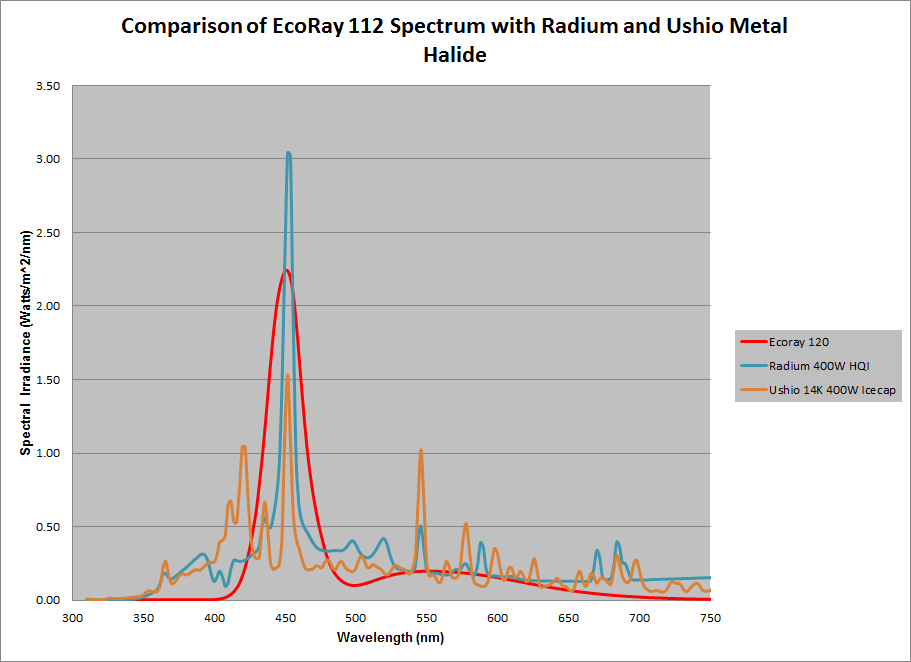
Figure 4a. Spectral Output of the different LED components – Ecoray 112
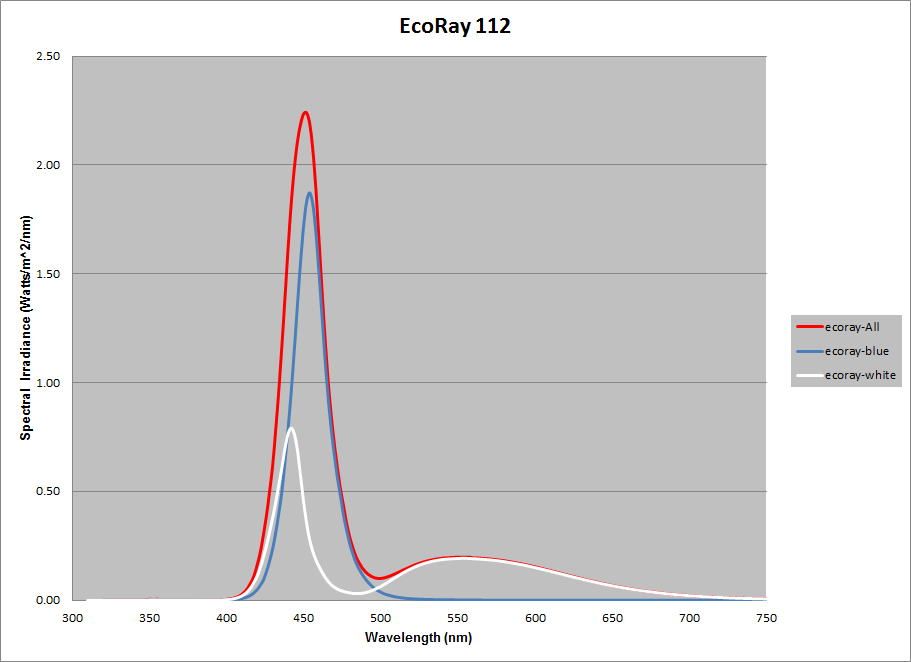
Figure 4b. Spectral Output of the EcoRay 112 compared to Metal Halide
MVAVA-II
MVAVA II LED array (http://www.mvava.com/index.html) comprised 56 1W Blue LED and 8 10W multichip White LEDs, in a ON/OFF control configuration. Figure 5a shows the output of the individual channels and figure 5b shows how it compares to metal halide lamps.
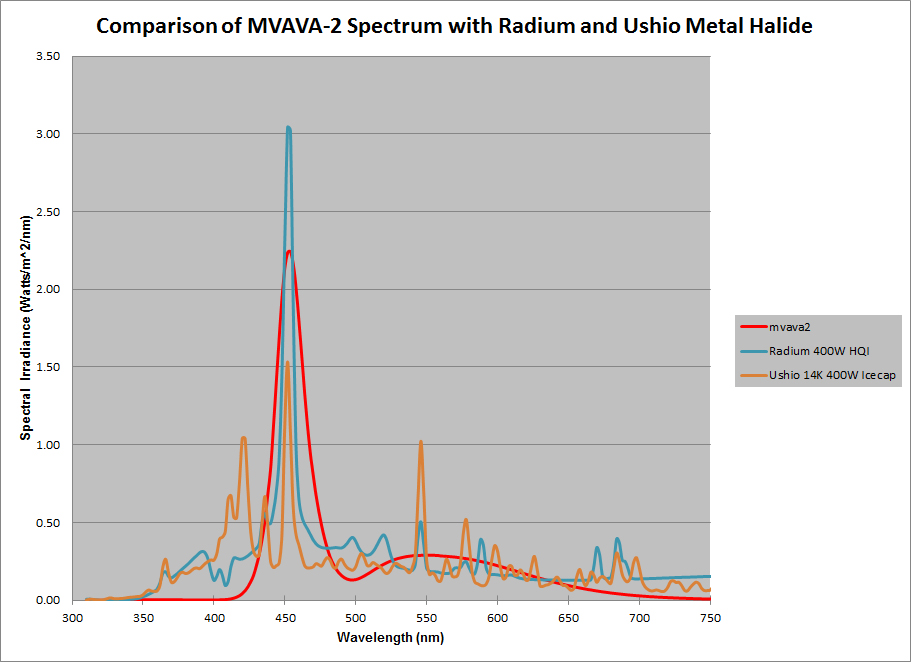
Figure 5a. Spectral Output of the different LED components – Mvava II
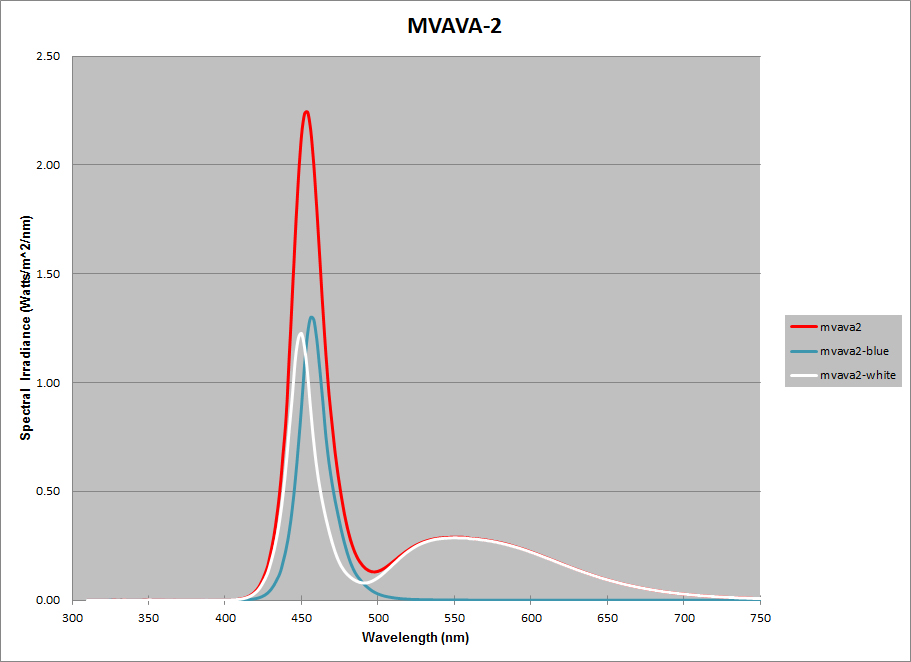
Figure 5b. Spectral Output of the MVAVA II compared to Metal Halide
Aquaillumination – SOL White
Aqua Illumination SOL White comprised 24 LEDs in the ratio of 2 Whites: 1 Blue. 16 CREE XPG White and 8 CREE XPE Blue, with custom designed light collimators were used in each module. A single 12″ module was tested. These LEDs come standard with a controller that allows infinite control of the blue and white channels. Figure 6a shows the spectral output of the individual channels at full output and figure 6b shows the comparison to metal halides.
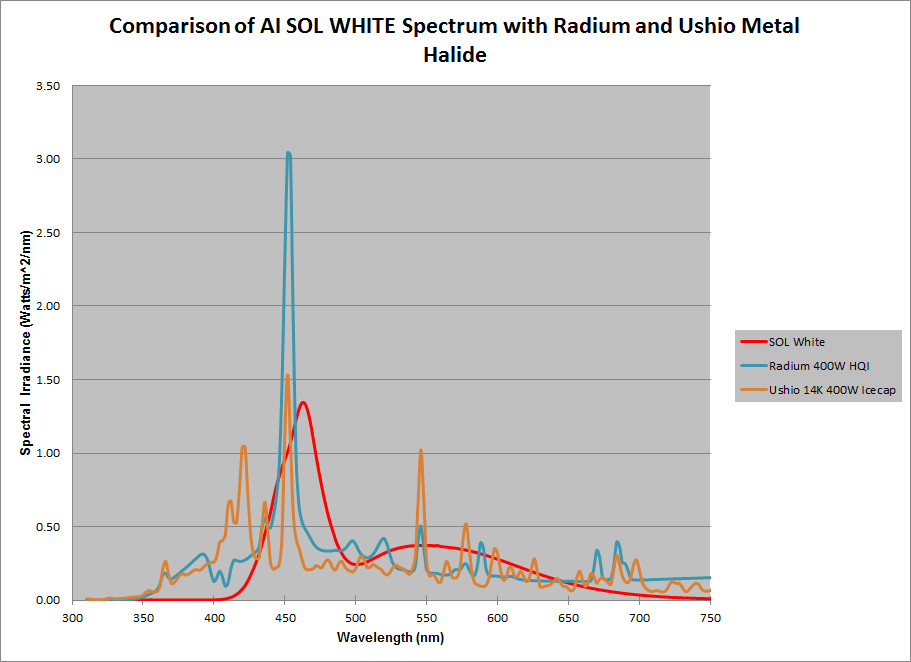
Figure 6a. Spectral Output of the different LED components – AI Sol White
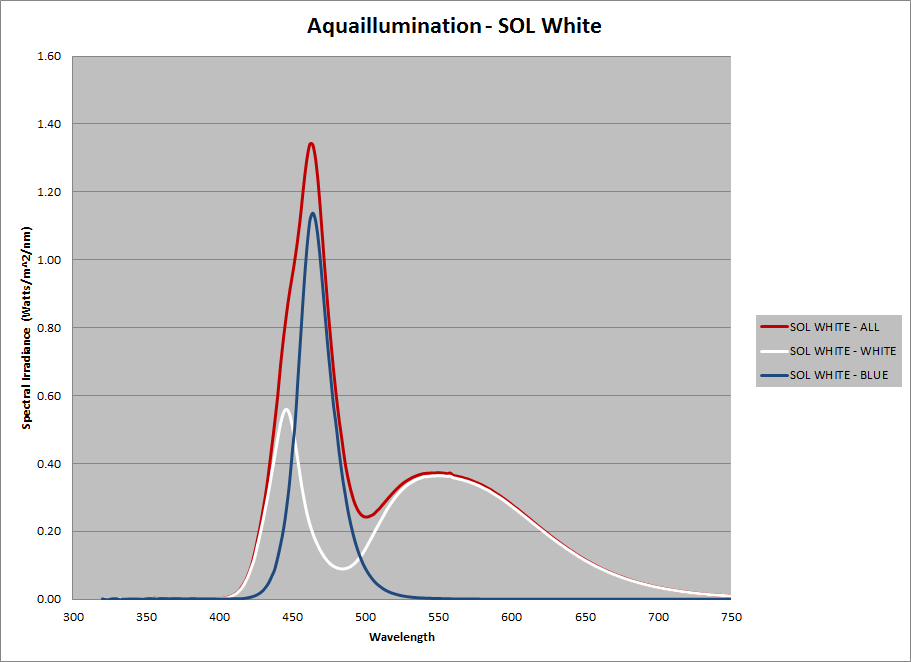
Figure 6b. Spectral Output of the AI Sol White as compared to Metal Halide
Aquaillumination – SOL BLUE
The SOL Blue is similar in construction to the SOL White, with the primary difference being the ratio of blue to white LEDs. 8 Blue and 8 Royal Blue LEDs comprise the blue channel and 8 white LEDs comprise the white channel each of which can be controlled separately. (Note that these were tested before updating the controller and hence the blue and royal blue could not be controlled separately). Figure 7a shows the output of the different channels blue and white, and figure 7b shows the comparison with metal halide lamps.
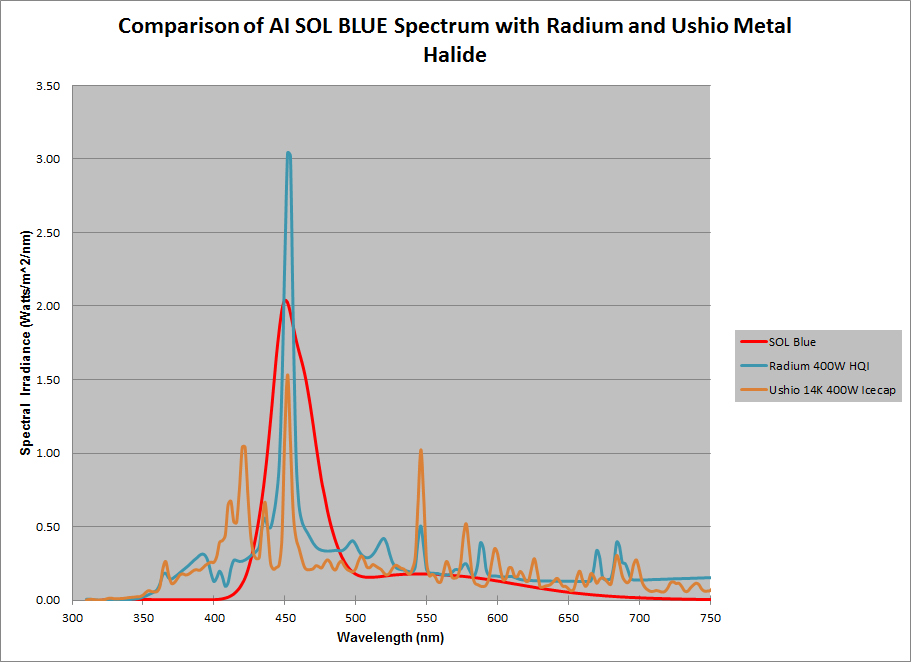
Figure 7a. Spectral Output of the different LED components – AI Sol Blue
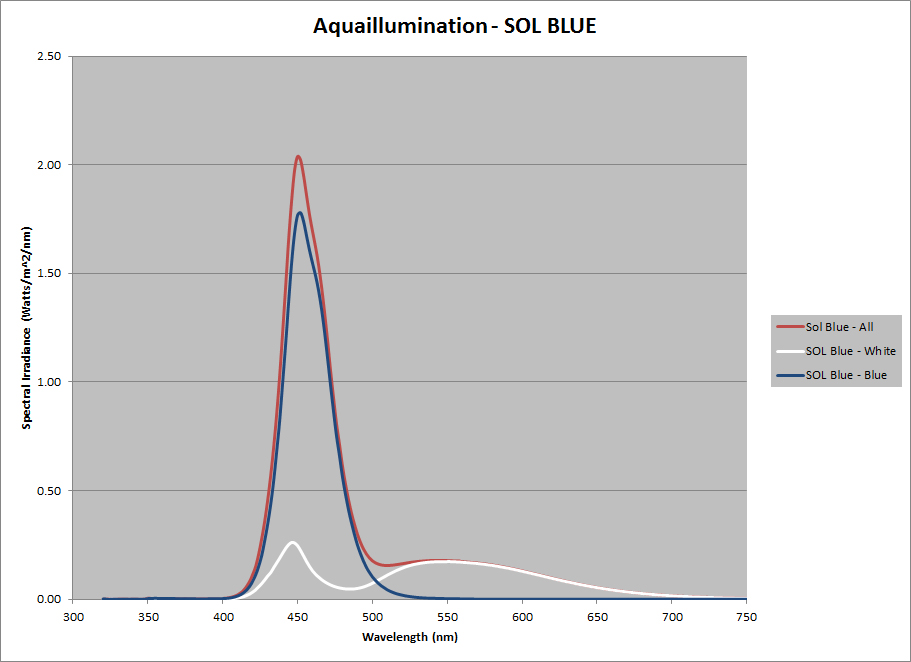
Figure 7b. Spectral Output of the AI Sol Blue as compared to Metal Halide
AI Nano Sol (with warm white)
The fixture includes is a miniature version of the larger SOL White and SOL blue. With (2) Warm White XM-Ls, (4) Blue Cree XP-Es and (4) Royal Blue Cree XP’Es mounted in a pair of LED clusters. The controllers provides 3 channels of control one for each color allowing each to be controlled from 0-100% output. Figure 8a shows the light output of the various channels and figure 8b compares it to the metal halide spectrum.
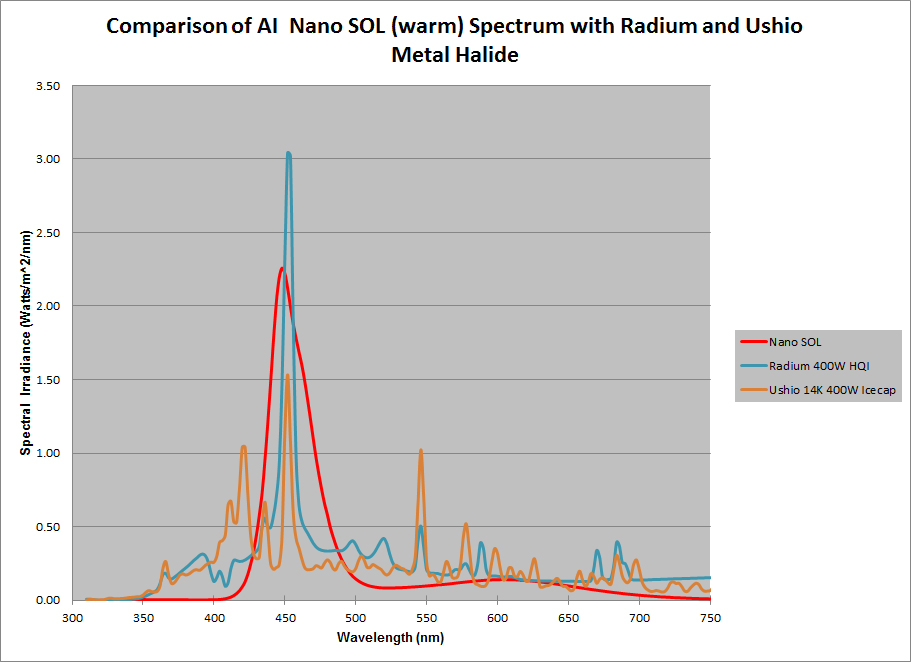
Figure 8a. Spectral Output of the different LED components – AI Sol Nano
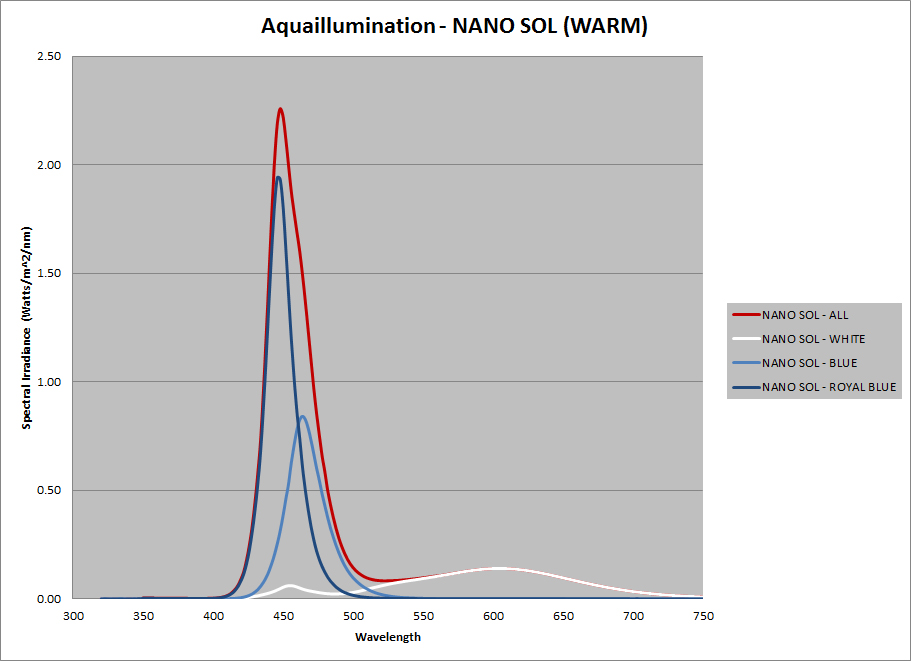
Figure 8b. Spectral Output of the AI Sol Nano as compared to Metal Halide
Discussion
As seen from the data, there are significant spectral differences between the LED spectrum and those of the most popular MH lamps. The LEDs tend to have more output in the blue regions 400-500 nm range, while lacking in the warmer regions of the spectrum. This could explain why the aquariums tend to have a “flat” look when lit by LEDs. Lack of the red spectrum results in corals and fish with red color to look lack lustre. Lack of a broader spectrum and missing quantities of output at wavelengths to promote a more full spectrum is often a concern cited with LEDs, and it is obvious when comparing the spectrums to metal halides. As seen from the newer generation of LEDs there is an attempted to address this by providing more choice of colors (and channels of control) to allow tweaking of individual channels to enable users to fine tune the look of the aquariums and provide the ability to have one light fixture with the potential to satisfy a wide range of users.
There are some difference between the spectral output of the LED fixtures, especially outside the blue spectrum. These differences seen in Figure 9, are primarily due to the differences in the white LEDs being used and the quantity of white light. The figure below shows how the different LED fixture compare against each other and the differences between the spectral output.
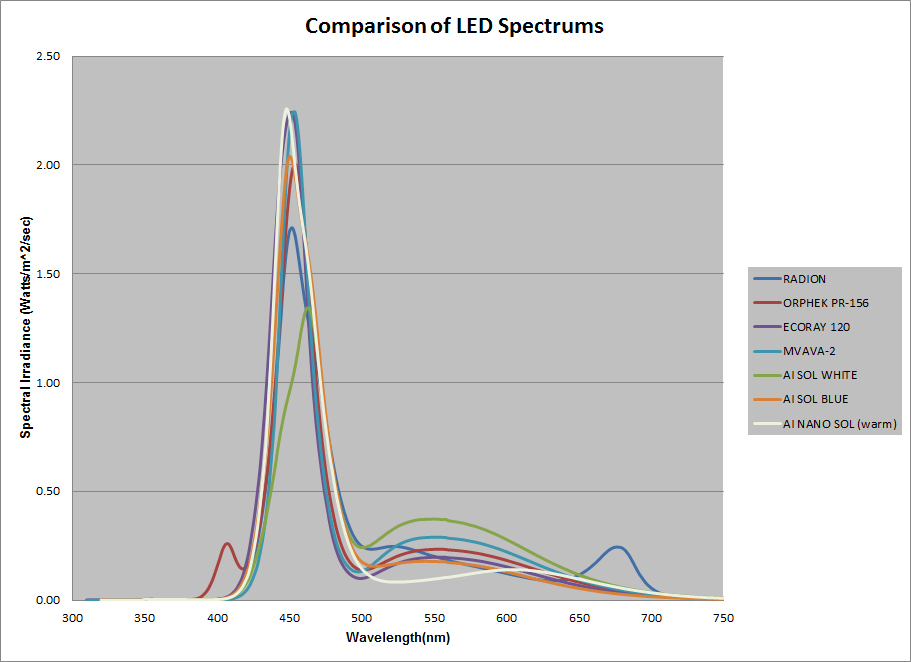
Figure 9.
These spectral difference will impact the visual look of the aquarium as well have some impact on the colors that develop in the corals. It should be noted that these spectral plots are measured with all lights at 100%, while in practice some users may dim certain colors to create a look that suits them and their perception of how a tank should look. What is obvious, from looking at the individual graphs is that the resulting light spectrum will be a direct addition of the spectral output of the various component lamps. In this regard the LEDs definitely provide a significant advantage over the traditional one bulb one look approach of metal halide lighting. The data presented here should be viewed in conjunction with the distributed data presented in my earlier articles provided in the references.
References
- S. Joshi, Quantitative Comparison of Lighting Technologies: Metal Halide, T5 Fluorescent and LED, Advanced Aquarist, Vol. IX, Feb. 2010
- S. Joshi, LED Lighting Tests: Aquaillumination, Blue Moon, Eco-Lamp KR-91, Ecoxotic Panorama, Advanced Aquarist, Vol. IX, May 2010.
- S. Joshi, LED Lighting Tests: Ecoray, Reef Fanatic, and MaxSpect, Advanced Aquarist, Vol. X, Aug. 2011.
- S. Joshi, LED Lighting Tests: Radion, Orphek, Mvava, Ecoray and Ecoxotic, Advanced Aquarist, Vol. X1, Jan. 2012.

0 Comments