

While every hobbyist realizes lighting is an important aspect of successful reef-keeping, there is still much debate about intensity, spectral quality, and photoperiod. This article will flesh out some of the information I presented at the 2013 Marine Aquarium Conference of North America (MACNA) held in Fort Lauderdale, Florida (I had 45 minutes to present the information which could have easily been a two-day class). I’ll present information about how much light is available to the corals.
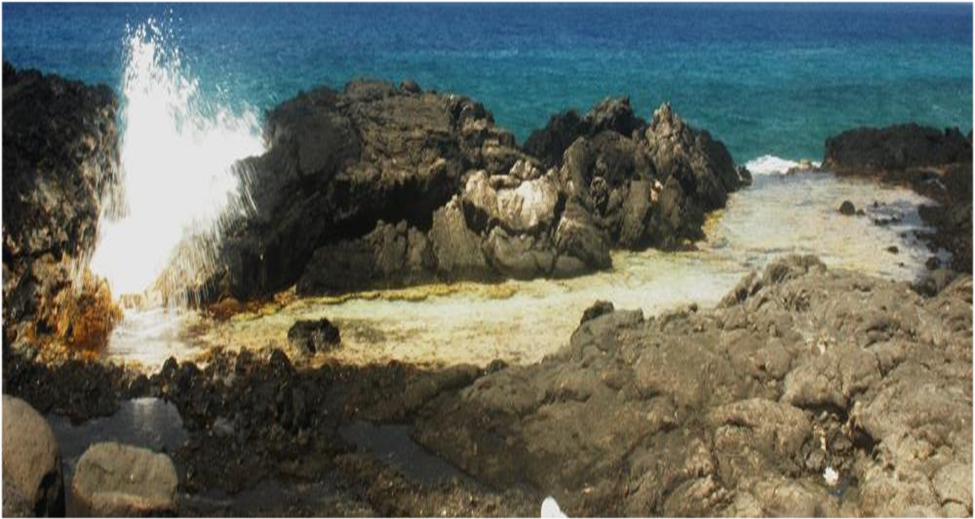
Figure 1. The tidepool discussed in this article. It remains at a fairly consistent depth. See text for details.
The first part of the project was to look at the light intensity in a shallow tidepool. This tidepool is a little different than most in Hawaii in that its depth is not usually affected by tides. This seems a contradiction, so an explanation is in order. See Figure 1.
As can be seen in Figure 1, the elevation of the tidepool is above high tide level, and water enters through a ‘blow hole’ (at the left in the photograph). Wave energy is focused by a crevice in the rock and the seawater jets upwards and falls into the pool. The water then flows in a northwest direction where it discharges back into the ocean. The depth in most of the pool is about 2 inches (~1 cm) above the top of the corals. Only in times of extreme surge does the water depth become deeper (and then perhaps 18 inches – ~7cm – deep). Figure 2 shows corals growing at the northwest end (discharge) of the pool.
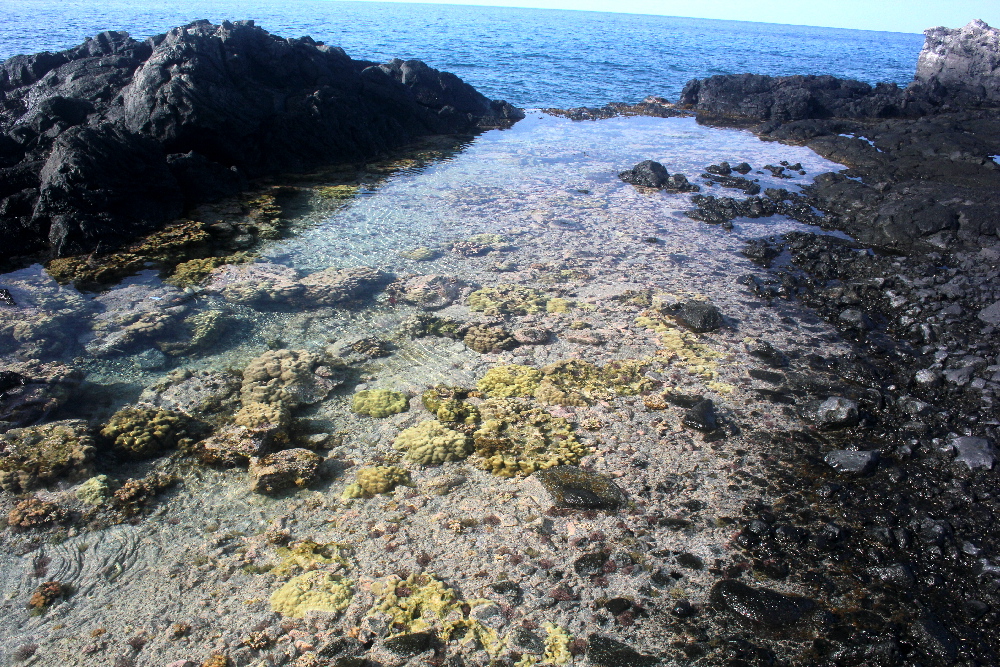
Figure 2. A variety of corals growing in the extremely shallow tidepool.
The number of coral taxa living in this pool is remarkable and includes Porites lobata, Porites evermanni/ lutea, Pocillopora meandrina, Pocillopora damicornis, and many others. Two of the corals – Porites lobata and Pocillopora damicornis – are considered ‘small-polyp stony’ or SPS corals and were of particular interest.
The invitation to speak at MACNA came in December 2012, and I had to propose a subject for the presentation and begin formulating a strategy to complete the project by late summer. The proposal was accepted quickly, and the clock began ticking. In a few months, I would question my sanity in choosing such an ambitious set of experiments. All I could do was tackle a portion at a time, so the first project would entail collection of light data during a ‘typical’ winter day in Hawaii. This may sound like a day at the beach, but many problems had to be overcome. First, my data loggers for PPFD (or PAR) failed to operate. They had served me well for years, so I ordered a newer model and software from Spectrum Technologies (Aurora, Illinois, USA). While waiting for the order to arrive, I began scouting for an appropriate spot to deploy this equipment. It had to meet several criteria. First, the tidepool had to be easily accessible and within a reasonable distance from my laboratory. It had to be in a relatively flat area in order to avoid early morning and late evening shadows. The depth would have to be fairly shallow and relatively free of strong surge (even small waves can toss and overturn a quantum sensor anchored with a five-pound dive weight). The area had to be secure in case I needed to leave the equipment unattended for a few minutes. After evaluating several sites, a small tidepool north of the village of Kailua-Kona (west coast of the Big Island of Hawaii) was chosen. It was now the first week of February, thirty-something days since the invitation was accepted. Less than eight months remained before the conference, and not one bit of data had been collected. In addition to all the conditions listed above, the day would have to be relatively cloud-free in order to get the info needed to start the project. The crystal ball for Hawaii weather is also a bit cloudy (no pun intended). I would have to watch the weather reports on the local news (no Weather Channel available on Big Island cable TV. No need – it is usually ‘nice’ and 80F – ~27C). The stars and planets would need to align – clear sunny weather all day and the equipment (data logger and computer-driven spectrometer) would need to be in place before sunrise AND function flawlessly all day. As it turned out, the first attempt was not successful. The clock was still ticking and meaningful results remained elusive. My stress level began to climb.
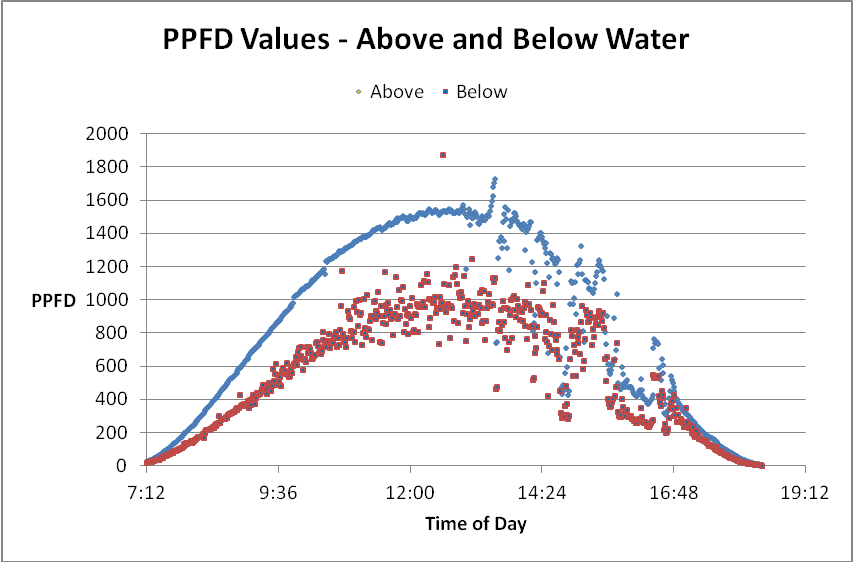
Figure 3. Underwater Photosynthetic Photon Flux Density (PPFD) at a depth of two inches. Hobbyists often call these values PAR (for Photosynthetically Active Radiation).
Fortunately, the second attempt was successful. The Figure 3 shows the results. The PAR data logger recorded PPFD values at a depth of two inches every minute for the entire photoperiod, for a total of almost 700 measurements. An Ocean Optics USB 2000 spectrometer recorded tens of thousands of spectral data points as well. Light quality will be the subject of a future article. See Figure 3 for PPFD values.
As Figure 3 demonstrates, the sun rose at about 7 am and set at about 6:15 pm, for a photoperiod of approximately 11.25 hours. The weather remained clear (with only slight amounts of smoke from the nearby volcanoes present) for most of the day. High clouds were present for only a few minutes in the late afternoon (about 3:45 to 4:30 pm). The PAR sensor takes snapshots of very short duration and the ‘glitter lines’ generated by waves generated by surge or wind are apparent at 10 am to ~4pm. Figure 4 shows the data with a trend line and allows us to judge smoothed information.
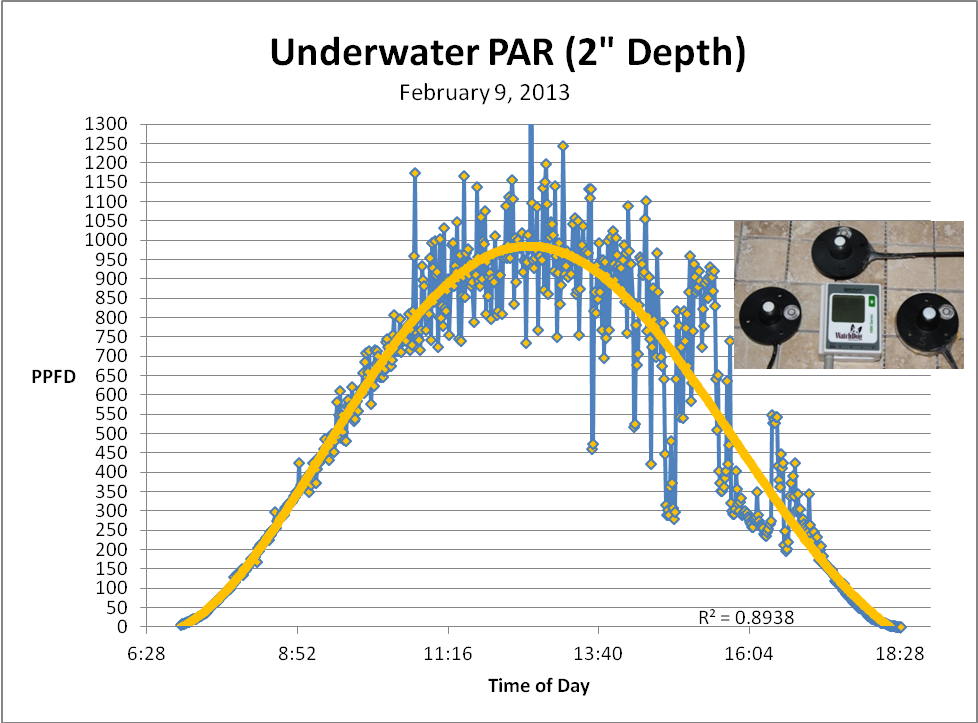
Figure 4. The underwater PPFD data with a polynomial trend line. As we can see, the smoothed data shows a peak PPFD at about noon of ~1,000 µmol·m²·sec. The inserted photo shows the WatchDog datalogger and sensors.
Finally, I had some usable information and my stress level began to level off. Now the data analyses could begin.
Daily Light Integer
Instantaneous PPFD values are of great value but tell only part of the story. The best comparison is to compare PPFD to rainfall. An instantaneous PPFD value (the number of photons falling on a given surface area in a given amount of time) is equivalent to the number of raindrops falling on an equal area and time. We would find a weather report presenting rainfall as number of raindrops falling on a square meter per second to be practically useless. We are more interested in the total amount of rainfall reported in inches or centimeters. The same is true for light – we should be interested in the total number of photons in a given photoperiod. This is called the Daily Light Integer, or DLI. The DLI simply sums the total amount of photons falling on one square meter per photoperiod (in hours). It would be a tedious task to add up all 700 instantaneous PPFD measurements. Fortunately the WatchDog software does this with only a couple of key strokes. Figure 5 shows DLI values for above and below the water line.
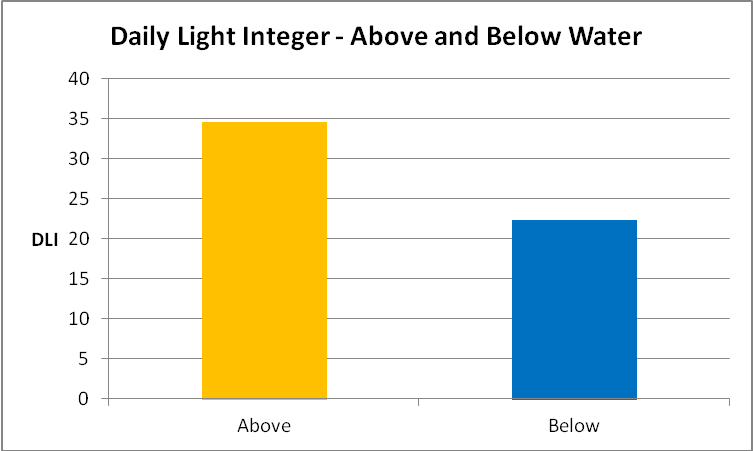
Figure 5. Total amount of light above and 2 inches below the tide pool water line during an 11.25 hour photoperiod. Only 65% of the surface light reaches a depth of two inches.
Conclusions and Discussion
The west coast of the Big Island of Hawaii has some healthy coral reefs (but the number of coral species is relatively low). Although the latitude there is only ~20 north of the equator, it is still subject seasonal changes in solar radiation (Key West, Florida’s latitude is about 25N.) Of course the amount of light and photoperiod is less and shorter, respectively, than in summer, but the information presented here is representative of a typical winter (February) day. As any visitor or resident of the Big Island knows, the island is still an active volcano, with two open vents currently spewing tons of noxious gases into the atmosphere. Undoubtedly, this mixture of volcanic gases and smoke (‘vog’) from burning forests (caused by lava flows) lessens the amount of visible light falling upon the earth. Vog also absorbs some ultraviolet radiation. However, vog was not present in great quantities on the days the data loggers were deployed.
As we have seen, lensing effect of passing waves creates ‘glitter lines’ and the instantaneous amount of light can be highly variable at a depth of two inches in the tide pool. When a trend line is added to the data, we see the maximum underwater light intensity at noon is about 1,000 µmol·m²·sec.
The total number of photons (or DLI, as shown in Figure 5) is also affected by sky clarity but more dramatically by water depth. The depth is quite shallow and we cannot escape the effects of solar elevation and water surface reflection. Since the sun’s elevation is lower in winter than summer, the light’s angle of incidence is relatively high and some of the light is simply reflected by the water surface. Hence, in this case, approximately 35% of the sunlight is reflected or absorbed by the water (there is also the possibility that light is scattered by particles suspended in the water column, an effect called turbidity).
The Daily Light Integer (DLI) gives us a chance to compare natural light dosage to that in an aquarium. Can we possibly match the amount of natural light in an aquarium? We can answer the question with simple math.
Example
A coral in an aquarium receives 500 µmol·m²·sec and the photoperiod is 12 hours. What is the DLI, and how does it compare to the tide pool? Remember, we want to calculate the total number of photons falling on a surface during the entire photoperiod. This is quite easy in an aquarium, since the lights are either on at full intensity, or off, in many setups.
500 µmol·m²·sec * 60 seconds in a minute * 60 minutes in an hour * 12 hour photoperiod = 21,600,000 µmol photons. This number is unwieldy, so we divide by 1,000,000 to convert µmol to mol photons. Our DLI (in mol photons in a 12 hour photoperiod) equals 21.6.
The tide pool DLI is 22.3, so an aquarium coral receiving 500 µmol·m²·sec in a 12 hour photoperiod is receiving just about as much light as a shallow water (2″ depth) coral does in Hawaii in February. If we bump the light intensity upwards to 525 µmol·m²·sec and the photoperiod remains at 12 hours, we would exceed the natural winter DLI. Of course, we could lower the light intensity and extend the photoperiod and get the same DLI.
The first sets of data were collected. Time course light intensities (above and below water) were recorded. The computer and Ocean Optics spectrometer had done their jobs and spectral data were now available for analyses. As it happened, I would collect a second set of light data. Just to be sure, or more likely, I’m a glutton for punishment.
Some pressure was off. The analyzed information showed the amount of light in the tidepool and that it could be matched in an aquarium. Many questions remained. How much light did the tidepool corals actually require? How did they respond to high light intensity – did their zooxanthellae possess unlimited adaptive processes or was this tide pool a hostile environment where corals took a licking but kept on ticking? What is the spectral quality of sunlight at this shallow depth? How does the underwater spectral quality compare to aquarium lights? I realized the amount of work facing me and the stress started to return. The relentless count down to the MACNA conference continued. I would need to generate enough information to make a 45-minute presentation. What I had could be discussed in a few minutes. There was no guarantee any of the future data would be of any use. What had I gotten myself into?
Next time, we’ll look at the light requirements of these tide pool corals and how they use (or don’t use) available solar energy.
0 Comments