

a Aquaculture and Fisheries Group, Department of Animal Sciences, Wageningen University, Wageningen University and Research centre, 6708 WD Wageningen, The Netherlands
b Coastal and Marine Management, VHL University of Applied Sciences, 8934 CJ Leeuwarden, The Netherlands
*These authors contributed equally to this work
Keywords: Stylophora, pistillata, coral aquaculture, nutrient enrichment, zooxanthellae, bicarbonate, DIC
Introduction
Coral reefs are amongst the most biodiverse ecosystems and equal the primary production of tropical rainforests [1]. In contrast to their high productivity, coral reef waters are oligotrophic, with nitrogen (N) often below 0.6 µmol L-1 and phosphorus (P) usually below 0.2 µmol L-1 [2]. A key feature that explains the survival of scleractinian corals in such a nutrient-poor environment is their endosymbiosis with zooxanthellae, dinoflagellates of the genus Symbiodinium [3]. The coral host provides the zooxanthellae with metabolic waste in the form of nitrogen, phosphorus and carbon dioxide (CO2), while the zooxanthellae transfer their excess photosynthate to the host [3,4]. This tight recycling of nutrients within the symbiosis ensures the growth and survival of coral reefs in the oligotrophic “blue deserts” of the sea.
Deforestation, urbanization, and intensified agriculture cause increased topsoil erosion and runoff from land. Combined with sewage disposal and aquaculture activities, this results in eutrophication of coastal waters and exposes coral reefs to higher than usual sediment and nutrient concentrations [1,5,6,7,8]. Research into the effects of eutrophication on coral reefs is mainly focused on the reef ecosystem, although there are studies investigating the primary effects of nutrients on coral growth and physiology.
High nutrient concentrations are generally accepted to adversely affect coral calcification [9,10,11,12,13], although there are some studies reporting no effect [14] or both increases and decreases [15]. Nutrient-induced reduction of coral calcification is often attributed to the response of the symbiotic zooxanthellae population within the coral to increased nutrient availability [4,9,10,16,17]. Several studies show that exposure to elevated inorganic nitrogen or combined inorganic nitrogen and phosphorus concentrations results in higher zooxanthellae densities [4,9,10,16,17], higher overall photosynthesis rates and reduced calcification rates [10,11,18].
The proposed mechanism is that the zooxanthellae, which are no longer nutrient limited, retain more photosynthetic products for their own growth and maintenance, thereby reducing the amount of translocated organic carbon that can be respired by the coral host to produce energy for coral calcification [3,4]. Next to reduced translocation of photosynthate to the coral host, another mechanism has been proposed to explain the negative effect of nutrient enrichment on coral growth. As corals and zooxanthellae use the same dissolved inorganic carbon (DIC) substrates (CO2, HCO3–) for calcification and photosynthesis, respectively [19], elevated nutrient-driven zooxanthellae densities may increase this competition in favour of the symbionts, thereby negatively affecting coral calcification. A third explanation for reduced calcification under nutrient enrichment is that nutrient enrichment leads to a decrease in photosynthesis rates per zooxanthella, due to DIC competition amongst the symbionts themselves and light limitation caused by self-shading [17]. This, in turn, might result in less photosynthate transfer to the coral host, and thus in a decrease in calcification rates. Finally, crystal poisoning of the growing skeletal matrix by phosphate molecules may negatively affect coral calcification [33].
Marubini & Thake [20] showed that simultaneous addition of DIC (as HCO3–) and nitrogen confers protection against the negative effect of nitrogen enrichment on calcification in Porites porites. However, Marubini & Thake [20] did not measure zooxanthellae densities. Therefore, the mechanism for DIC limitation of calcification under nutrient enrichment remains unconfirmed. Furthermore, the effects of simultaneous addition of inorganic nitrogen and phosphorus may vary between coral species. Therefore, the aim of this study was to determine the short-term effects of increased ambient DIC on calcification rates in another scleractinian coral species, Stylophora pistillata, both under baseline conditions and under conditions of elevated, nutrient-driven zooxanthellae densities. S. pistillata was chosen as it is known to exhibit elevated zooxanthellae densities and reduced calcification rates under conditions of nutrient enrichment [11].
Materials and Methods
Ethics Statement
Captive-bred corals were provided by Burgers’ Zoo BV (Arnhem, The Netherlands). All experiments were conducted at Wageningen University (Wageningen, The Netherlands). No approval from an ethics committee was required, as scleractinian corals are exempted from legislation concerning the use of laboratory animals in the European Union (Directive 2010/63/EU).
Study Species and husbandry
For this study, one genotype of the Indo-Pacific scleractinian coral Stylophora pistillata (Esper, 1797) was obtained from Burgers’ Zoo BV (Arnhem, The Netherlands). At the time of this experiment, this clone had been in aquaculture for at least five years. Eight similarly sized colonies and 24 nubbins were fragmented using a wire cutter and were attached to a PVC tile (Wageningen UR, Wageningen, The Netherlands) with gel-based cyanoacrylate glue (Bison, Goes, The Netherlands). Colonies and nubbins were equally divided and maintained in two aquaria of 360 L; one control and one treatment aquarium and were allowed two weeks to recover before the experiment started. The four colonies in the control aquarium ensured identical conditions in both aquaria, but were not used for any measurements. In both tanks, nubbins and colonies were rotated weekly and randomly on the PVC table. Except for the nutrient enrichment treatment (see next subsection), husbandry was exactly the same for both aquaria. Corals were placed in a water current (flow rate of 5 cm s-1), created by a Turbelle stream 6085 pump (tunze Aquarientechnik GmbH, Penzberg, Germany). Irradiance was provided by two luminaires with four 54W Aquablue Special T5 bulbs each (ATI, Hamm, Germany). Quantum irradiance (QI) over the PVC tables was 250 (±5) mol quanta m-2 s-1 and a 12:12 h light:dark cycle was maintained. A constant temperature of 26 C (±0.5) was maintained with a 500W titanium heater (Aquatic Nature, Roeselare, Belgium). A MCE 600 foam fractionator (Deltec GmbH, Delmenhorst, Germany) was used to remove organic waste, while an external UV installation (Aquamedic GmbH, Bissendorf, Germany) prevented the formation of microalgae and bacterial blooms in the water.
Water parameters were measured 3 to 5 times a week (Table 1). Temperature and salinity were maintained at 26.0 °C (±0.5) and 35.0 g L-1 (±0.2), respectively. Alkalinity and pH were measured using an automatic Titralab TIM-580 titrator (Radiometer Analytical SAS, Lyon, France). An alkalinity standard of 2.5 mEq L-1 (Salifert, Duiven, The Netherlands) was used to verify titration accuracy. Repeated measurements revealed a titration precision of ±0.01 mEq L-1. The pH sensor was calibrated using pH 7 and pH 10 buffers (WTW GmbH, Weilheim, Germany) enriched in 25.4 g L-1 NaCl (or 10 g L-1 Na+), to approximate the ionic strength of seawater. Calcium was measured with a Calcium profi test kit, with a precision of ±5 mg L-1 (Salifert BV, Duiven, Holland). Ammonium, nitrate and phosphate were measured with a Hach DR2800 spectrophotometer (Hach-Lange GmbH, Düsseldorf, Germany). After every measurement alkalinity was adjusted to 2.4 mEq L-1 (2,346 µEq kg-1) by adding NaHCO3 (Merck KGaA, Darmstadt, Germany), while calcium concentration was adjusted to 400 mg L-1 (9,756 µmol kg-1) using CaCl2.2H2O (VWR International, Leuven, Belgium).
| Parameter | n inital | Initial period | n exposure | Exposure period | ||
|---|---|---|---|---|---|---|
| C aquarium | T aquarium | C aquarium | T aquarium | |||
| T (°C) | 18 | 25.9±0.1 | 25.9±0.3 | 20 | 25.9±0.2 | 25.9±0.3 |
| salinity (g L-1) | 18 | 34.9±0.2 | 34.9±0.2 | 20 | 35.2±0.1 | 35±0.1 |
| alkalinity (mEq L-1) | 20 | 2.29±0.272 | 2.32±0.15 | 20 | 2.27±0.19 | 2.29±0.16 |
| pH | 18 | 8.39±0.18 | 8.42±0.13 | 20 | 8.34±0.07 | 8.42±0.11 |
| Ca2+ (mg L-1) | 15 | 399±7 | 399±4 | 19 | 399±8 | 399±5 |
| NH4+-N (µmol L-1) | 9 | 0.53±1.59 | 0.00±0.00 | 15 | 0.00±0.00 | 9.66±8.29 |
| NO3– -N (µmol L-1) | 9 | 3.19±2.21 | 1.36±0.38 | 15 | 1.92±0.55 | 2.78±1.98 |
| Total N (µmol L-1) | 9 | 3.72±3.32 | 1.36±0.38 | 15 | 1.92±0.55 | 12.44±8.26 |
| PO43--P (µmol L-1) | 10 | 0.58±0.60 | 0.11±0.12 | 15 | 0.39±0.19 | 2.32±0.93 |
| NH4+-N (mg L-1) | 9 | 0.01±0.02 | 0.00±0.00 | 15 | 0.00±0.00 | 0.14±0.12 |
| NO3– -N (mg L-1) | 9 | 0.05±0.03 | 0.02±0.01 | 15 | 0.03±0.01 | 0.04±0.03 |
| Total N (mg L-1) | 9 | 0.05±0.05 | 0.02±0.01 | 15 | 0.03±0.01 | 0.17±0.12 |
| PO43--P (mg L-1) | 10 | 0.02±0.02 | 0.00±0.00 | 15 | 0.01±0.01 | 0.07±0.03 |
Nutrient Enrichment
During an initial period of four weeks, nutrient concentrations were kept as low as possible in both aquaria (Table 1). During a consecutive five week exposure period, the nutrient concentrations of the treatment aquarium were adjusted daily to 20 µmol L-1 N, using a 1 mol L-1 NH4Cl solution (Merck KGaA, Darmstadt, Germany), and 3 µmol L-1 P, using a 0.2 mol L-1 Na2HPO4 solution (Merck KGaA, Darmstadt, Germany). This resulted in a mean N concentration of 12.44 (±8.26 SD) µmol L-1 and a mean P concentration of 2.32 (±0.93 SD) µmol L-1. In the control aquarium, nutrient conditions were maintained as low as possible during the exposure period. In the treatment aquarium, nutrient concentrations during the exposure period were six to eight times higher compared to the initial period (Table 1).
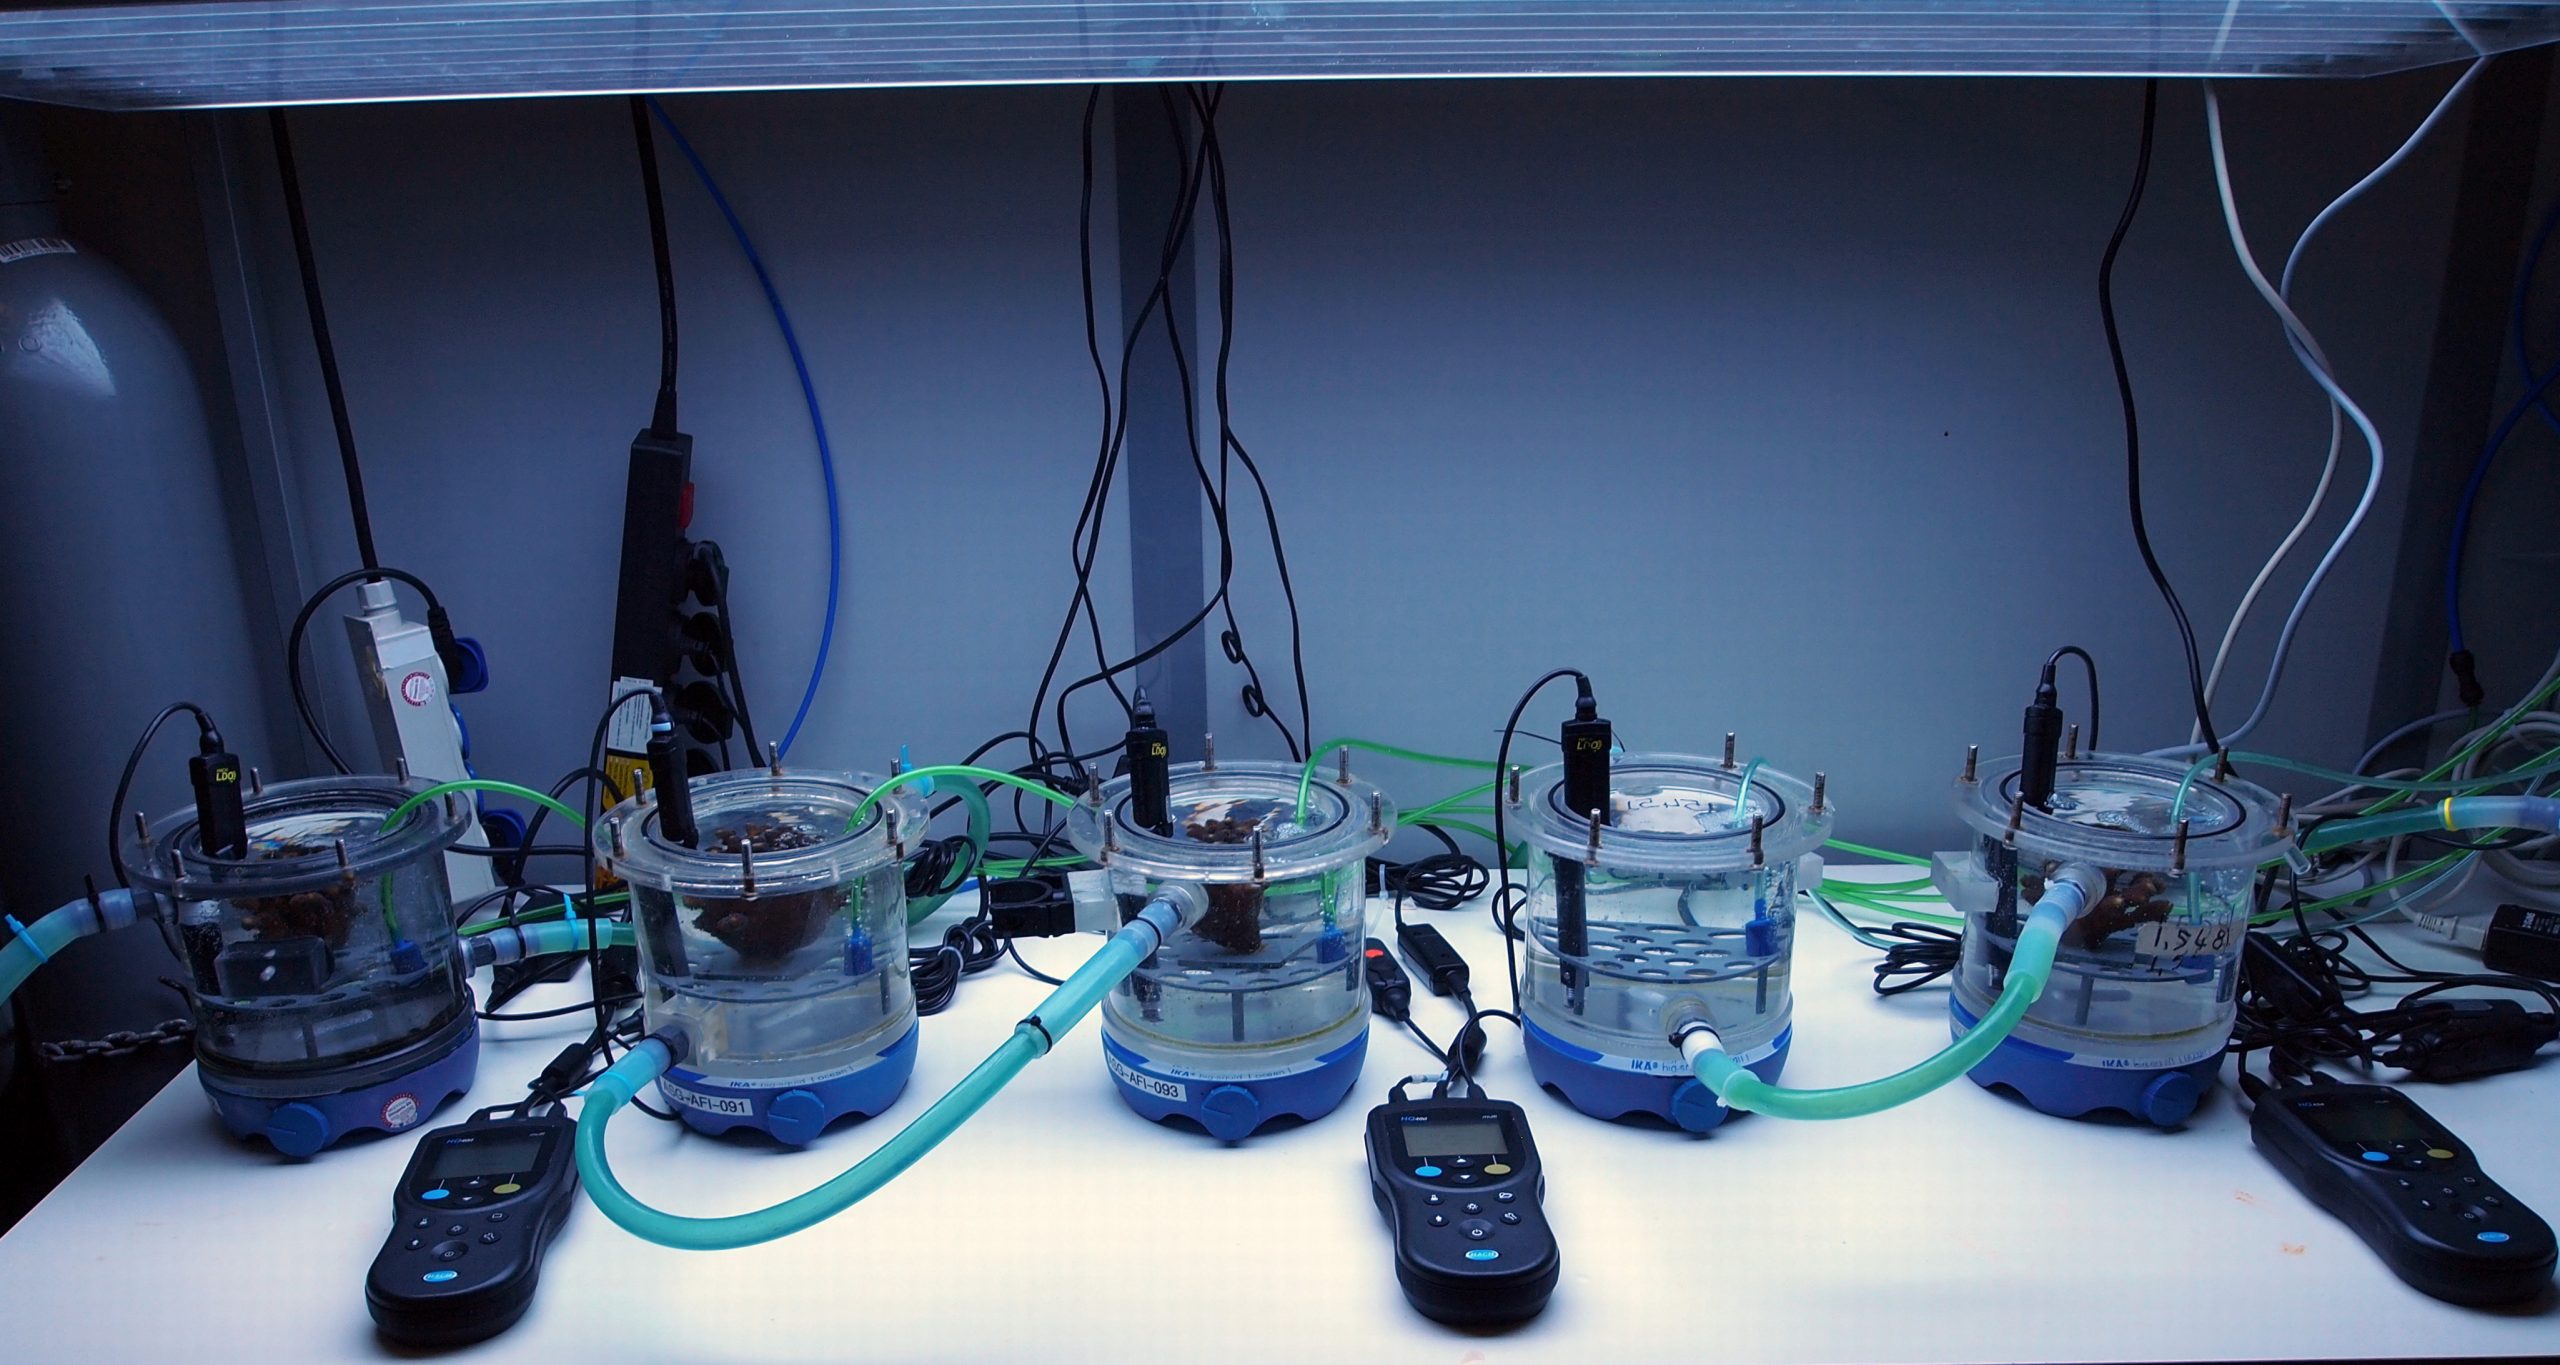
Figure 1: Experimental setup used for the short-term calcification measurements.
Short-term Calcification Measurements Before and After Nutrient Enrichment
The four S. pistillata colonies maintained in the treatment aquarium were used to investigate the limiting effects of DIC on calcification of corals with increased zooxanthellae densities. This was achieved by incubating all colonies under two different alkalinity concentrations, natural alkalinity (2.40 mEq L-1) and high alkalinity (4.80 mEq L-1), before (t=0 w) and after five weeks (t=5 w) exposure to elevated N and P concentrations. Short-term calcification rates during the four treatments were measured using the alkalinity anomaly technique [21,22].
The experimental setup consisted of five incubation cells, which were connected through water jackets (Figure 1). Deionized water flowing between the two walls of the water jackets was controlled using a TC20 aquarium chiller (TECO SRL, Ravenna, Italy) and ensured a constant temperature of 26±0.5 °C in the cells. The seawater batches in the cells were not connected to each other, resulting in four independent measurements and thus avoiding pseudoreplication. Magnetic stirring bars provided the corals with water flow (at approximately 5-10 cm s-1). Air was bubbled at a rate of 60 mL minute-1 to remove excess oxygen produced by coral photosynthesis. Dissolved oxygen was monitored constantly with three HQ40D multi-meters and LDO101 luminescent dissolved oxygen probes (Hach-Lange GmbH, Düsseldorf, Germany) and was maintained between 100% and 115% saturation (or 6.36 to 7.32 mg O2 L-1). The experimental setup was illuminated by a T5 luminaire with six Aquablue Special T5 bulbs (ATI, Hamm, Germany). Irradiance was maintained at 500 mol m-1 s-1, twice the amount used above the aquaria, to ensure irradiance was not limiting photosynthesis. Colonies were randomly distributed among the cells for the first treatment and this distribution was maintained throughout the experiment to exclude variation per colony by other factors than alkalinity as much as possible. All corals were exposed to the same treatment simultaneously, allowing for the use of one control cell for each treatment.
At the start of each treatment, the calcium concentration of the aquarium water was adjusted to 400 mg L-1. A bucket with 10 L aquarium water and NaHCO3 were used to prepare seawater with the required alkalinity. After 10 minutes homogenization, each cell was filled with 1.38 L of the prepared water. After 15 minutes acclimatization time, the experiment started. All S. pistillata colonies showed well extended polyps before every treatment, indicating the colonies were not stressed. At t=0 h, 80 ml water was extracted from each cell for alkalinity and nutrient measurements, leaving a net incubation volume of 1.3 L. At t=6 h, alkalinity and nutrients were measured again. Changes in inorganic nutrients (phosphate and ammonium) affect total alkalinity [23]. To circumvent this potential artifact, changes in NH3 and PO43- concentrations were measured and converted to alkalinity changes in mEq L-1 and subsequently used to correct all data, including controls. We used mmol L-1 to mEq L-1 ratios of 1:1 and 1:3 for NH3 and PO43-, respectively. The alkalinity change in each cell was corrected for changes in the control cell, to compensate for changes in alkalinity due to microbial activity and precipitation on cell surfaces.
As one mole CaCO3 used for calcification reduces the alkalinity with 2 molar equivalents [24], alkalinity changes were converted to moles CaCO3 L-1 by using a 1:2 ratio. By using the buoyant weight of each coral, obtained before every experiment and corrected for PVC tile and glue weight, alkalinity changes were converted to calcification rates and expressed as mg CaCO3 hour-1 g buoyant weight-1, yielding a specific (or relative) skeletal growth rate. Correcting for buoyant weight is valid for this species as it has a highly constant surface to volume and surface to mass ratio [25,26,27]. After each treatment, colonies were allowed to recover for at least 32 h, to reduce the risk of one treatment affecting the results of the next.
Determination of Zooxanthellae Density
The zooxanthellae densities of the nubbins were analyzed to serve as a proxy for the zooxanthellae densities in the experimental colonies. At t=0 w and t=5 w, the tips of six randomly selected nubbins from the control and the treatment aquarium were removed using a wire cutter. Each tip was weighed using the buoyant weight method and transferred to a 50 ml tube, in which tissue was removed using pressurized air during one minute. Ten mL of artificial seawater was added and the closed tube was shaken vigorously for one minute to remove all tissue from the walls of the tube and the skeleton. The now bare skeleton was removed with tweezers and the tube was centrifuged for 10 minutes, at 4 °C and 4,000 rpm [28]. The supernatant, containing most of the animal cells, was carefully removed and the pellet, containing the heavier zooxanthellae, was resuspended in 750 μL artificial seawater. The total volume of the suspension was determined using a 1 ml pipette, which was also used to homogenize the remaining sample. A small drop was transferred to both counting nets of a Neubauer improved counting chamber (LO-Laboroptik Ltd, Lancing, UK) of which the upper left corners, consisting of 16 squares each, were counted and the mean was determined. As the volume of one corner of the counting chamber is 0.1 mm3 (0.1 µL), the total number of zooxanthellae per tip could be calculated. Zooxanthellae density was expressed as zooxanthellae gram buoyant weight-1.
Statistical Analysis
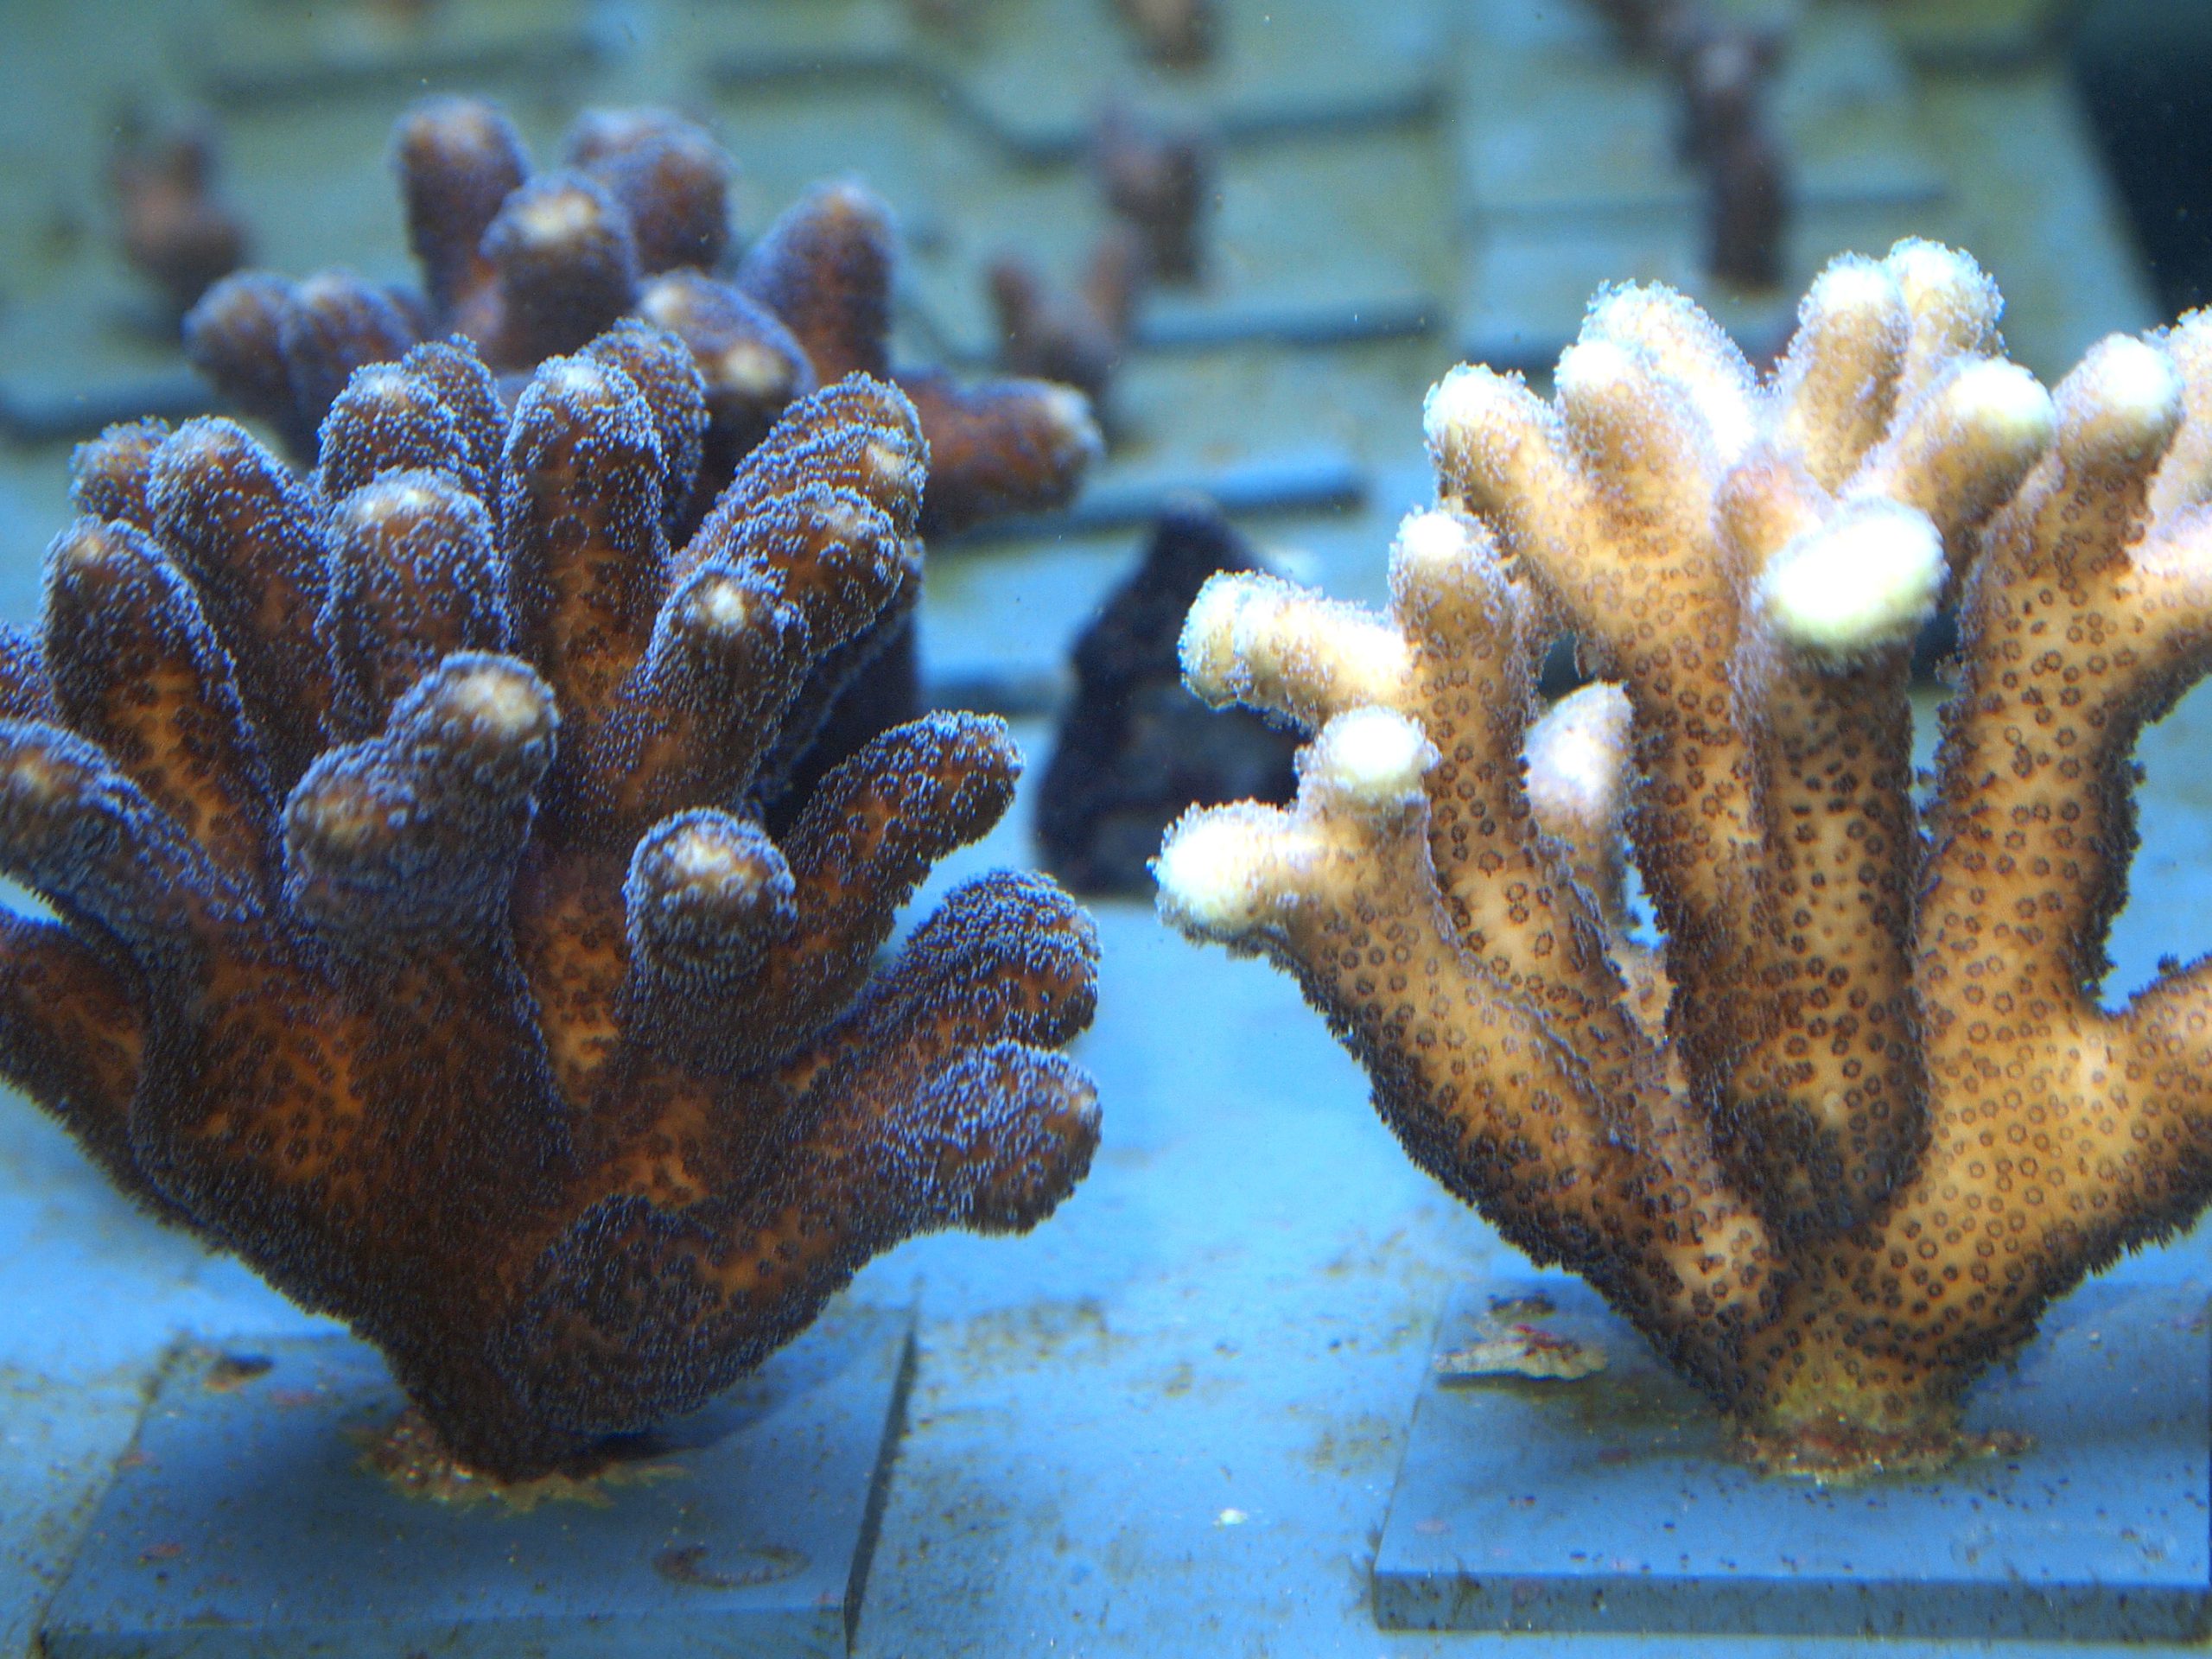
Figure 2: Stylophora pistillata colonies after a five week exposure to elevated nutrient concentrations (left) and to oligotrophic conditions (right).
All analyses were performed using SPSS statistics 19.0 (IBM, Somers, USA). Residuals of zooxanthellae and calcification data were normally distributed (Shapiro-Wilk, p>0.05), and zooxanthellae data also showed homogeneity of variances (Levene’s test, p>0.05). A one-way ANOVA was conducted to test for significant differences in zooxanthellae densities between aquaria and time points, followed by a post-hoc Bonferroni test. A two-way factorial repeated-measures ANOVA was used to determine the effects of nutrient enrichment and DIC addition on calcification rates. Simple effects were used to determine which treatments differed significantly. Values of p<0.05 were considered statistically significant.
Results
Effects of Nutrient Enrichment on Zooxanthellae Density
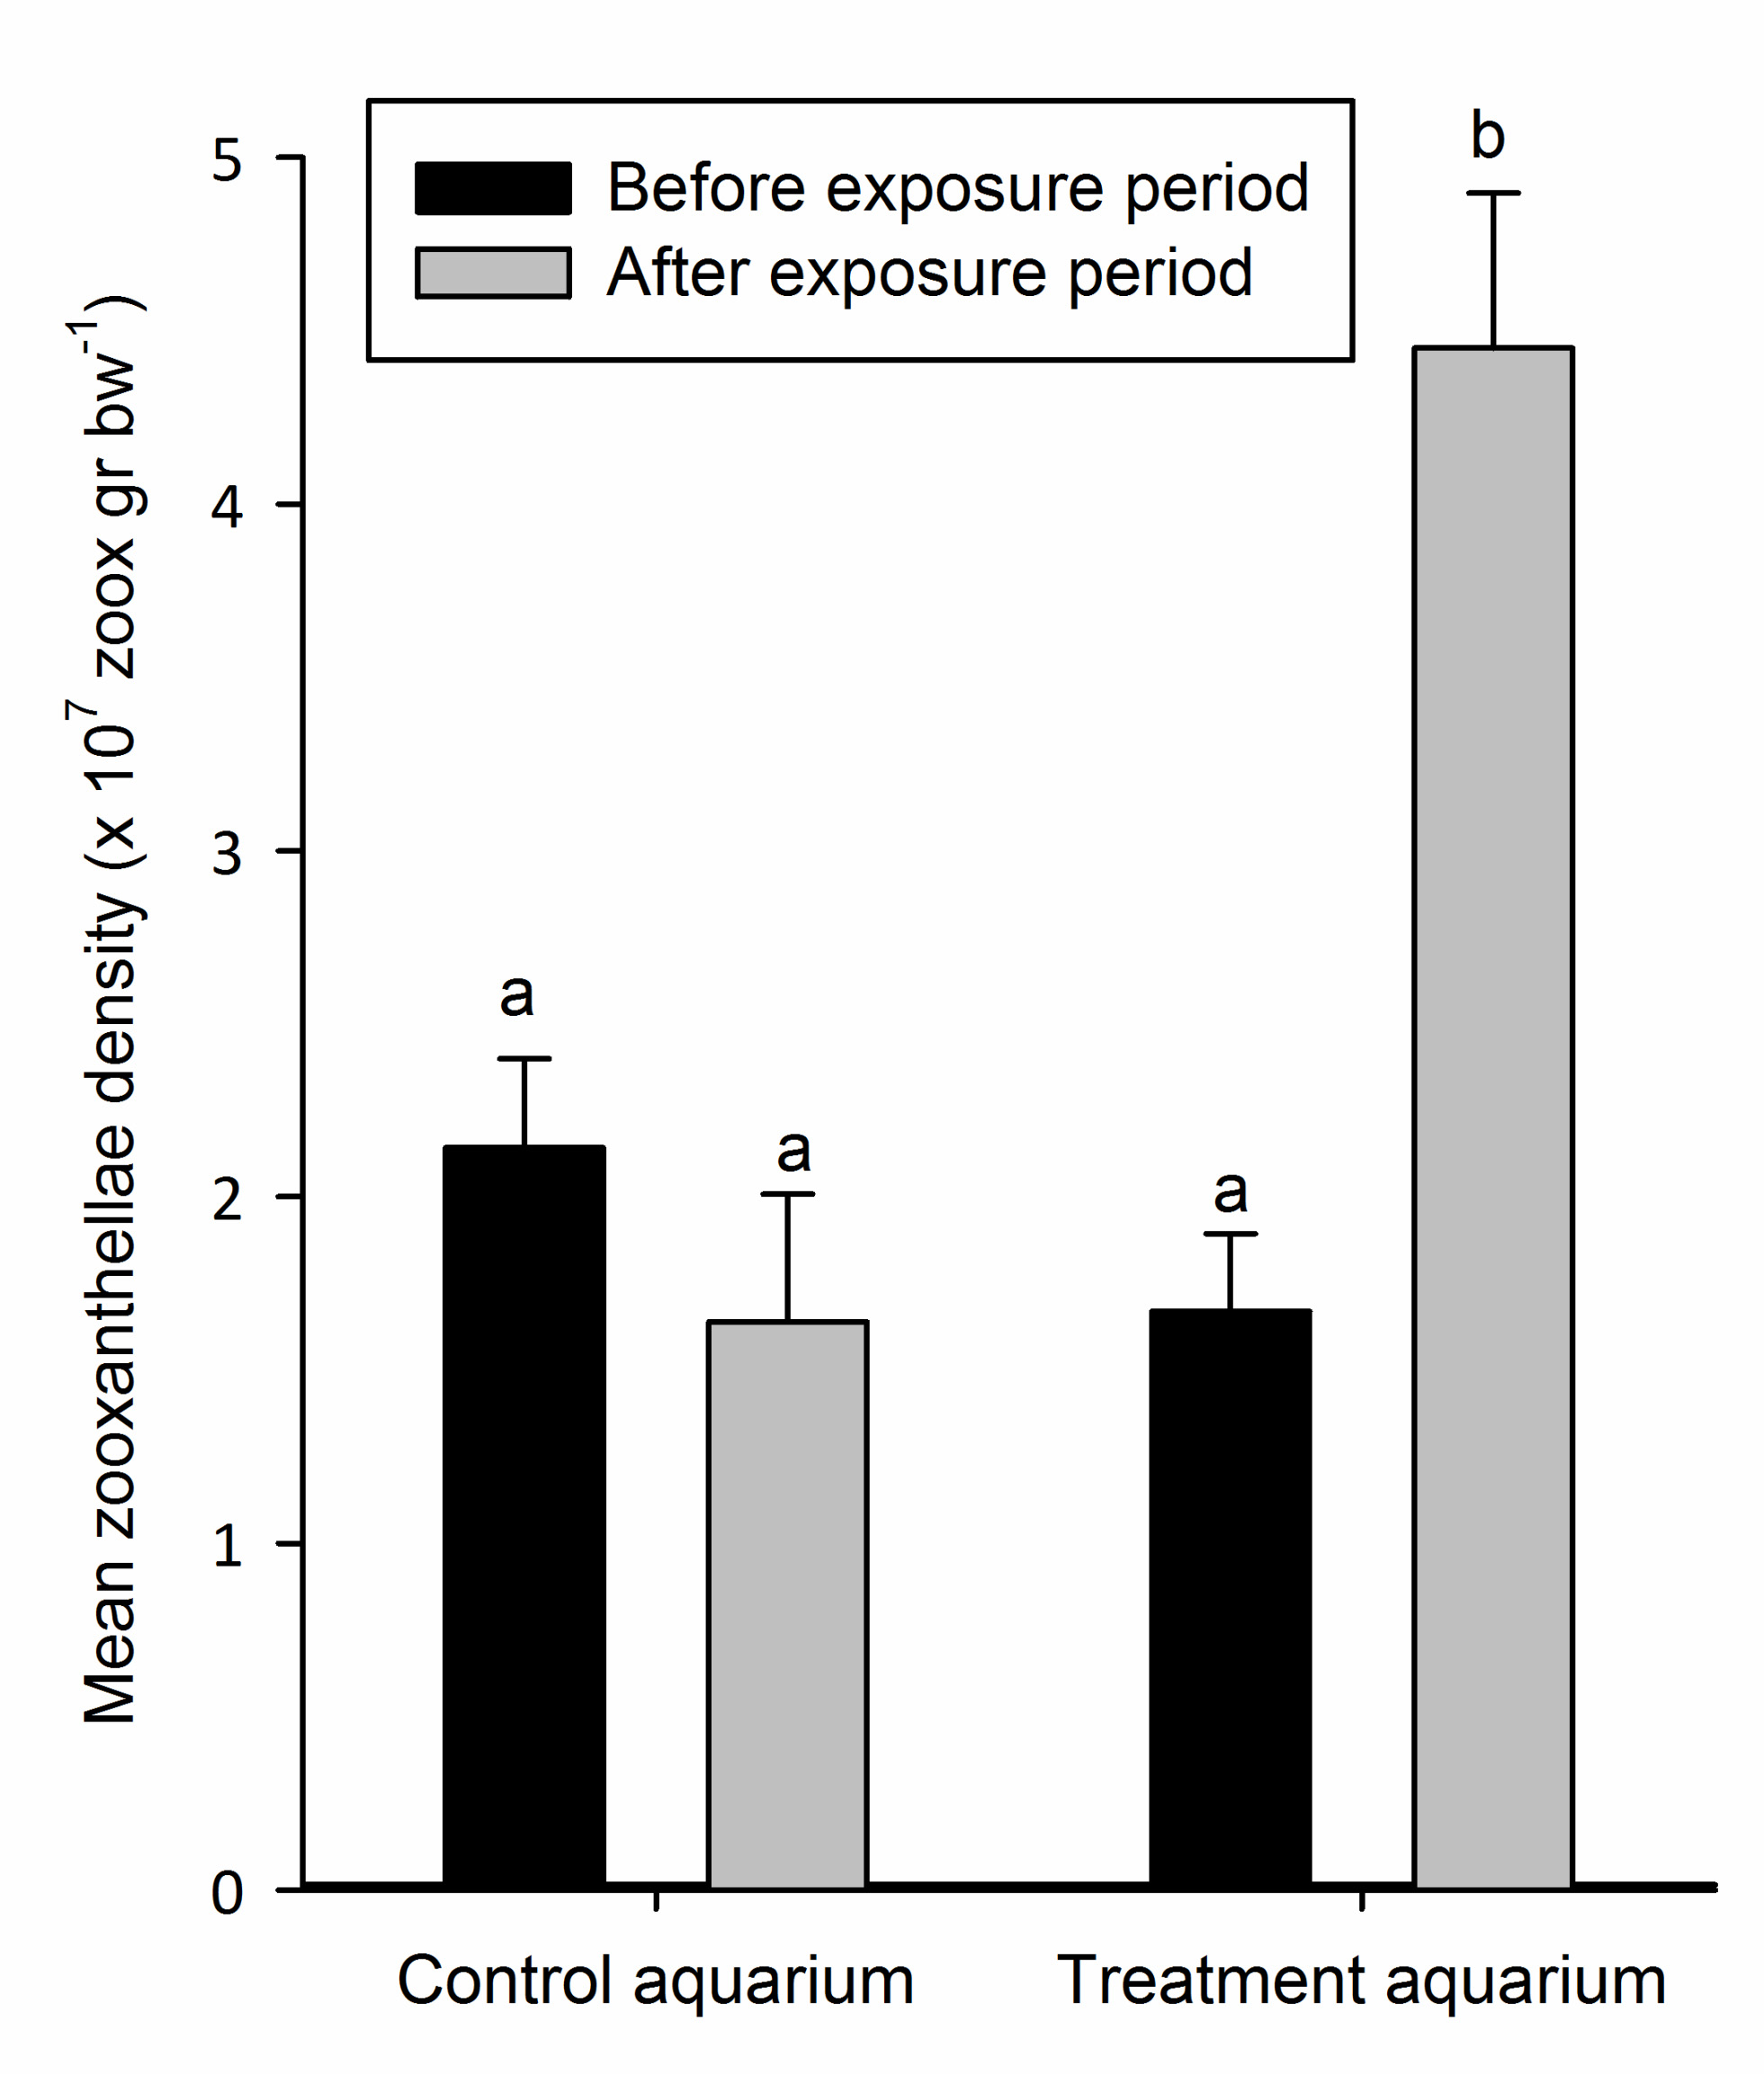
Figure 3: Mean zooxanthellae density (+SD) of the nubbins in the control and treatment aquarium before and after exposure to elevated N and P concentrations (n=6). Means sharing a common superscript do not differ significantly (p > 0.05).
Figure 2 shows the pigmentation of S. pistillata colonies after five weeks of exposure to elevated nutrient concentrations in the exposure aquarium (left) and under oligotrophic conditions in the control aquarium (right). After nutrient enrichment, S. pistillata colonies clearly showed increased pigmentation compared to colonies from the control aquarium. The growth tips of the nutrient-enriched colonies were also less pronounced.
Figure 3 shows the mean zooxanthellae density of S. pistillata before and after exposure to elevated nutrient enrichment. Mean zooxanthellae densities of the corals grown in the control aquarium were 2.14 x 10⁷ (±2.59 x 10⁶ SD) and 1.64 x 10⁷ (±3.69 x 10⁶ SD) zoox g bw-1, before and after the exposure period, respectively. For the treatment aquarium, these values were 1.67 x 10⁷ (±2.25 x 10⁶ SD) and 4.45 x 10⁷ (±4.48 x 10⁶ SD) zoox g bw-1 (Figure 3). Statistical analysis revealed that the zooxanthellae densities differed significantly (one-way ANOVA, F3,n29=94.52, p=0.000). In the control aquarium, no significant difference in zooxanthellae density was found before and after the exposure period (Bonferroni, p=0.147), nor were these values different from the zooxanthellae density in the treatment aquarium before the exposure period (Bonferroni, p=0.107 and p=1.000, respectively). However, in the treatment aquarium, the zooxanthellae density was significantly higher (2.7-fold) after nutrient exposure (Bonferroni, p=0.000), and also significantly higher compared to both values measured in the control aquarium (Bonferroni, p=0.000 for both comparisons).
Effects of DIC on Calcification at Baseline and Increased Zooxanthellae Densities
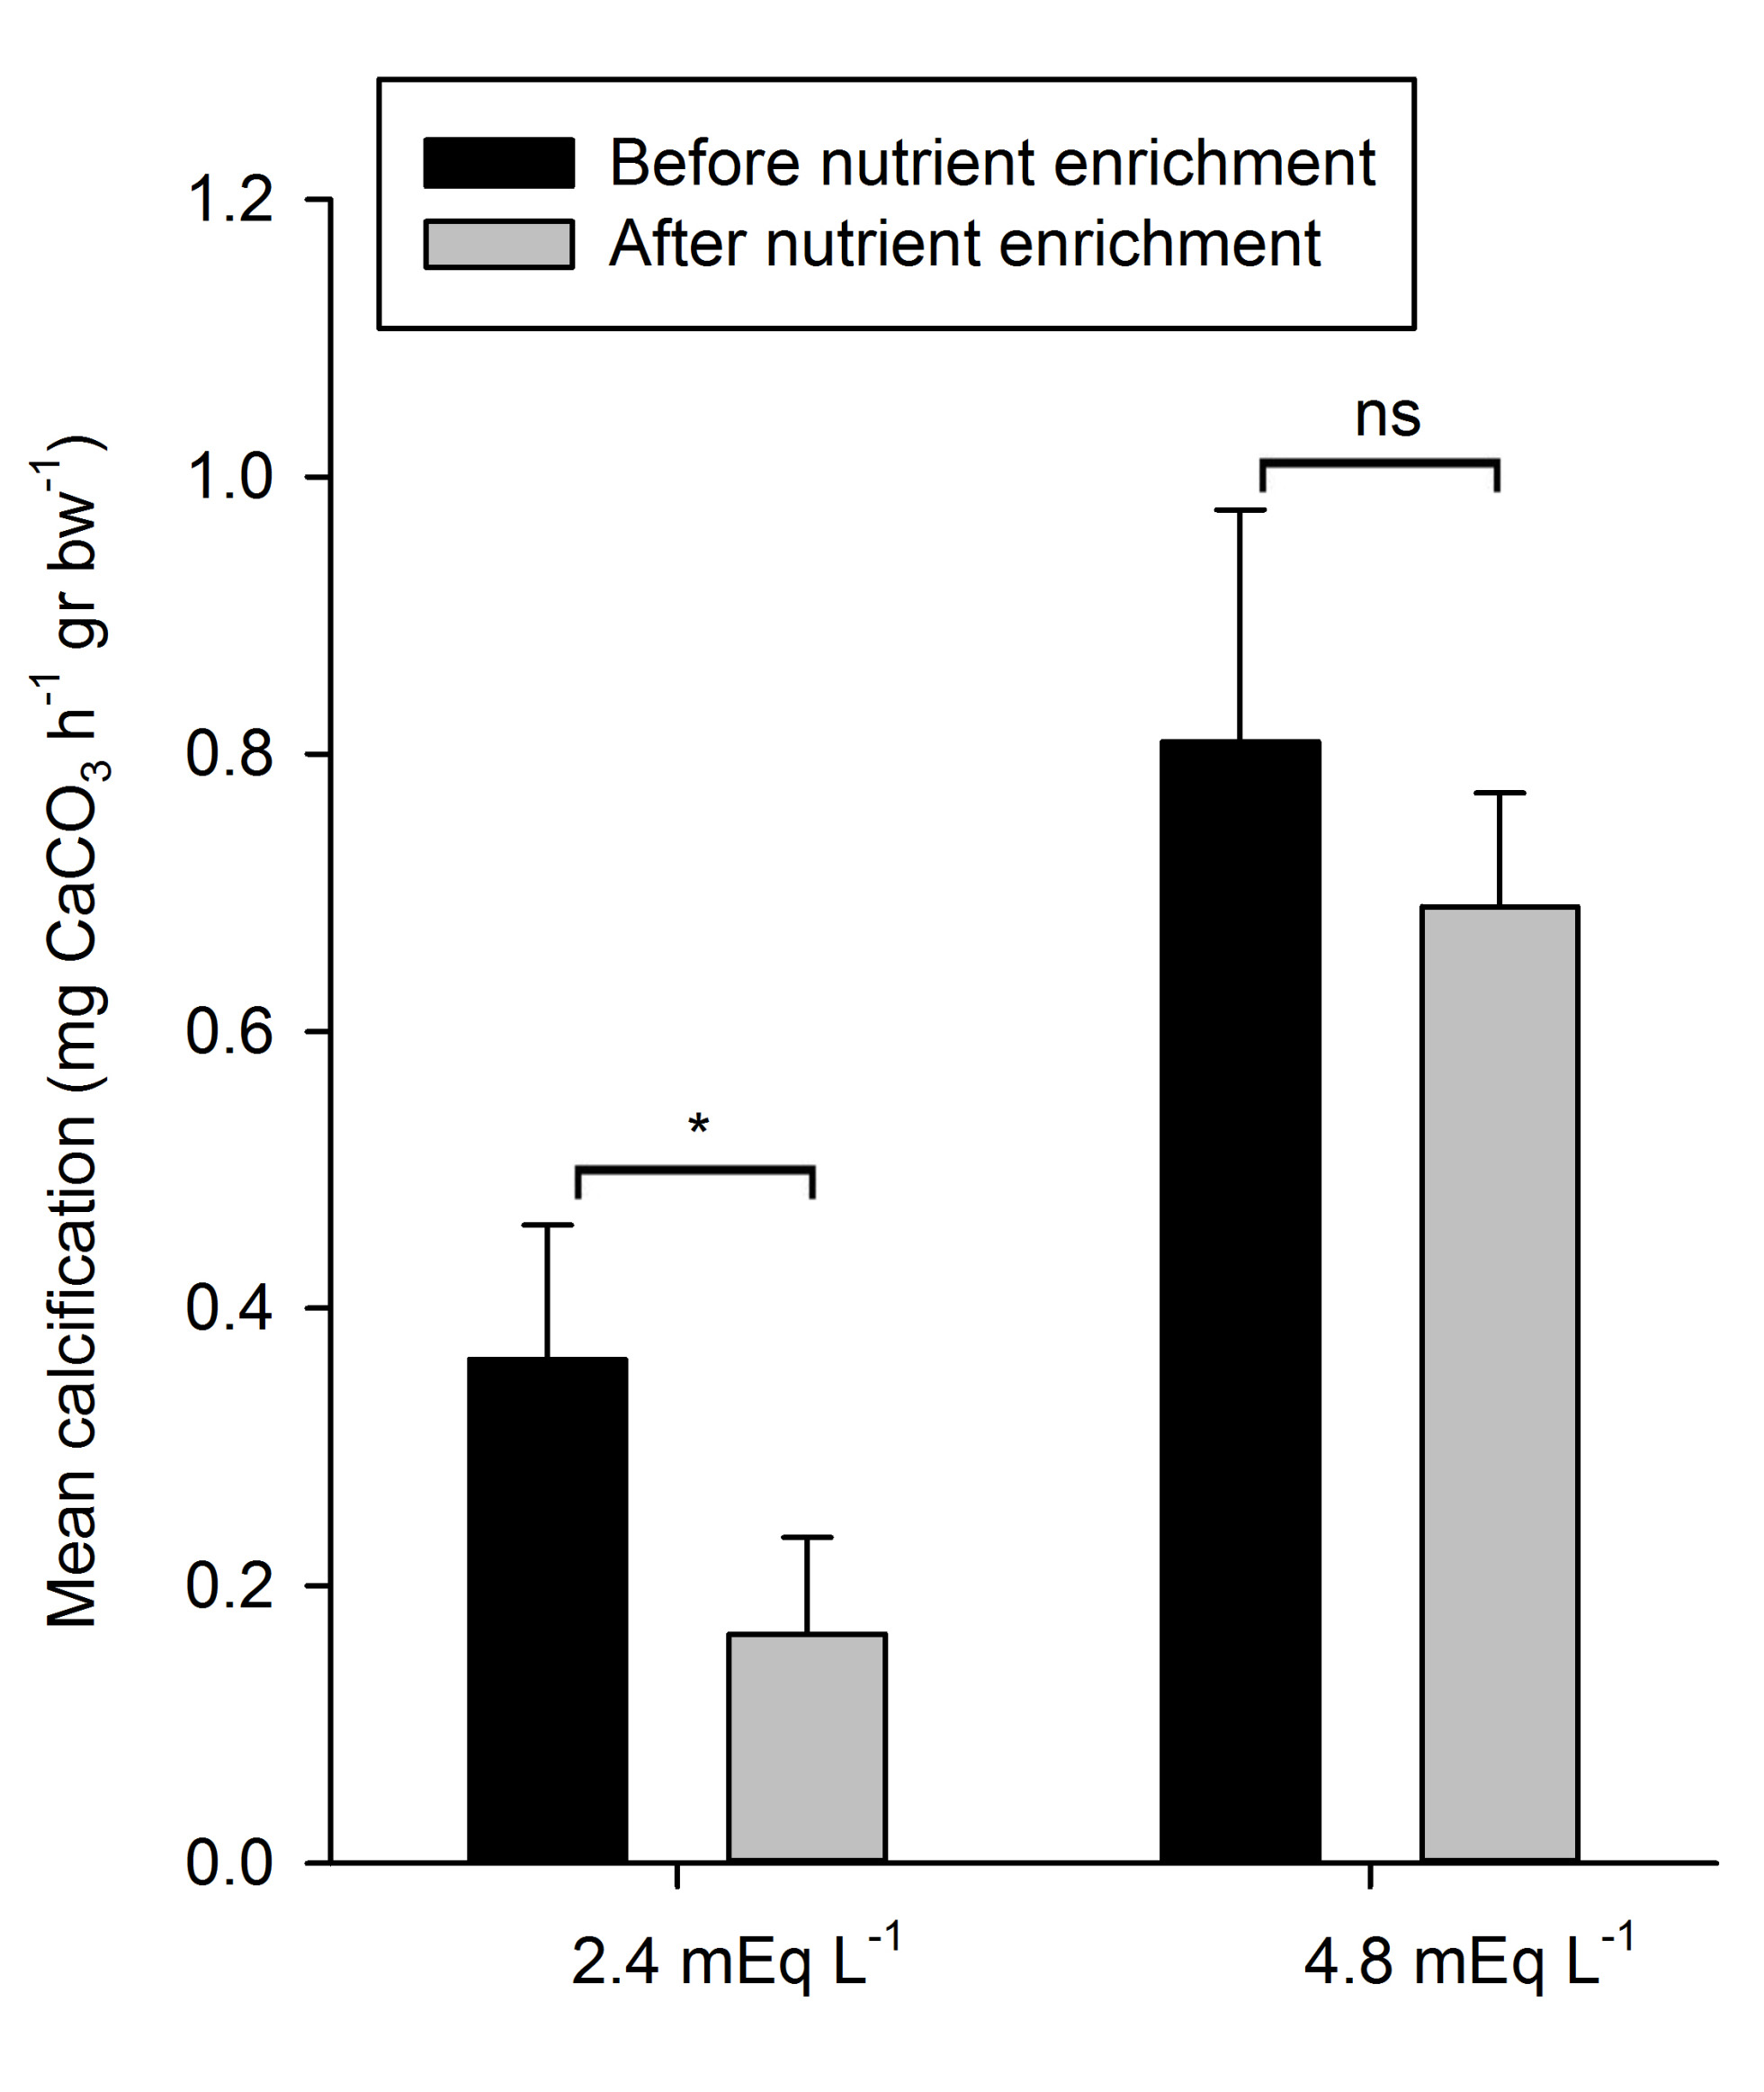
Figure 4: Mean calcification rates (+SD) during exposure to control and +DIC treatments, before and after nutrient enrichment (n=4). *Indicates significantly different means (p < 0.05), ns indicates means which are not significantly different.
Mean calcification rates varied amongst treatments, as can be seen in Figure 4. Mean calcification rates during natural (2.4 mEq L-1) alkalinity treatments, before and after nutrient enrichment, were 0.36 (±0.10 SD) and 0.16 (±0.07 SD) mg CaCO3 h-1 g bw-1, respectively. During high (4.8 mEq L-1) alkalinity treatments, measured rates were considerably higher. Mean calcification rates before nutrient enrichment were 0.81 (±0.17 SD) mg CaCO3 h-1 g bw-1, while after nutrient enrichment mean calcification rates were 0.69 (±0.08 SD) mg CaCO3 h-1 g bw-1.
A significant main effect of DIC on calcification was found (Table 2), with significantly higher mean calcification rates during exposure to 4.8 mEq L-1 compared to 2.4 mEq L-1, irrespective of nutrient enrichment. Further on, there was a significant main effect of nutrient enrichment on calcification (Table 2); calcification rates before nutrient enrichment were significantly higher than after nutrient enrichment.
Nutrient enrichment had no significant interactive effect with DIC on calcification (Table 2). Despite the apparent lack of interaction, calcification rates of the natural alkalinity treatment decreased significantly with 55% after nutrient enrichment (F1,3=21.89, p=0.018), while mean calcification rates of the high alkalinity treatments were not significantly different between nutrient enrichment levels (F1,3=4.36, p=0.128) (Figure 4).
| Factor | F | df | p |
|---|---|---|---|
| Nutrient enrichment | 11.697 | 1 | 0.042* |
| DIC | 249.560 | 1 | 0.001* |
| Nutrient enrichment*DIC | 4.253 | 1 | 0.131 |
| *Indicates a significant effect (p<0.05). | |||
Discussion
Five weeks of exposure to nutrient enrichment resulted in 2.7-fold higher zooxanthellae densities of S. pistillata. This elevation of zooxanthellae density after nutrient enrichment has been observed previously, and in the same order of magnitude [4,9,10,16,17]. In line with previous research [9,10,11,12,13], nutrient enrichment resulted in a 55% decrease in calcification rates, at a natural alkalinity.
Marubini & Thake [19] showed that nitrogen addition resulted in a growth decrease of Porites porites, whereas combined nitrogen and DIC addition did not affect growth adversely, whereupon they concluded that DIC confers protection against nutrient-induced grown inhibition. In the present study, a doubling of the DIC concentration after five weeks of nutrient enrichment resulted in a three- to fourfold increase in calcification rates, and largely negated the impairing effect of nutrient enrichment on growth. This supports the hypothesis that DIC limitation intensifies if the zooxanthellae population increases. Although often suggested [9,10,17,20], this limitation was never investigated using corals with confirmed elevated zooxanthellae densities. Instead of protecting the coral against nutrient enrichment, bicarbonate supplementation relieves the coral from its DIC limitation, thus preventing growth retardation. Thus, DIC addition can not only prevent nutrient-induced inhibition of calcification, but can also restore and greatly enhance coral calcification after long-term exposure to increased nutrient concentrations. The work of Marubini & Thake [20] and the present study show that an intensification of DIC limitation after nutrient enrichment occurs in both P. porites and S. pistillata, suggesting that the mechanism for nutrient-induced growth retardation is consistent among different scleractinian coral species.
Jokiel [31] has suggested that calcification and photosynthesis are spatially segregated in scleractinian corals, as calcification occurs mainly at the almost zooxanthellae-free tips and photosynthesis takes place predominantly at the zooxanthellae-rich colony base. This would prevent a direct competition for DIC between these physiological processes. Therefore, DIC limitation after nutrient enrichment can likely be attributed to competition for this substrate among the zooxanthellae. However, it cannot be excluded that tissue diffusion of DIC (either as bicarbonate or CO2) between the areas of active photosynthesis and calcification takes place, in the same way as theorized for photosynthetic products [32], thus allowing for indirect competition to occur. In addition, the model of Jokiel [31] acknowledges that secondary calcification takes place in areas of high photosynthesis, allowing for direct DIC competition to occur. It remains to be investigated to what extent competition between the host coral and zooxanthellae, and competition amongst zooxanthellae, are responsible for the observed impairment of calcification after nutrient enrichment.
Dunn et al. [33] found that increased phosphorus concentrations negatively affect skeletal density of the scleractinian coral Acropora muricata, possibly due to crystal poisoning of the growing skeletal matrix. This hypothesis is supported by increased P/Ca ratios of Porites skeletons during periods of intense fertilizer application and high particulate phosphorus loads on the Great Barrier Reef [34]. As providing additional DIC as bicarbonate by itself restored and enhanced calcification rates of our corals, it is likely that the impact of crystal poisoning, if any, was limited. Future experiments will have to reveal to what extent DIC limitation and crystal poisoning are responsible for nutrient-driven growth retardation in reef-building corals.
Our results have important implications for coral aquaculture and husbandry. If high alkalinity levels are maintained, coral growth rates can remain high under eutrophic conditions. This is especially relevant for home aquaria, which often experience higher than natural inorganic nutrient levels due to high fish stocking densities.
Acknowledgments
We wish to thank the staff of experimental facility Carus for technical support. This study was funded by the EU Seventh Framework Programme (FP7 2007-2013) under grant agreement no. 244161 (FORCE).
References
- Bryant D, Burke L, McManus JW, Spalding M (1998) Reefs at risk: a map-based indicator of threats to the world’s coral reefs. World Resources Institute: Washington DC.
- Kleypas JA, McManus JW, Menez LAB (1999) Environmental limits to coral reef development: Where do we draw the line? Am Zool 39: 146-159.
- Stambler N (2011) Zooxanthellae: the yellow symbionts inside animals. In: Dubinsky Z, Stambler N, editors. Coral reefs: an ecosystem in transition. Springer, New York, pp 87-106.
- Falkowski PG, Dubinsky Z, Muscatine L, McCloskey L (1993) Population control in symbiotic corals. Bioscience43: 606-611.
- Dubinsky Z, Stambler N (1996) Marine pollution and coral reefs. Glob Chang Biol 2: 511-526.
- Koop K, Booth D, Broadbent A, Brodie J, Bucher D, et al. (2001) ENCORE: the effect of nutrient enrichment on coral reefs. Synthesis of results and conclusions. Mar Pollut Bull 42: 91-120.
- Fabricius KE (2005) Effects of terrestrial runoff on the ecology of corals and coral reefs: review and synthesis. Mar Pollut Bull 50: 125-146.
- D’Angelo C, Wiedenmann J (2014) Impacts of nutrient enrichment on coral reefs: new perspectives and implications for coastal management and reef survival. Curr Opin Environ Sustain, 7, 82-93.
- Stambler N, Popper N, Dubinsky Z, Stimson J (1991) Effects of nutrient enrichment and water motion on the coral Pocillopora damicornis. Pac Sci 45: 299-307.
- Marubini F, Davies PS (1996) Nitrate increases zooxanthellae population density and reduces skeletogenesis in corals. Mar Biol 127: 319-328.
- Ferrier-Pages C, Gattuso JP, Dallot S, Jaubert J (2000) Effect of nutrient enrichment on growth and photosynthesis of the zooxanthellate coral Stylophora pistillata. Coral Reefs 19: 103-113.
- Ferrier-Pagès C, Schoelzke V, Jaubert J, Muscatine L and Hoegh-Guldberg O (2001) Response of a scleractinian coral, Stylophora pistillata, to iron and nitrate enrichment. J Exp Mar Bio Ecol 259: 249-261.
- Renegar DA, Riegl BM (2005) Effect of nutrient enrichment and elevated CO2 partial pressure on growth rate of Atlantic scleractinian coral Acropora cervicornis. Mar Ecol Prog Ser 293: 69-76.
- Hoegh-Guldberg O, Takabayashi M, Moreno G (1997) The impact of long-term nutrient enrichment on coral calcification and growth. Proc. 8th Int. Coral Reef Symp. 1: 861-866.
- Bucher DJ, Harrison PL (2002) Growth response of the reef coral Acropora longicyathus to elevated inorganic nutrients: Do responses to nutrients vary among coral taxa?Proc 9th Int Coral Reef Symp 1: 443-448.
- Muscatine L, Falkowski PG, Dubinsky Z, Cook PA, McCloskey LR (1989) The effect of external nutrient resources on the population dynamics of zooxanthellae in a reef coral. Proc R Soc Lond B Biol Sci 236: 311-324.
- Dubinsky Z, Stambler N, Ben-Zion M, McCloskey LR, Muscatine L, et al. (1990) The effect of external nutrient resources on the optical properties and photosynthetic efficiency of Stylophora pistillata. Proc R Soc Lond B Biol Sci 239: 231-246.
- Tanaka Y, Miyajima T, Koike I, Hayashibara T, Ogawa H (2007) Imbalanced coral growth between organic tissue and carbonate skeleton caused by nutrient enrichment. Limnol Oceanogr 52: 1139-1146.
- Allemand D, Ferrier-Pagès C, Furla P, Houlbrèque F, Puverel S, et al. (2004) Biomineralisation in reef-building corals: from molecular mechanisms to environmental control. C R Palevol3: 453-467.
- Marubini F, Thake B (1999) Bicarbonate addition promotes coral growth. Limnol Oceanogr 44: 716-720.
- Smith S, Kinsey D (1978) Calcification and organic carbon metabolism as indicated by carbon dioxide. Coral reefs: research methods 5: 469-484.
- Wijgerde T, Jurriaans S, Hoofd M, Verreth JAJ, Osinga R (2012) Oxygen and Heterotrophy Affect Calcification of the Scleractinian Coral Galaxea fascicularis. PLoS ONE 7(12): e52702. doi:10.1371/journal.pone.0052702
- Brewer PG, Goldman JC (1976) Alkalinity changes generated by phytoplankton growth. Limnol Oceanogr 21: 108-117.
- Kleypas JA, Langdon C (2006) Coral reefs and changing seawater carbonate chemistry. Coast Estuar Stud 61: 73-110.
- Osinga R, Schutter M, Griffioen B, Wijffels RH, Verreth JAJ, et al. (2011) The Biology and Economics of Coral Growth. Mar Biotechnol 13: 658-671.
- Wijgerde T, van Melis A, Silva CIF, Leal MC, Vogels L, et al. (2014) Red Light Represses the Photophysiology of the Scleractinian Coral Stylophora pistillata. PLoS ONE 9(3): e92781. doi:10.1371/journal.pone.0092781
- Wijgerde T, Silva CI, Scherders V, van Bleijswijk J, Osinga R (2014) Coral calcification under daily oxygen saturation and pH dynamics reveals the important role of oxygen. Biology open, doi: 10.1242/bio.20147922
- Schutter M, van der Ven RM, Janse M, Verreth JAJ, Wijffels RH, et al. (2011). Light intensity, photoperiod duration, daily light flux and coral growth of Galaxea fascicularis in an aquarium setting: a matter of photons?. J Mar Biol Assoc U.K. 1: 1-10.
- Herfort L, Thake B, Taubner I (2008) Bicarbonate stimulation of calcification and photosynthesis in two hermatypic corals. J Phycol 44: 91-98.
- Marubini F, Ferrier-Pages C, Furla P, Allemand D (2008) Coral calcification responds to seawater acidification: a working hypothesis towards a physiological mechanism. Coral Reefs 27: 491-499.
- Jokiel, PL (2011) The reef coral two compartment proton flux model: A new approach relating tissue-level physiological processes to gross corallum morphology. J Exp Mar Bio Ecol409:1-12.
- Fang LS, Chen, YWJ, Chen, CS (1989). Why does the white tip of stony coral grow so fast without zooxanthellae? Mar Biol 103: 359-363.
- Dunn JG, Sammarco PW, LaFleur G (2012). Effects of phosphate on growth and skeletal density in the scleractinian coral Acropora muricata: A controlled experimental approach. J Exp Mar Bio Ecol411: 34 -44.
- Mallela J, Lewis SE, Croke B (2013). Coral Skeletons Provide Historical Evidence of Phosphorus Runoff on the Great Barrier Reef. PLoS ONE 8(9): e75663. doi:10.1371/journal.pone.0075663

0 Comments