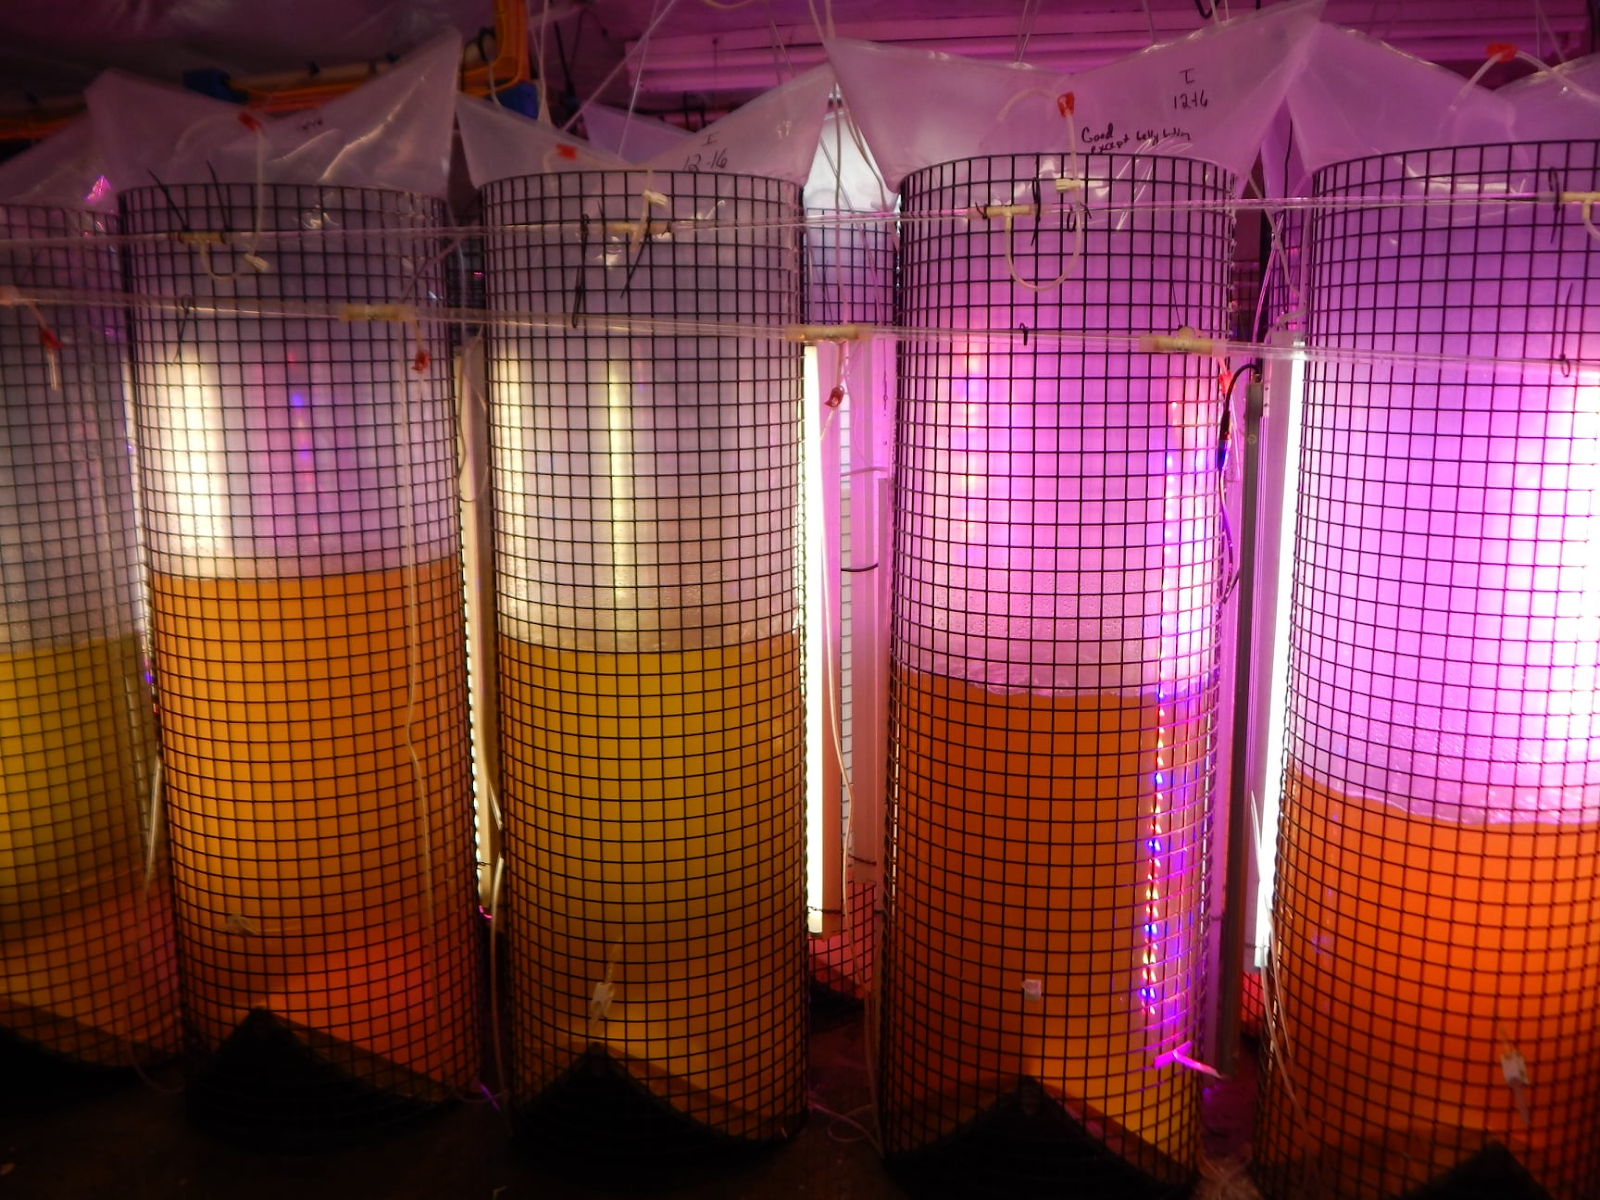
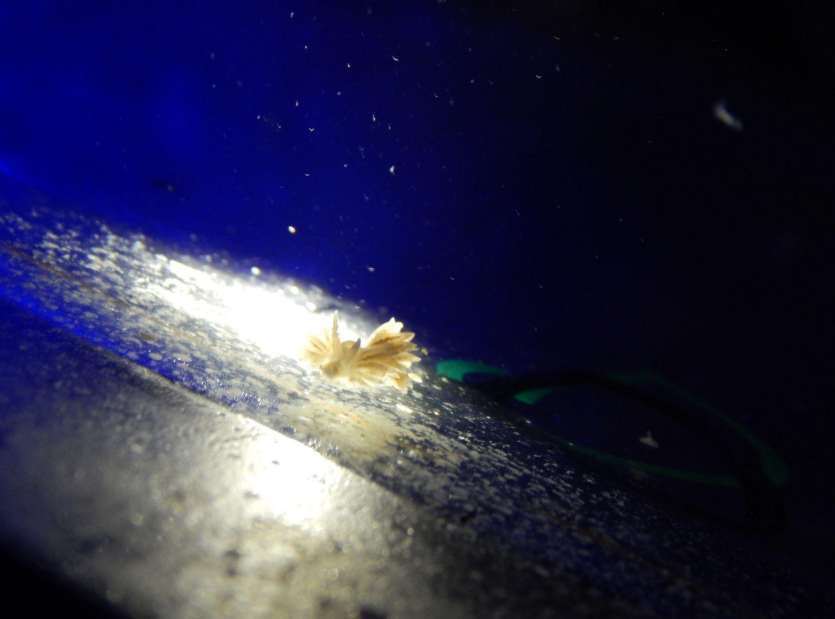
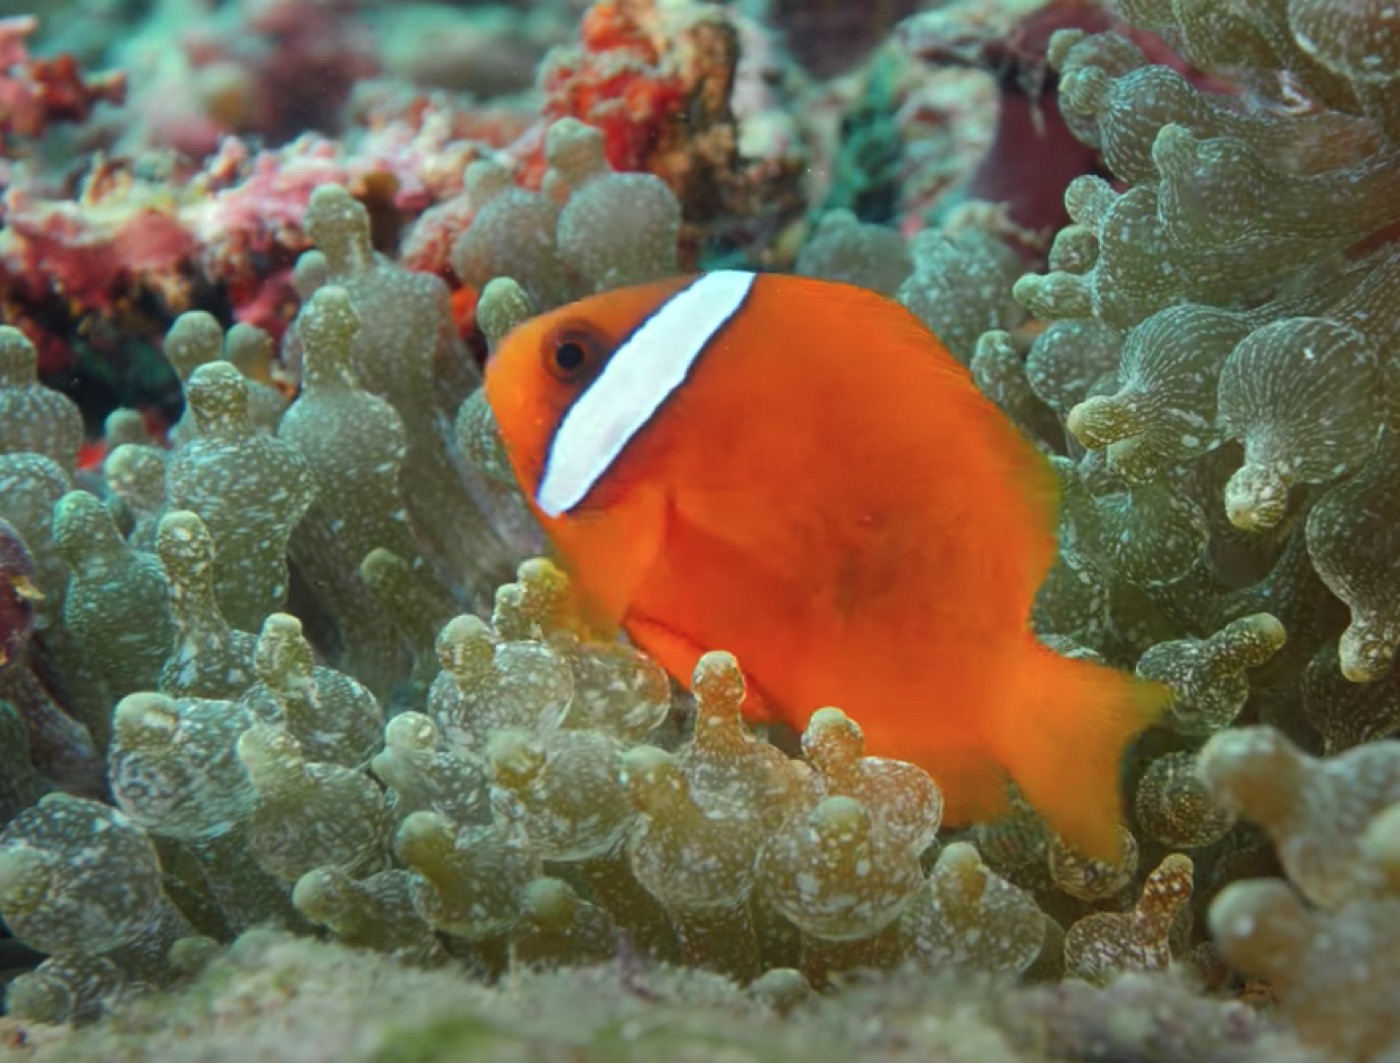
<?xml version="1.0" encoding="utf-8" ?>
<rdf:RDF xmlns:rdf="http://www.w3.org/1999/02/22-rdf-syntax-ns#" xmlns:dc="http://purl.org/dc/elements/1.1/" xmlns:syn="http://purl.org/rss/1.0/modules/syndication/" xmlns="http://purl.org/rss/1.0/">


<channel rdf:about="http://www.advancedaquarist.com/sort/chemistry/RSS">
  <title>Aquarium Chemistry</title>
  <link>http://www.advancedaquarist.com</link>

  <description>
    
      Below is a listing of all of our articles about aquarium chemistry issues sorted by date with the newest at the top of the list.
    
  </description>


            <syn:updatePeriod>daily</syn:updatePeriod>
            <syn:updateFrequency>1</syn:updateFrequency>
            <syn:updateBase>2009-05-02T07:30:56Z</syn:updateBase>
        

  <image rdf:resource="http://www.advancedaquarist.com/logo.png"/>

  <items>
    <rdf:Seq>
      
        <rdf:li rdf:resource="http://www.advancedaquarist.com/2013/2/fish"/>
      
      
        <rdf:li rdf:resource="http://www.advancedaquarist.com/2012/6/chemistry"/>
      
      
        <rdf:li rdf:resource="http://www.advancedaquarist.com/2012/4/review"/>
      
      
        <rdf:li rdf:resource="http://www.advancedaquarist.com/2012/3/chemistry"/>
      
      
        <rdf:li rdf:resource="http://www.advancedaquarist.com/2012/3/aafeature"/>
      
      
        <rdf:li rdf:resource="http://www.advancedaquarist.com/2012/2/chemistry"/>
      
      
        <rdf:li rdf:resource="http://www.advancedaquarist.com/2011/10/chemistry"/>
      
      
        <rdf:li rdf:resource="http://www.advancedaquarist.com/2011/9/podcast"/>
      
      
        <rdf:li rdf:resource="http://www.advancedaquarist.com/2011/8/review"/>
      
      
        <rdf:li rdf:resource="http://www.advancedaquarist.com/2011/8/podcast"/>
      
      
        <rdf:li rdf:resource="http://www.advancedaquarist.com/2011/7/aafeature"/>
      
      
        <rdf:li rdf:resource="http://www.advancedaquarist.com/2011/6/review"/>
      
      
        <rdf:li rdf:resource="http://www.advancedaquarist.com/2011/4/chemistry"/>
      
      
        <rdf:li rdf:resource="http://www.advancedaquarist.com/2011/3/aafeature"/>
      
      
        <rdf:li rdf:resource="http://www.advancedaquarist.com/2010/10/chemistry"/>
      
    </rdf:Seq>
  </items>

</channel>


  <item rdf:about="http://www.advancedaquarist.com/2013/2/fish">
    <title>Aquarium Fish: Chloroquine: A "New" Drug for Treating Fish Diseases</title>
    <link>http://www.advancedaquarist.com/2013/2/fish</link>
    <description>While not a panacea or miracle drug, chloroquine is experiencing resurgence in popularity for use in fish-only aquariums and quarantine systems to treat a variety of problems ranging from Cryptocaryon to Aiptasia anemone infestations.</description>
    <content:encoded xmlns:content="http://purl.org/rss/1.0/modules/content/"><![CDATA[<p><em><strong>Click through to see the images.</strong></em></p> <br /><div id="body">
<p><img src="fish_album/Chloroquine2.jpg" alt="Chloroquine2.jpg" class="image-inline" /></p>
<p><span class="dropcap">I</span>n early the 1970's, when I was just 13 or so, <i>Cryptocaryon irritans</i> ("marine ich") and <i>Amyloodinium</i> <i>ocellatum</i> ("marine velvet") were a bit less of a problem for my fish than they are now when I quarantine new fish as an aquarium curator. The reason was a product called Marex from the Aquatronics Corporation (they have long ceased operations). Marex was sort of a wonder drug for us back then - simply adding a single $1.99 dose protected the fish in a 50 gallon aquarium from many diseases plus it killed the unsightly algae that grew all over the tank decorations back in those days! When the company went out of business I moved on to using other products. For the past 25 years, I've been using ionic copper measured with a spectrophotometer twice a day to control marine ich and other protozoan diseases. Copper is slow to affect a cure, and the difference between a therapeutic dose and a dose harmful to some fish species is slight. Still, it seemed to be the best method for quarantining or treating active diseases in fish. Thinking back to when I was a youngster, I did some research and discovered that the active ingredient in Marex was chloroquine, and I was familiar with that drug as it was being used by other public aquariums. Acquiring some myself five years ago, I've begun incorporating it into my arsenal of aquarium fish disease treatments. A few home aquarists have begun re-exploring its uses as well, often calling it by the shorthand name of "CP" which stands for chloroquine phosphate. This article provides those aquarists with additional background information to enable them to be better able to use this "new" drug if they wish - having options is always a good.</p>
<div class="photo-wrapper"><a class="popup" href="fish_album/green_chromis.jpg" rel="gallery" title="Green chromis with Uronema infection that might have responded to chloroquine if treatment was started soon enough."><img src="fish_album/green_chromis.jpg/image_full" alt="green_chromis.jpg" class="image-inline" /></a>
<p class="caption">Green chromis with Uronema infection that might have responded to chloroquine if treatment was started soon enough.</p>
</div>
<h2></h2>
<h2>Chemical properties</h2>
<p>Chloroquine was developed for human medicine in the 1930's at Bayer laboratories. It was first thought to be too toxic for any practical use, but decades later, it was shown in clinical trials to have significant value as an anti-malarial drug. However, its subsequent wide-spread use allowed the malaria disease organism to become resistant to it, requiring the development of other treatments.</p>
<p>There are at least three forms of the drug available:</p>
<p>Chloroquine diphosphate (Aralen): C<sub>18</sub>H<sub>26</sub>ClN<sub>3</sub> <sup>.</sup> 2H<sub>3</sub>PO<sub>4</sub></p>
<p>Chloroquine hydrochloride (Aralen HCL): C<sub>18</sub>H<sub>26</sub>ClN<sub>3</sub> <sup>.</sup> 2HCl</p>
<p>Chloroquine sulfate (Plaquenil): C<sub>18</sub>H<sub>26</sub>ClN<sub>3</sub> <sup>.</sup> H<sub>2</sub>O<sub>4</sub>S</p>
<p>The Chloroquine base also goes by the name; 7-chloro-4-[[4- (diethylamino)-1-methylbutyl]amino] quinolone. The most commonly available version of the drug for aquarium use is the diphosphate salt. This compound is a fine white fine powder that is readily soluble in water. In dry environments it seems to build up a static charge, and the granules tend to become airborne and then stick to nearby objects. This can create problems when weighing out small amounts of the drug, as it tends to stick to the storage container, the weighing pan as well as nearby objects. Always dissolve the prescribed amount of chloroquine in distilled water before adding it to an aquarium.</p>
<p>English pronunciation of the compound varies between "KLOR-oh-kwin" and "Klor-oh-KWEEN", with the former used by most aquarists, while the latter is listed on some word pronunciation web sites.</p>
<h2></h2>
<h2>Uses and dosages</h2>
<p>Chloroquine is typically dosed at a rate of 10 to 20 milligrams per liter (mg/l), with 15 mg/l being considered a "standard dose" (Hemdal 2006). Note: in most instances, solutions measured in "milligrams per liter" are equivalent to "parts per million" or ppm.</p>
<p>The 10 mg/l dose should be used as a quarantine preventative (not for active diseases), or for treating delicate species (although little is known about the sensitivity of different fish species to this medication). A dose of 15 mg/l is considered the normal dose for treating most protozoan infections, while the 20 mg/l dose would be reserved for attempting to eradicate difficult-to-treat <i>Uronema marinum</i> infections.</p>
<div class="photo-wrapper"><a class="popup" href="fish_album/hach_dr5000_uv_spec.jpg" rel="gallery" title="Hach DR5000 UV spectrophotometer with non-UV DR-2000 on the right."><img src="fish_album/hach_dr5000_uv_spec.jpg/image_full" alt="hach_dr5000_uv_spec.jpg" class="image-inline" /></a>
<p class="caption">Hach DR5000 UV spectrophotometer with non-UV DR-2000 on the right.</p>
</div>
<p>The first step in preparing to use any drug that will be added to an aquarium at a specific dose is to determine the true water volume of the aquarium. This is often less than an aquarium's advertised volume (or it could be more if there is a sump attached to the system). The most accurate means to determine the volume of an aquarium system is to measure the amount of water it takes to fill the total system, with all decorations in place. As this is usually not possible to do except when the aquarium is first filled, the following method will give accurate enough results in most instances (this method uses US volume measurements combined with metric dosages):</p>
<ul>
<li class="ListParagraph">Measure (in inches) the length, width and height of the water inside the aquarium from the top of the gravel layer to the water's surface, and inside the glass front to back and side to side. Multiple these three numbers to get the gross volume in cubic inches and then divide by 231 to determine the volume in gallons (there are 231 cubic inches in a US gallon).</li>
<li class="ListParagraph">Deduct an estimated percentage for tank decorations. If you are unsure, the decorations in a typical marine aquarium with artificial coral and rock displace about 15% of the water volume, so you would multiply the gross volume from step 1 by 0.85</li>
<li class="ListParagraph">Use the same technique to measure the volume of the gravel layer (if any), but multiply the result by 0.30, as only about 30% of the gravel layer is water, the rest of the volume is the gravel itself.</li>
<li class="ListParagraph">Use the same technique to measure the volume of the sump (if any).</li>
<li class="ListParagraph">Except for very large systems, the amount of water contained in the filtration system is inconsequential, but you might want to add a couple of gallons to the estimate if the tank uses a large canister filter.</li>
<li class="ListParagraph">Add these measurements together to arrive at the estimated net aquarium volume in gallons.</li>
<li class="ListParagraph">Once you have estimated the aquarium system volume, multiply the number of gallons by the target dose of the drug (in mg/l or parts per million). Dividing this by 266 will give the number of grams of medication that needs to be added to the water.</li>
<li class="ListParagraph">Always run these calculations TWICE to ensure accuracy. If you arrive at different numbers, stop and determine where the mistake was made.</li>
</ul>
<p> </p>
<p>One grave issue when dosing medications occurs if a decimal place is lost through an error in calculation. This can result in a dose many times higher or lower than is called for. Aquarists who are not familiar with using a particular drug may not realize that the dose they have calculated is so far off. For a frame of reference, to dose 100 net gallons of aquarium water with chloroquine at 15 mg/l, you would add 5.6 grams of the drug (100 gal. * 15 mg/l / 266 = 5.639, which rounds down to 5.6 grams of chloroquine).</p>
<p>Home aquarists may have difficulty in measuring minute amounts of a drug to treat small tanks. Avoid guessing or trying to use volume measurements for these weights. Small electronic balances are available for relatively low cost, but may not have sufficient resolution to measure amounts of a drug in the milligram range. One trick to improve accuracy of a measurement is to make a stock solution, and then use a small quantity of that to dose the tank. The reason this works well is that home aquarists generally can measure small volumes of a liquid easier than they can weigh small amounts of a powder. For example, if you need to treat a 10 gallon aquarium with chloroquine at 10 mg/l, you would need to add 376 mg of the drug to the tank, a very small amount to try and weigh out. If you can more easily weigh out a single gram (a nice round amount), you can dissolve that into 12 teaspoons of distilled water, and then add 4 ½ teaspoon of that solution to the 10 gallon tank. For increased accuracy, you can buy a volumetric medicine dosing spoon. These can be used much like a graduated cylinder for measuring accurate amounts of a stock solution. For this example, you would add one gram of chloroquine to 100 milliliters of distilled water, and then add 37.6 ml of that stock solution to the aquarium.</p>
<div class="photo-wrapper"><a class="popup" href="fish_album/simple_measuring_spoons.jpg" rel="gallery" title="Simple measuring spoons can be used to dose a chloroquine stock solution for smaller aquariums."><img src="fish_album/simple_measuring_spoons.jpg/image_full" alt="simple_measuring_spoons.jpg" class="image-inline" /></a>
<p class="caption">Simple measuring spoons can be used to dose a chloroquine stock solution for smaller aquariums.</p>
</div>
<p>Why the concern about such an accurate dosage when chloroquine has a plus or minus 33% margin of error when using the 15 mg/l dose? The reason is that there are two primary chances for error; in the tank volume calculation and when weighing of the drug itself. Two small errors may more or less cancel each other out, but if the errors are in the same direction, they are additive or subtractive and the dose you add to the aquarium could then be outside reasonable limits.</p>
<p>In addition to controlling protozoan parasites, chloroquine also has some use in eradicating certain metazoan (multi-celled) fish parasites. The Georgia Aquarium has used it to control turbellarian worm infestations at a dose of only 10 mg/l (Tonya Claus, personal communication). These worms have been shown to be resistant to treatment with Praziquantel and formalin, so an alternative treatment such as this is much needed.</p>
<p>A single dose of chloroquine at 15 mg/l was found to be effective at eradicating <i>Aiptasia</i> sp. glass anemones within 48 hours. In one test, no reinfestation of these pest anemones was seen in two months following treatment (personal observation). However, this method cannot be used in aquariums housing other invertebrates as this dose also eradicated algae and sponges that were growing alongside the <i>Aiptasia</i> sp. anemones.</p>
<p>In an effort to isolate the drug from sensitive invertebrates, some aquarists have administered the drug orally to their fish. Chloroquine is very bitter, and if the drug isn't masked by strong flavors in the food used to bind it with, fish will soon learn to avoid it. In addition, for oral medications to work, the fish still needs to be feeding normally, and acutely ill fish often refuse to feed. Finally, dosage is very difficult to control in oral medication for aquarium fishes. The drug must be mixed into a gelatin food binder at 6 to 10 milligrams of drug per gram of food, and then that has to be fed to the fish at a rate of around 3% of its body weight per day - and few, if any aquarists know the actual weight of their fishes.</p>
<p>Activated carbon has been widely reported to remove chloroquine from aquarium water at the conclusion of a treatment, but be aware that carbon has been implicated in the development of head and lateral line erosion in marine surgeonfish (Hemdal &amp; Odum 2011). If you do decide to use carbon to remove chloroquine, it would be advisable to use a premium pelleted carbon, rinse it well with deionized water prior to use, and remove all of the carbon when finished. The amount of carbon needed to remove all of the chloroquine will be a guess. A starting point would be 4 to 6 grams of well-rinsed carbon per gallon of aquarium water, placed in a fine mesh bag and added to the aquarium's power filter for 48 hours. If the aquarium will be using delicate invertebrates at the conclusion of the treatment, it would be more prudent to change all of the water first.</p>
<p>There is no test kit to measure the chloroquine concentration in water as there is for many copper medications. Public aquariums and laboratories with access to a UV spectrophotometer can use it to measure chloroquine in the water directly. How this works is that at 329 nm, chloroquine in water absorbs ultraviolet light in proportion to its concentration. Using a quartz cuvette that is transparent to UV, a blank sample of untreated water is first measured. Then, a sample of that water is dosed with a serial dilution of chloroquine in the range to be treated, typically 2.5, 5, 10, 20 and 25 mg/l and the percent transmittance is measured for each sample. Once this standard trend line is graphed, the chloroquine concentration of any water sample within that range can be measured. Because other organic compounds can be present in aquarium water that may also absorb UV light, it is best to create a standard curve for each water system prior to treatment.</p>
<p>In one test attempting to measure the ability of carbon to remove chloroquine, a spiked sample actually showed an increase in absorbance at 329 nm after filtering through carbon for 24 hours. Since the chloroquine level couldn't have risen, it is presumed that something in the carbon dissolved into the water and that obscured the reading. However, this also made it impossible to determine if the carbon actually removed any of the chloroquine, so this aspect remains open to questioning. In a second test, 20 mg of chloroquine was dissolved in a liter of distilled water. This sample was then exposed to 4 g of rinsed activated carbon for a week. Measured at 329 nm, the sample only dropped by a calculated 5 mg/l chloroquine according to the standard curve. Since something in the carbon seems to be obscuring any chloroquine measurements, it is difficult to understand how any of the reports that carbon removes chloroquine could have been substantiated, at least by using a UV spectrophotometer.</p>
<div class="photo-wrapper"><a class="popup" href="fish_album/image001.png" rel="gallery" title="An example of four serial dilutions of chloroquine measured on a Hach UV spectrophotometer. The results are % absorbance (the inverse of the % transmittance) at 329 nm. The linear trend line can be used in subsequent tests to measure the amount of chloroquine in aquarium water."><img src="fish_album/image001.png/image_full" alt="image001.png" class="image-inline" /></a>
<p class="caption">An example of four serial dilutions of chloroquine measured on a Hach UV spectrophotometer. The results are % absorbance (the inverse of the % transmittance) at 329 nm. The linear trend line can be used in subsequent tests to measure the amount of chloroquine in aquarium water.</p>
</div>
<h2>Preliminary <i>in vitro</i> study</h2>
<p>Two very basic qualitative <i>in vitro</i> tests were conducted to test the efficacy of chloroquine phosphate as a potential treatment against the ciliate <i>Uronema marinum</i> (Hemdal 2010). <i>Uronema</i> is a fairly common ciliate that is difficult to treat as these parasites can burrow into the fish's skin and therefore isolate themselves from many external bath treatments such as formalin, copper and hyposalinity. These informal tests show that this drug is effective at killing <i>Uronema</i> when it is used as a bath, but it is unknown if enough of the drug would taken up by the fish in order to raise the level in the blood to therapeutic levels.</p>
<p>In the first test, the body of a small parrotfish fish that had succumbed to a <i>Uronema</i> infection was cut in half. One section of the fish was placed in tank water, the second section was placed in tank water dosed with Chloroquine at 40 mg/l (a higher than normal dose). After six hours, the number of Uronema in the treated sample had been markedly reduced, while the numbers in the untreated sample had actually increased.</p>
<p>In a second test, the bodies of two green chromis that had died from acute <i>Uronema</i> infections were exposed to chloroquine at 35 mg/l. A marked reduction of the numbers of the ciliate was seen within three hours, and only one surviving <i>Uronema</i> was seen on the body of one of the fish after eight hours. Using deceased fish for these bio-assays is problematic in that there is difficulty obtaining specimens "as-needed" and room temperature tests longer than 24 hours cannot be performed as the fish flesh begins to putrefy.</p>
<h2></h2>
<h2>Contraindications</h2>
<p>At doses typically used to treat fish diseases, chloroquine is also toxic to many invertebrates, algae and bacteria. Seriously high ammonia levels ( &gt; 1 mg/l NH<sub>3</sub>) are sometimes seen a few days to a week after dosing an aquarium with chloroquine. It is unknown why this is seen in some aquariums but not others. One hypothesis is that the chloroquine has a direct antibiotic effect on the nitrifying bacteria. Another idea is that the chloroquine kills so much microscopic life in the aquarium that the beneficial bacteria are overwhelmed, and an ammonia spike develops. Most likely, it is a combination of both of these factors causing this issue. Always monitor the ammonia levels in aquariums during treatment with chloroquine. Freshwater aquariums should also be monitored for subsequent rise in nitrite levels as well.</p>
<p>Ultraviolet light seems to alter the chemical make-up of chloroquine in water. This is particularly a concern when UV sterilizers are employed. The UV light causes changes in the chloroquine that can turn the aquarium water a murky brown (Tiffany Adams, Shedd Aquarium, personal communication). The presumption is that the effect of the drug is also altered, so UV sterilizers (and probably ozone generators) must be turned off during treatment. Some aquarists go to the extreme of blocking all light entering the aquarium during treatment, but this is not necessary unless the aquarium is open to natural sunlight.</p>
<p>As mentioned, the use of chloroquine to treat malaria in humans has long been known to lose effectiveness as the Plasmodium protist that causes the disease developed a resistance to the drug. Purely speculation, but the same mechanism could cause resistance to aquarium disease-causing protists as well. If this problem ever develops, it will most likely appear in public aquariums or fish importers as they use the drug repeatedly in the same centrally filtered systems. Home aquarists are unlikely to administer the high number of treatments required to cause such a resistance to develop. <br /> The Material Safety Data Sheet (MSDS) for chloroquine phosphate is difficult to interpret. Much of the toxicity data listed were derived from chronic exposure in humans taking the drug for control of malaria; retinal damage, nervous system disruption, and liver damage. Acute exposure of the amounts typically used in home aquariums can cause irritation to the eyes and respiratory tract. Always use gloves, eye protection and a dust mask when handling this material, and keep it away from children and pets.</p>
<h2></h2>
<h2><span class="c1">The Phosphate Connection</span></h2>
<p>Most, if not all of the chloroquine available for aquarium use is in the form of chloroquine diphosphate (as opposed to chloroquine hydrochloride or sulfate). This means that dosing an aquarium with this drug will also add some phosphate (PO<sub>4</sub>) to the water when the compound dissociates as it dissolves. Theoretically, using the molecular weights of its components, chloroquine will release about 20% of its weight as PO<sub>4</sub> . This means that for a typical 20 mg/l dose of chloroquine, one would expect the phosphate level in the aquarium to rise by around 4 mg/l. Empirically, a series of tests on chloroquine at 20 mg/l in distilled water resulted in a concurrent rise in PO<sub>4</sub> of 4 to 6.1 mg/l, a bit higher than expected*. A rule of thumb might be that for any dose of chloroquine, you could expect to see a rise in phosphate levels of around 20 to 30% of the total dose of chloroquine. Therefore, a single dose of chloroquine at 10 mg/l would increase the PO<sub>4</sub> concentration in the water by about 2 to 3 mg/l. This is would be a major concern in reef aquaria, but as chloroquine is typically used in fish-only aquariums, or quarantine systems, the residual phosphate is less of an issue and can be reduced by water changes.</p>
<p><i>*Please note that phosphate is difficult to measure, even using a spectrophotometer, and there was a large variation in the measurements taken in these tests, with no real explanation.</i></p>
<h2></h2>
<h2>Availability</h2>
<p>The current major drawback to using chloroquine to treat fish diseases is locating a commercial source of the drug. Public aquariums, buying large quantities, have no difficulty in acquiring it from online companies at around $185 per kilogram. Hobbyists, needing much less of the drug, have not been able to find it easily available in lesser amounts - but that should be changing, now that its use has become more popular again. Until an aquarium manufacturer starts marketing it again, you may be able to acquire it from your veterinarian, or perhaps go in for a "group buy" with other hobbyists. Recent online prices for non-prescription chloroquine vary depending on the amount purchased from .185 cents per gram up to $2.40 per gram. One gram of chloroquine will dose 18 gallons of water at 15 mg/l.</p>
<h2></h2>
<h2>Conclusion</h2>
<p>While not a panacea or miracle drug, chloroquine is experiencing resurgence in popularity for use in fish-only aquariums and quarantine systems to treat a variety of problems ranging from <i>Cryptocaryon</i> to <i>Aiptasia</i> anemone infestations. Chloroquine remains active in aquariums for many weeks, seems to have low toxicity to fish and may be removed using activated carbon. In critical applications, treatment levels can be measured with a UV spectrophotometer, and the dose adjusted accordingly.</p>
<h2></h2>
<h2>References</h2>
<ol>
<li>Hemdal, J.F. Odum, R.A. 2011. The Role of Activated Lignite Carbon in the Development of Head and Lateral Line Erosion in the Ocean Surgeonfish. North American Journal of Aquaculture 73:4, 489-492</li>
<li>Hemdal, J.F. 2010. Red Band Syndrome. Aquarium Fish International 22(1):26-30</li>
<li>-- 2009. Mortality Rates of Fishes in Captivity. Advanced Aquarist's Online Magazine. 8(12): <a href="http://www.advancedaquarist.com/2009/12/fish2">http://www.advancedaquarist.com/2009/12/fish2</a></li>
<li>-- 2006. Advanced Marine Aquarium Techniques. 352pp. TFH publications, Neptune City, New Jersey</li>
</ol></div> <br /><br /> <script type="text/javascript"><!-- google_ad_client = "ca-pub-5170032844807535"; /* Square250x250 */ google_ad_slot = "6862474606"; google_ad_width = 250; google_ad_height = 250; //--></script><script type="text/javascript" src="http://pagead2.googlesyndication.com/pagead/show_ads.js"></script>]]></content:encoded>
    <dc:publisher>No publisher</dc:publisher>
    
    <dc:creator>Jay Hemdal</dc:creator>
    <dc:rights>Pomacanthus Publications, Inc.</dc:rights>
    
      <dc:subject>Fish</dc:subject>
    
    
      <dc:subject>Medication</dc:subject>
    
    
      <dc:subject>Aquarium Fish</dc:subject>
    
    
      <dc:subject>Jay Hemdal</dc:subject>
    
    <dc:date>2013-02-20T16:00:00Z</dc:date>
    <dc:type>Page</dc:type>
  </item>


  <item rdf:about="http://www.advancedaquarist.com/2012/6/chemistry">
    <title>Aquarium Chemistry: An Attempt to Test Test Kits</title>
    <link>http://www.advancedaquarist.com/2012/6/chemistry</link>
    <description>James Fatherree and Dr. David Flanigan asked hobbyists to test samples of the same water with multiple test kits.  The results were interesting, with important lessons learned for both hobbyists and testing manufacturers.</description>
    <content:encoded xmlns:content="http://purl.org/rss/1.0/modules/content/"><![CDATA[<p><em><strong>Click through to see the images.</strong></em></p> <br /><div id="body">
<p><img src="chemistry_album/testkits2.jpg" alt="testkits2.jpg" class="image-inline" /></p>
<p><span class="dropcap">I</span> was scheduled to give a presentation to a reef aquarium club some time ago, and I figured I'd try to do something different after the talk. I asked to have everyone coming to the talk bring all of their water testing kits, expired or not, just to see what would happen if a bunch of hobbyists tested the same water samples with different kits. With the help of my colleague and organic chemist Dr. David Flanigan, I got some water samples ready, and the club members brought in 14 pH kits, 9 nitrate kits, 14 calcium kits, and 12 alkalinity kits. They brought in 10 refractometers/floating hydrometers, too.</p>
<p>I gave out some slips of paper that asked for the brand/type, expiration date, result, and any comments, and asked to have them filled out accordingly. I also asked them, time allowing, to give their kit to someone else when they finished with it, so we could see what happened when two people tried using the same kit. So, I'll give more than one result for some kits, but only one for many others.</p>
<p>Note that no one was told where the water samples came from before testing in order to help reduce any bias in findings. In fact, they were told that some of the water wasn't from an aquarium (it wasn't). The results of these tests were quite surprising to say the least, and are certainly worth a look. Make sure that you look at the whole article (for reasons you'll see below).</p>
<div class="photo-wrapper"><a class="popup" href="chemistry_album/IMG_6577.jpg" rel="gallery"> <img src="chemistry_album/IMG_6577.jpg/image_full" alt="IMG_6577.jpg" class="image-inline" /> </a></div>
<h2>Refractometers/Hydrometers</h2>
<p>To test the refractometers/hydrometers, we used a calibrated MA877 Milwaukee Seawater Digital Refractometer to measure the specific gravity of a few gallons of water from one the aquariums I maintain at school. The specific gravity at 23°C was 1.024.</p>
<div class="photo-wrapper"><a class="popup" href="chemistry_album/Refract-MilwaukeeMR100ATC.jpg" rel="gallery" title="A Milwaukee MR100ATC refractometer used in this study."><img src="chemistry_album/Refract-MilwaukeeMR100ATC.jpg/image_full" alt="Refract-MilwaukeeMR100ATC.jpg" class="image-inline" /></a>
<p class="caption">A Milwaukee MR100ATC refractometer used in this study.</p>
</div>
<div class="photo-wrapper"><a class="popup" href="chemistry_album/io-hydrometer.jpg" rel="gallery" title="Instant Ocean Hydrometer."><img src="chemistry_album/io-hydrometer.jpg/image_full" alt="io-hydrometer.jpg" class="image-inline" /></a>
<p class="caption">Instant Ocean Hydrometer.</p>
</div>
<table class="listing nosort" id="table1">
<tbody>
<tr>
<th scope="col">Refractometer</th> <th scope="col">Result</th> <th scope="col">Notes</th>
</tr>
<tr>
<td>Instant Ocean</td>
<td>1.027</td>
<td>Hydrometer #5 measured the specific gravity at 1.027, and the comment was "easy, but off".</td>
</tr>
<tr>
<td>Instant Ocean</td>
<td>1.024</td>
<td>Hydrometer #4 measured the specific gravity at 1.024, and the comment was "easy to use".</td>
</tr>
<tr>
<td>Instant Ocean</td>
<td>1.024</td>
<td>Hydrometer #3 measured the specific gravity at 1.024, and there was no comment.</td>
</tr>
<tr>
<td>Instant Ocean</td>
<td>1.024</td>
<td>Hydrometer #2 measured the specific gravity at 1.024, and there was no comment.</td>
</tr>
<tr>
<td>Instant Ocean</td>
<td>1.024</td>
<td>Hydrometer #1 measured the specific gravity at 1.024, and there was no comment.</td>
</tr>
<tr>
<td>Unbranded, of Chinese manufacture</td>
<td>1.040</td>
<td>Refractometer #5 measured the specific gravity at 1.040, and the comment was "easy to use - cheap e-bay tester".</td>
</tr>
<tr>
<td>Unbranded, of Chinese manufacture</td>
<td>1.024</td>
<td>Refractometer #4 measured the specific gravity at 1.024, and there was no comment.</td>
</tr>
<tr>
<td>Premium Blue RHS-10ATC</td>
<td>1.024</td>
<td>Refractometer #3 measured the specific gravity at 1.024, and there was no comment.</td>
</tr>
<tr>
<td>Milwaukee MR100ATC</td>
<td>1.024</td>
<td>Refractometer #2 measured the specific gravity at 1.024, and the comment was "easy".</td>
</tr>
<tr>
<td>Milwaukee MR100ATC</td>
<td>1.024</td>
<td>Refractometer #1 measured the specific gravity at 1.024, and the comment was "easy to read".</td>
</tr>
</tbody>
</table>
<h2>pH Kits</h2>
<p>To test pH kits, we used the same water that was taken from an aquarium. David used a triple-calibrated Oakton Instruments Testr-2 digital pH meter and found that the pH of the sample was 8.2.</p>
<div class="photo-wrapper"><a class="popup" href="chemistry_album/salifert-ph.jpg" rel="gallery" title="A typical Salifert pH test kit utilized in this study."><img src="chemistry_album/salifert-ph.jpg/image_full" alt="salifert-ph.jpg" class="image-inline" /></a>
<p class="caption">A typical Salifert pH test kit utilized in this study.</p>
</div>
<table class="listing nosort" id="table2">
<tbody>
<tr>
<th scope="col">pH Kit</th> <th scope="col">Result</th> <th scope="col">Notes</th>
</tr>
<tr>
<td>Reef Master</td>
<td>8.2</td>
<td>Kit #14 was expired by 18 months. The result was 8.2, and the comment was "easy instructions, easy to use".</td>
</tr>
<tr>
<td>Sera</td>
<td>8.5</td>
<td>Kit #13 had no expiration date indicated. The result was 8.5, and there was no comment.</td>
</tr>
<tr>
<td>Nutrafin</td>
<td>8.2, 8.5</td>
<td>Kit #12 was expired by 1 month and the results were 8.2 and 8.5. The comments, respectively, were "easy" and "easy to use".</td>
</tr>
<tr>
<td>Seachem</td>
<td>8.2</td>
<td>Kit #11 had no expiration date indicated. The result was 8.2, and the comment was "fast, palette read easily".</td>
</tr>
<tr>
<td>Red Sea</td>
<td>8.6</td>
<td>Kit #10 was expired by 6 months. The result was 8.6, and the comment was "color hard to read".</td>
</tr>
<tr>
<td>Red Sea</td>
<td>8.2, 8.4</td>
<td>Kit #9 was expired by 6 months, and the results were 8.2 and 8.4. The only comment was "easy to understand".</td>
</tr>
<tr>
<td>Instant Ocean</td>
<td>8.2</td>
<td>Kit #8 was expired by 22 months. The result was 8.2, and the comment was "simple instructions, easy to use".</td>
</tr>
<tr>
<td>Instant Ocean</td>
<td>8.2</td>
<td>Kit #7 was expired by 18 months. The result was 8.2, and the comment was "easy/fast".</td>
</tr>
<tr>
<td>Aquarium Pharmaceuticals</td>
<td>8.2, 8.2</td>
<td>Kit #6 had no expiration date indicated, and the results were 8.2 and 8.2. The comments, respectively, were "very simple to use and understand" and "easy to read and use".</td>
</tr>
<tr>
<td>API</td>
<td>8.2</td>
<td>Kit #5 had no expiration date indicated, and the result was 8.2. The comment was "color scale is hard to read".</td>
</tr>
<tr>
<td>API</td>
<td>8.2, 8.2</td>
<td>Kit #4 had no expiration date indicated, and the results were 8.2 and 8.2. There were no comments.</td>
</tr>
<tr>
<td>Salifert</td>
<td>8.0</td>
<td>Kit #3 had no expiration date indicated, and the result was 8.0. The comment was "old kit".</td>
</tr>
<tr>
<td>Salifert</td>
<td>8.0</td>
<td>Kit #2 was expired by 10 months, and the result was 8.0. The comment was "super easy".</td>
</tr>
<tr>
<td>Salifert</td>
<td>8.0, 8.0</td>
<td>Kit #1 was expired by 5 months. The results were 8.0 and 8.0. The comments, respectively, were "easy to use" and "easy to read and match results".</td>
</tr>
</tbody>
</table>
<h2>Nitrate Kits</h2>
<p>To test nitrate kits, I did not want to use tank water as I expected it to have a very low concentration. So, David made up a standard for us to use, which had a nitrate concentration of 25ppm.</p>
<div class="photo-wrapper"><a class="popup" href="chemistry_album/RedSea-nitrate-Test-Kit.jpg" rel="gallery" title="A Red Sea Nitrate Pro test kit."><img src="chemistry_album/RedSea-nitrate-Test-Kit.jpg/image_full" alt="RedSea-nitrate-Test-Kit.jpg" class="image-inline" /></a>
<p class="caption">A Red Sea Nitrate Pro test kit.</p>
</div>
<table class="listing nosort" id="table3">
<tbody>
<tr>
<th scope="col">Nitrate Kit</th> <th scope="col">Result, ppm</th> <th scope="col">Notes</th>
</tr>
<tr>
<td>Reef Master</td>
<td>100</td>
<td>Kit #9 was expired by 18 months. The result was 100ppm, and the comment was "easy instructions".</td>
</tr>
<tr>
<td>Nutrafin</td>
<td>110</td>
<td>Kit #8 was not expired. The result was 110ppm, and the comment was "very easy".</td>
</tr>
<tr>
<td>Red Sea</td>
<td>100</td>
<td>Kit #7 was expired by 20 months. The result was 100ppm, and the comment was "hard to pick a color".</td>
</tr>
<tr>
<td>Red Sea</td>
<td>50, 50</td>
<td>Kit #6 was expired by 21 months. The results were 50ppm and 50ppm. The comments were "not sure how to interpret" and "colors match, easy directions".</td>
</tr>
<tr>
<td>API</td>
<td>50</td>
<td>Kit #5 had no expiration date indicated. The result was 50ppm, and the comment was "always easy - never trusted".</td>
</tr>
<tr>
<td>API</td>
<td>5, 20</td>
<td>Kit #4 had no expiration date indicated. The results were 5ppm and 20ppm. The comments were "results depend on how hard shaken" and "results depend on shaking."</td>
</tr>
<tr>
<td>Instant Ocean</td>
<td>1, 1</td>
<td>Kit #3 was expired by 22 months. The results were 1ppm and 1ppm. The comments were, oddly enough, "easy" and "very long".</td>
</tr>
<tr>
<td>Instant Ocean</td>
<td>20, 20</td>
<td>Kit #2 was expired by 10 months. The results were 20ppm and 20ppm. The comments were "easy to use" and "easy to read".</td>
</tr>
<tr>
<td>Salifert</td>
<td>25, 100</td>
<td>Kit #1 was expired by 16 months. The results were 25ppm and 100ppm. The comments, respectively, were "easy to read instructions" and "instructions easy to follow".</td>
</tr>
</tbody>
</table>
<h2>Calcium Kits</h2>
<p>To test calcium kits, we again used the aquarium water. I took a sample and sent it to a local water quality lab and they reported that the concentration of calcium was 338ppm.</p>
<div class="photo-wrapper"><a class="popup" href="chemistry_album/API_Calcium.jpg" rel="gallery" title="API Calcium Test Kit."><img src="chemistry_album/API_Calcium.jpg/image_full" alt="API_Calcium.jpg" class="image-inline" /></a>
<p class="caption">API Calcium Test Kit.</p>
</div>
<table class="listing nosort" id="table4">
<tbody>
<tr>
<th scope="col">Calcium Kit</th> <th scope="col">Result, ppm</th> <th scope="col">Notes</th>
</tr>
<tr>
<td>Elos</td>
<td>350</td>
<td>Kit #14 was expired by 3 months. The result was 350ppm, and the comment was "easy test".</td>
</tr>
<tr>
<td>Reef Master</td>
<td>225</td>
<td>Kit #13 was expired by 15 months. The result was 225ppm, and the comment was "easy instructions".</td>
</tr>
<tr>
<td>Sera</td>
<td>400</td>
<td>Kit #12 had no expiration date indicated. The result was 400ppm, and there was no comment.</td>
</tr>
<tr>
<td>Nutrafin</td>
<td>240</td>
<td>Kit #11 was expired by 1 month. The result was 240ppm, and the comment was "easy to read".</td>
</tr>
<tr>
<td>Red Sea</td>
<td>380</td>
<td>Kit #10 was not expired. The result was 380ppm, and the comment was "simple to use".</td>
</tr>
<tr>
<td>Nature Reef</td>
<td>410, 450</td>
<td>Kit #9 was not expired. The results were 410ppm and 450ppm. The comments were (almost comically) "difficult to understand" and "pretty simple directions".</td>
</tr>
<tr>
<td>Seachem</td>
<td>100, 350</td>
<td>Kit #8 had no expiration date indicated. The results were 100ppm and 350ppm. The comments were "wasn't hard to use" and "easy to understand".</td>
</tr>
<tr>
<td>API</td>
<td>340, 390</td>
<td>Kit #7 had no expiration date indicated. The results were 340ppm and 390ppm. The comments were "too many drops - easy to lose count" and none were given from the second tester. Oddly enough, despite the comments about it being easy to lose count, this was the closest anyone got to the lab-measured concentration. Of course, that could also be pure luck after looking at the rest of the results...</td>
</tr>
<tr>
<td>API</td>
<td>480</td>
<td>Kit #6 was expired by 18 months. The result was 480ppm, and the comments were "took a long time to add drops one by one".</td>
</tr>
<tr>
<td>Instant Ocean</td>
<td>495, 975</td>
<td>Kit #5 was expired by 24 months. The results were 495ppm and 975ppm. The comments were "difficult to tell when the correct color was achieved" and "the testing was easy, but obtaining the results is time consuming".</td>
</tr>
<tr>
<td>Instant Ocean</td>
<td>240, 300</td>
<td>Kit #4 was expired by 5 months. The results were 240ppm and 300ppm. The comments were "hard to tell color shift" and "very confusing, not sure when exactly it is blue".</td>
</tr>
<tr>
<td>Salifert</td>
<td>320</td>
<td>Kit #3 was not expired. The result was 320ppm, and there was no comment.</td>
</tr>
<tr>
<td>Salifert</td>
<td>250, 350</td>
<td>Kit #2 was expired by 5 months. The results were 250ppm and 350ppm. The comments, respectively, were "instructions were difficult to understand" and "confusing, pain in the ass".</td>
</tr>
<tr>
<td>Salifert</td>
<td>200</td>
<td>Kit #1 had no expiration date indicated, and the result was 200ppm. The comment was "very old kit - directions are complex".</td>
</tr>
</tbody>
</table>
<h2>Alkalinity Kits</h2>
<p>To test alkalinity kits, we used the same aquarium water. And again, I took a sample and sent it to the lab, which reported that the alkalinity was 3.3meq/l. Note that different kits may report results in either ppm, meq/l, or dKh, but I have converted all results to meq/l for ease of comparison.</p>
<div class="photo-wrapper"><a class="popup" href="chemistry_album/seachem-alkalinity.jpg" rel="gallery" title="Seachem MultiTest for pH and Alkalinity."><img src="chemistry_album/seachem-alkalinity.jpg/image_full" alt="seachem-alkalinity.jpg" class="image-inline" /></a>
<p class="caption">Seachem MultiTest for pH and Alkalinity.</p>
</div>
<table class="listing nosort" id="table5">
<tbody>
<tr>
<th scope="col">Alkalinity Kit</th> <th scope="col">Results, meq/l</th> <th scope="col">Notes</th>
</tr>
<tr>
<td>Marineland</td>
<td>3.5</td>
<td>Kit #12 was expired by 8 months. The result was 3.5meq/l, and the comments were "easy to read".</td>
</tr>
<tr>
<td>LaMotte</td>
<td>3.2</td>
<td>Kit #11 was expired by 7 months. The result was 3.2meq/l, and the comments were "easy test".</td>
</tr>
<tr>
<td>Sera</td>
<td>3</td>
<td>Kit #10 had no expiration date indicated. The result was 3meq/l, and the comment was "easy to read and understand".</td>
</tr>
<tr>
<td>Elos</td>
<td>3.2</td>
<td>Kit #9 was not expired. The result was 3.2meq/l, and the comment was "easy to use, a little hard to read".</td>
</tr>
<tr>
<td>Nutrafin</td>
<td>2.2, 2.4</td>
<td>Kit #8 was expired by 1 month. The results were 2.2meq/l and 2.4meq/l. The comments were "easy" and "pretty easy".</td>
</tr>
<tr>
<td>Seachem</td>
<td>2.5</td>
<td>Kit #7 had no expiration date indicated. The result was 2.5meq/l, and the comment was "easy!".</td>
</tr>
<tr>
<td>Red Sea</td>
<td>2.25, 2.25</td>
<td>Kit #6 was expired by 6 months, and the results were 2.25meq/l and 2.25meq/l. The only comment was "tough to distinguish".</td>
</tr>
<tr>
<td>API</td>
<td>3.6</td>
<td>Kit #5 was expired by 17 months. The result was 3.6meq/l, and the comment was "easy".</td>
</tr>
<tr>
<td>API</td>
<td>2.5, 3.2</td>
<td>Kit #4 had no expiration date indicated, and the results were 2.5meq/l and 3.2meq/l. There were no comments.</td>
</tr>
<tr>
<td>API</td>
<td>3.2, 3.9</td>
<td>Kit #3 had no expiration date indicated, and the results were 3.2meq/l and 3.9meq/l. There were no comments.</td>
</tr>
<tr>
<td>Instant Ocean</td>
<td>2.5</td>
<td>Kit #2 was expired by 5 months. The result was 2.5meq/l, and the comment was "super easy".</td>
</tr>
<tr>
<td>Instant Ocean</td>
<td>2.5, 4.5</td>
<td>Kit #1 had no expiration date indicated, and the results were 2.5meq/l and 4.5meq/l. The comments, respectively, were "easy to use" and "simple to read/use".</td>
</tr>
</tbody>
</table>
<h2>Comments</h2>
<p>First, I'm just the messenger reporting results turned in by a group of reef aquarium hobbyists. So please don't sue/shoot me if you don't like the findings! Other than that, what a mess. The results for many types and brands of kits are obviously all over the place, and I guess the question is why that's the case.</p>
<p>Well, most of the kits were expired, which could obviously cause problems. Although, in some cases the expired kits performed as well as or even better than the current ones. Of course, that could have simply been random chance. So, it would seem that either (many of) the kits are simply inaccurate, or the method of use produces unreliable results, or (many) hobbyists just aren't good at following directions and using the kits properly - or any combination of these.</p>
<p>As far as user error goes, this could occur for many reasons and some kits had easier to follow instructions than others. Likewise, some kits are simply easier to use and/or produce results that are easier to read. And, in the case of one of the hydrometers being a little off on the high side, all it takes is a single tiny bubble stuck on the back-side of the swing arm to give such a result. In other words, there are plenty of opportunities to mess things up. So, I'll take things a step further to show that user error very likely plays a significant role in the apparent poor performances of many of the kits above, especially in cases where a kit was tested twice and gave significantly different results.</p>
<h2>Alkalinity Kits - Part II</h2>
<p>At a different time I also wanted to see what sorts of results would be produced if the same person took their time and used the same kit, on the same sample, repeatedly. So, David and I used our own kits and our own funds to go out and purchase a few more from a couple of local shops. We only got one of each brand of kit available to us (did I mention it was our own money?), but we figured that even testing one kit of each brand could be very informative. Besides, any of the kits we purchased could have been the kit that the next hobbyist needing one would have bought.</p>
<p>Depending on the type of dye used by the manufacturers of these kits, some can apparently be used equally well for freshwater and saltwater. However, others may give results that vary as much as 10% between the two (Holmes-Farley 2002). I wouldn't consider this to be significant, though. So, we figured we'd do both to see what happens.</p>
<p>David made a freshwater standard in the lab, which had an alkalinity of 3.5meq/l, and also made up a fresh batch of seawater using DI water and a popular salt mix, which was aerated for a few hours afterwards then allowed to sit for several more. This sample was then tested 6 times (3 times by each of us) with a Hach alkalinity kit, which coincidentally and consistently indicated an alkalinity of 3.5meq/l. Note that while we are comparing results of kits with the results of a kit, the point here is to look at consistency of results.</p>
<p>After preparation, each test kit was used 6 times to determine the alkalinity of the freshwater standard and 6 times to determine the alkalinity of the seawater sample. Note that rather than have one person perform all 6 tests on each sample, we decided to do 3 tests each on both samples for two reasons.</p>
<p>First of all, this could shed some light on how two people may do things differently even when following the same set of instructions. For example, when any given set of instructions says "fill to the line" two people may have different ideas of what this means. You've probably seen water form a meniscus when put in a glass container, and one person's idea of filling to a line may mean that the top of the meniscus touches the line, while another may think that the bottom of the meniscus should be at the line, etc.</p>
<p>Secondly, I'm partially colorblind. We thought this might be significant in some cases, as these kits require users to compare a colored liquid (the test medium) to a colored chart or scale of some sort to determine test results. Approximately 8% of males (but only 0.5% of females) are at least partially colorblind (Wikipedia 2012), meaning many hobbyists may have trouble with various colorimetric test kits due to a visual deficiency. So, we both performed the tests to see if I would have any particular difficulties not experienced by David.</p>
<p>Lastly, as noted above, different kits report results in either ppm, meq/l, or dKh, but I have converted all results to meq/l for ease of comparison.</p>
<table class="listing nosort" id="table6">
<tbody>
<tr>
<th height="17" width="88"></th> <th colspan="7" width="448">Freshwater, meq/l</th>
</tr>
<tr>
<th height="17"></th> <th colspan="3">JF</th> <th colspan="3">DF</th> <th></th>
</tr>
<tr>
<th height="17">Test Kit</th> <th>Test 1</th> <th>Test 2</th> <th>Test 3</th> <th>Test 1</th> <th>Test 2</th> <th>Test 3</th> <th>Average</th>
</tr>
<tr>
<td>Nutrafin</td>
<td>2.80</td>
<td>2.80</td>
<td>2.80</td>
<td>2.80</td>
<td>2.80</td>
<td>2.80</td>
<td>2.80</td>
</tr>
<tr>
<td>Salifert</td>
<td>4.00</td>
<td>4.00</td>
<td>4.00</td>
<td>4.00</td>
<td>4.00</td>
<td>4.00</td>
<td>4.00</td>
</tr>
<tr>
<td>Seachem</td>
<td>4.00</td>
<td>4.00</td>
<td>4.50</td>
<td>4.00</td>
<td>4.00</td>
<td>4.50</td>
<td>4.17</td>
</tr>
<tr>
<td>Red Sea</td>
<td>3.60</td>
<td>3.60</td>
<td>3.60</td>
<td>3.60</td>
<td>3.60</td>
<td>3.60</td>
<td>3.60</td>
</tr>
<tr>
<td>API</td>
<td>3.60</td>
<td>3.60</td>
<td>3.60</td>
<td>3.90</td>
<td>3.90</td>
<td>3.90</td>
<td>3.75</td>
</tr>
<tr>
<td>Instant Ocean</td>
<td>3.50</td>
<td>3.50</td>
<td>3.50</td>
<td>3.50</td>
<td>3.50</td>
<td>3.25</td>
<td>3.46</td>
</tr>
</tbody>
</table>
<table class="listing nosort" id="table7">
<tbody>
<tr>
<th height="17" width="88"></th> <th colspan="7" width="448">Saltwater, meq/l</th>
</tr>
<tr>
<th height="17"></th> <th colspan="3">JF</th> <th colspan="3">DF</th> <th></th>
</tr>
<tr>
<th height="17">Test Kit</th> <th>Test 1</th> <th>Test 2</th> <th>Test 3</th> <th>Test 1</th> <th>Test 2</th> <th>Test 3</th> <th>Average</th>
</tr>
<tr>
<td>Nutrafin</td>
<td>2.80</td>
<td>2.80</td>
<td>2.80</td>
<td>2.80</td>
<td>2.80</td>
<td>2.60</td>
<td>2.77</td>
</tr>
<tr>
<td>Salifert</td>
<td>3.60</td>
<td>3.60</td>
<td>3.70</td>
<td>3.60</td>
<td>3.60</td>
<td>3.60</td>
<td>3.62</td>
</tr>
<tr>
<td>Seachem</td>
<td>4.00</td>
<td>3.50</td>
<td>3.50</td>
<td>4.00</td>
<td>4.00</td>
<td>4.00</td>
<td>3.83</td>
</tr>
<tr>
<td>Red Sea</td>
<td>2.80</td>
<td>2.70</td>
<td>2.70</td>
<td>2.90</td>
<td>2.80</td>
<td>2.70</td>
<td>2.77</td>
</tr>
<tr>
<td>API</td>
<td>3.90</td>
<td>3.60</td>
<td>3.60</td>
<td>3.90</td>
<td>3.60</td>
<td>3.60</td>
<td>3.70</td>
</tr>
<tr>
<td>Instant Ocean</td>
<td>3.50</td>
<td>3.50</td>
<td>3.50</td>
<td>3.25</td>
<td>3.25</td>
<td>3.25</td>
<td>3.38</td>
</tr>
</tbody>
</table>
<h3>Notes:</h3>
<p><b>Instant Ocean</b>: This kit was not expired, but oddly enough an expiration date could not be found on the outside of the package.</p>
<p><b>API</b>: This kit had no expiration date indicated.</p>
<p><i>Note that the instructions said to cap the test vial with the included cap and to shake the sample after each drop added. However, the cap did not fit well and shaking the sample allowed some sample water to escape the test vial. So, while we started with the seawater sample, the remaining tests performed by both of us were done without the cap, by swirling the sample in the vial.</i></p>
<p><b>Red Sea</b>: This kit was not expired.</p>
<p><i>Freshwater notes: We agreed during all six tests that the final color was a little darker than the darkest part of the scale that comes with this kit. The scale stops at 3.6, so the results may have been slightly higher than 3.6.</i></p>
<p><i>Saltwater notes: Note that Riddle (2007) tested Red Sea's alkalinity kit using a seawater sample and found the results to be approximately 19% low.</i></p>
<p><b>Seachem</b>: This kit had no expiration date indicated.</p>
<p><i>Riddle (2007) also tested Seachem's alkalinity kit using a seawater sample and found the results to be within about 10% of expected.</i></p>
<p><b>Salifert</b>: This kit was not expired.</p>
<p><i>Riddle (2007) also tested Salifert's alkalinity kit using a seawater sample and found the results to be about 11% high.</i></p>
<p><b>Nutrafin</b>: This kit was not expired.</p>
<h2>More Comments</h2>
<p>Now we see a very different picture. As you can see, consistency was actually surprisingly good for any given test when tested by one of us, although in some cases David and I got somewhat different results for the same kit. For example, when I used the Instant Ocean kit for the seawater sample I got 3.5meq/l all three times, but David got 3.25meq/l all three times. When it comes down to it, I personally find a variance of only 0.25meq/l to be very good for an easily affordable hobbyist test kit. For that matter, all results for all kits on each of the samples were within 0.5meq/l.</p>
<p>So, with all this in mind, here are some suggestions: Always check expiration dates on kits and make sure they are up to date. Don't test when you're in a hurry. Sit down, take your time, and thoroughly read the instructions. I think it would also be a good idea to use any new kit at least three times on a single sample to see if you/the kit can provide consistent results. If you get different answers, try to figure out if it's you doing something a little different each time, or if it's the kit. If you're convinced it's the kit, try a different brand. And, as far as overall accuracy goes, it seems that lately there are more and more kits of various sorts that come with their own standards. These should allow you to check a kit's accuracy yourself.</p>
<p>For the manufacturers of the kits, the instructions on many of these (but certainly not all) were not easy to understand/follow, especially for inexperienced hobbyists. For best results, adding some pictures would likely be very helpful. For example, a picture of what "fill to the line" for a given kit means, etc. would be great and easily clear up any confusion. With respect to alkalinity kits, it would also be nice if everyone would use meq/l.</p>
<h2>References</h2>
<ol>
<li>Holmes-Farley, R. 2012. Chemistry and the Aquarium: What is Alkalinity?. <i>Advanced Aquarist</i> 1(2). URL: <a href="../../2002/2/chemistry">http://www.advancedaquarist.com/2002/2/chemistry</a>.</li>
<li>Riddle, D. 2007. Product Review: Alkalinity Test Kit Showdown. <i>Advanced Aquarist</i> 6(8). URL: <a href="../../2007/8/review">http://www.advancedaquarist.com/2007/8/review</a></li>
<li>Wikipedia, 2012. Color blindness. URL: <a href="http://en.wikipedia.org/wiki/Color_blindness">http://en.wikipedia.org/wiki/Color_blindness</a></li>
</ol></div> <br /><br /> <script type="text/javascript"><!-- google_ad_client = "ca-pub-5170032844807535"; /* Square250x250 */ google_ad_slot = "6862474606"; google_ad_width = 250; google_ad_height = 250; //--></script><script type="text/javascript" src="http://pagead2.googlesyndication.com/pagead/show_ads.js"></script>]]></content:encoded>
    <dc:publisher>No publisher</dc:publisher>
    
    <dc:creator>James W. Fatherree, M.Sc.</dc:creator>
    <dc:rights>Pomacanthus Publications, Inc.</dc:rights>
    
      <dc:subject>Test Kits</dc:subject>
    
    
      <dc:subject>M.Sc.</dc:subject>
    
    
      <dc:subject>Aquarium Chemistry</dc:subject>
    
    
      <dc:subject>James W. Fatherree</dc:subject>
    
    <dc:date>2012-06-20T15:00:00Z</dc:date>
    <dc:type>Page</dc:type>
  </item>


  <item rdf:about="http://www.advancedaquarist.com/2012/4/review">
    <title>Product Review: Hanna 'Checkers': Calcium and Iron Colorimeters and Thoughts on Aquarium Industry Product Quality Control</title>
    <link>http://www.advancedaquarist.com/2012/4/review</link>
    <description>Both instruments are recommended if the minimum and maximum detection limits meet your requirements and good laboratory practices are maintained. Good job Hanna!</description>
    <content:encoded xmlns:content="http://purl.org/rss/1.0/modules/content/"><![CDATA[<p><em><strong>Click through to see the images.</strong></em></p> <br /><div id="body">
<p><img src="review_album/checker2.jpg" alt="checker2.jpg" class="image-inline" /></p>
<p> </p>
<p><span class="dropcap">A</span>dvances in technology and utilization of LEDs in particular continue to bring new analytical devices to market and many of these instruments are smaller and much less expensive than those of only a few years ago. Hanna Instruments has introduced two colorimeters (called 'Checkers') specifically designed to test for calcium and iron. We'll pit the inexpensive Hanna Iron Checker and reagents against a $1,150 Hach DR890 colorimeter, Hach reagents, and a Hach Certified Iron Standard. The Hanna Calcium Checker will be challenged by Hanna's own Certified Calcium Standard. How do the results compare, and are these instruments worthy of your consideration? What are the strengths and weaknesses of these two instruments?</p>
<div class="photo-wrapper"><a class="popup" href="review_album/iron.jpg" rel="gallery" title="Hanna Iron Checker"><img src="review_album/iron.jpg/image_full" alt="iron.jpg" class="image-inline" /></a>
<p class="caption">Hanna Iron Checker</p>
</div>
<h2></h2>
<h2>What is a Colorimeter?</h2>
<p>A colorimeter is a device that can measure light transmitted through (or absorbed by) a liquid. Since addition of a specific chemical reagent to a solution containing the target substance may cause the sample to become colored, a colorimeter measures the light (often that produced by a monochromatic light source as a light-emitting diode, or LED) absorbed/transmitted by the colored solution after the zero reference of a non-colored (blank) solution has been made. Hence the concentration can be calculated by the instrument's programmed logic.</p>
<h2>Importance of Calcium and Iron in the Aquarium</h2>
<p>Calcium is, of course, a critical chemical parameter in reef aquaria. It is extracted from the water column by calcifying plants and animals. Calcium concentrations vary according to different references but 400 to 420 mg/L are the generally accepted levels. On the other hand, iron is found in seawater at very low concentrations (0.002 to 0.02 mg/L depending upon reference). Iron is a critical element in many biochemical processes and is an important factor in photosynthesis. At very low concentrations, iron can be a limiting element for photosynthesis.</p>
<h2>Hanna Instruments</h2>
<p>Hanna Instruments (Woonsocket, Rhode Island, USA) has been in business since 1978, and today offers over 3,000 products to its customers worldwide. Many of their products are of interest to aquarist and Hanna has in fact targeted the aquarium market. For more details, see 'Contact Information' near the close of this article. Hanna imports the Checkers and their reagents from Europe (Romania to be exact).</p>
<h3>Instrument Programming</h3>
<p>The iron and calcium Checkers have a number of pre-programmed features. In case of the iron unit, perhaps the most important is a timer (some instruments costing 15x as much lack this). Other programming includes high light, low light, inverted cuvette, under range, over range, low battery and dead battery. The Calcium Checker's minimum reading is 200 mg/L while its maximum is 600 (and this is how under- and over-range samples are reported). No timer is required for calcium testing and low battery and dead battery is signaled. Quite a lot programmed into instruments the size of a pack of playing cards.</p>
<h3>Manufacturer's Specifications: Iron</h3>
<p>High Range Iron Colorimeter (Model HI-721): Manufacturer's Specifications Range: 0 - 5 mg/L Resolution: 0.01 mg/L Readout: Liquid Crystal Display (LCD; ~1/2") Accuracy @ 25C (77F): ±0.04 mg/L; ±2% of reading LED Maximum Wavelength: 525nm Temperature: 0-50C (32-F) Humidity: 95% non-condensing Battery: 1 AAA Auto Shut-off after 3 minutes of non-use, and 10 seconds after measurement Weight: ~ 2 ounces</p>
<p>Hanna's reagent for iron is similar to Hach's and converts all soluble iron and most insoluble forms of iron in the sample to soluble ferrous iron. The ferrous iron reacts with the 1-10 phenanthroline indicator in the reagent to form an orange color in proportion to the total iron concentration.</p>
<h3>Manufacturer's Specifications: Calcium</h3>
<p>Marine Calcium Colorimeter (Model HI-758):</p>
<ul>
<li>Manufacturer's Specifications Range: 200-600 mg/L</li>
<li>Resolution: 1 mg/L</li>
<li>Readout: Liquid Crystal Display (LCD; ~1/2")</li>
<li>Accuracy: ±6%</li>
<li>LED Maximum Wavelength: 610nm</li>
<li>Temperature: 0-50C (32-122F)</li>
<li>Humidity: 95% non-condensing</li>
<li>Battery: 1 AAA</li>
<li>Auto Shut-off after 10 minutes of non-use</li>
<li>Weight: ~2 ounces</li>
</ul>
<p>Hanna's calcium test used a modified zincon (1-carboxy-2'-hydroxy-5'-sulformazylbenzene) procedure to test indirectly for calcium. In the test procedure, calcium displaces zinc from an EGTA (ethylene glycol tetraacetic acid) complex, which is then analyzed for. A blue color develops and is proportional to the amount of zinc displaced by calcium. Zinc is then measured colorimetrically. Reagent 'A' contains mostly sodium tetraborate decahydrate, a pH buffering agent followed by small amounts of zinc and sodium hydroxide.</p>
<h3>Possible Interferences with the Zincon Calcium Analysis Method</h3>
<p>An interference is a positive or negative effect on result of the target substance by an extraneous factor during analysis. For instance, the EDTA titration method is a popular method for calcium analysis but is one subject to a positive interference by strontium as well as a few other substances. Hanna's method is <i>not</i> the EDTA method (it is instead the zincon method). I wondered of potential impact on the calcium result by another metal (strontium). I performed a quick analysis of deionized water spiked with a few crystals of strontium chloride and found the sample developed a blue color indicative of calcium. I cannot say for sure if strontium is a positive interference or if the strontium chloride (A.C.S. grade) used to spike the blank contained a small amount of calcium. From my limited data, I suggest this test may be subject to interferences.</p>
<h2>Testing Protocol</h2>
<p>A solution containing 3 mg/L iron (a drinking water standard from Hach Company) was initially tested, and then diluted and tested by a Hach DR890 colorimeter and a Hanna Checker. Deionized water served as the control for both instruments. Results are shown in Figure 1.</p>
<p>A Certified Laboratory Standard (400 mg/L as Calcium, ±20 mg/L) checked instrument calibration. It consists of two 10-mL cuvettes - one contains a blank (unreacted sample) and the other a reacted sample containing a known amount of calcium. The Certified Standard I received contained 400 mg/L (±20mg/L) and results of 4 checks I performed were 399, 401, 399, and 400 - close enough for me! The Standard is marked with an expiration date (expect a shelf life of about 6 months). One standard check should be performed for about every 10 calcium analyses for quality control purposes. The Standard is relatively inexpensive at ~$15 US plus taxes and shipping if applicable. I highly recommend this option.</p>
<p>A standard was prepared from deionized water and commercially available calcium chloride. Once a baseline figure was obtained, this sample was diluted by 10% several times. These results are in Figure 2 below.</p>
<p>A single sample grabbed from the waters of a natural reef was analyzed several times in order to judge my laboratory technique. Results are shown in Figure 3.</p>
<h2>Results</h2>
<p>A comparison of results of iron testing by Hanna's Checker and a much more expensive Hach colorimeter are shown in Figure 1.</p>
<div class="photo-wrapper"><a class="popup" href="review_album/image001.png" rel="gallery" title="Figure 1. The results generated by the Hanna Checker and Hach's colorimeter are almost identical."><img src="review_album/image001.png/image_full" alt="image001.png" class="image-inline" /></a>
<p class="caption">Figure 1. The results generated by the Hanna Checker and Hach's colorimeter are almost identical.</p>
</div>
<p>Figure 2 shows the results of a standard calcium solution diluted several times to span the range of results reef hobbyists might expect to see.</p>
<div class="photo-wrapper"><a class="popup" href="review_album/image003.png" rel="gallery" title="Figure 2. The blue markers and line shows the anticipated results of a calcium standard and multiple="><img src="review_album/image003.png/image_full" alt="image003.png" class="image-inline" /></a>
<p class="caption">Figure 2. The blue markers and line shows the anticipated results of a calcium standard and multiple dilutions while the yellow line and markers are the actual test results.</p>
</div>
<h3>Analyses of Calcium and Iron in a Water Sample from a Natural Reef</h3>
<p>As a matter of curiosity, a water sample was gathered from the littoral zone at the 4-Mile Marker Reef in Kailua-Kona, Big Island of Hawaii and tested for Calcium and Iron. Salinity of the sample was 34 ppt. When we consider variations of calcium naturally found in seawater (400-420 mg/L) and the margin of error Hanna reports for their instrument (±6%) we could expect acceptable measurements of natural seawater to be in the range of 376 - 445 mg/L. Figure 3 shows the results.</p>
<p>Iron tests all generated readings of 'zero' (or below the detection of the instrument - chart not shown).</p>
<div class="photo-wrapper"><a class="popup" href="review_album/image005.png" rel="gallery" title="Figure 3. Calcium content of natural seawater as measured by a Hanna Marine Calcium Checker. Test #2's result was slightly above the 6% margin of error while that of Test #3 fell slightly below."><img src="review_album/image005.png/image_full" alt="image005.png" class="image-inline" /></a>
<p class="caption">Figure 3. Calcium content of natural seawater as measured by a Hanna Marine Calcium Checker. Test #2's result was slightly above the 6% margin of error while that of Test #3 fell slightly below.</p>
</div>
<p>Time per Test: Hach v. Hanna: The more difficult the task, the less likely it is to be performed hence ease of use and time invested are important considerations. Hanna's iron test can be performed in about 6-7 minutes (including reagent dissolution and 3-minute chemical reaction times. Hach's recommended procedure includes a 3-minute reaction period). The Calcium test requires about 3-4 minutes.</p>
<p>Changing the Battery: Some instruments require a certain degree of talent in order to change the battery. Not so with the Checker brand - simply remove a small Philips Head screw and slip a new AAA battery in.</p>
<h2>Conclusions</h2>
<p>It appears that the lower detection limit of the HI721 High Range Iron Checker is somewhere around 0.05 mg/L Total Iron (suspended and dissolved ferrous and ferric iron). The 721 is probably most useful for hobbyists specializing in freshwater or marine planted aquaria where iron is routinely dosed due to high demand. Due to detection limitations of the Checker, it suitable for analysis of natural and artificial seawater only if a high concentration of iron is known or suspected to exist (the reagent chemistry is sound and no normal interferences are expected).</p>
<p>For marine hobbyists measuring calcium of about 400 mg/L, expect readings of about 375 to 425 or so when practicing good laboratory technique. Hanna uses a highly diluted sample (~100x) and a small cuvette path length (~17mm) to extend the range of this test hence care should be exercised when performing the test procedure. The high dilution factor might account for the advertised accuracy of ±6%. Your dedication to properly performing this test is perhaps the most important factor. Be aware some components of natural and artificial seawater might introduce positive interferences.</p>
<h3>Likes</h3>
<ul>
<li class="ListParagraph">Instrument Price</li>
<li class="ListParagraph">Iron Reagents are suitable for use in fresh, brackish, and seawater (be aware of instrument minimum detection limits. Calcium reagents are suitable for concentrations of 200-400 mg/L, likely limiting it to brackish and saltwater analyses)</li>
<li class="ListParagraph">Good Accuracy for the price, especially for iron</li>
<li class="ListParagraph">Reagent Price: ~36¢ per iron test; ~80¢ per calcium test</li>
<li class="ListParagraph">Calcium reagents are marked with an expiration date</li>
<li class="ListParagraph">Built-in timer (iron only)</li>
<li class="ListParagraph">Instrument Error Messages</li>
<li class="ListParagraph">Material Safety Data Sheet (MSDS) available on-line</li>
<li class="ListParagraph">Hanna offers optional calcium and iron standards for quality assurance</li>
</ul>
<h3>Dislikes</h3>
<ul>
<li class="ListParagraph">Reagent foil packages are large and not easily bent to allow pouring of reagent into the test tube</li>
<li class="ListParagraph">Cuvettes are tall and easily tipped over</li>
<li class="ListParagraph">Calcium test requires use of deionized water that is not supplied</li>
</ul>
<h3>Bottom line</h3>
<p>Both instruments are recommended if the minimum and maximum detection limits meet your requirements and good laboratory practices are maintained. Good job Hanna!</p>
<h2>Suggested Retail Price</h2>
<p>The going price for the HI-721 High Range Iron colorimeter and the Calcium tester (HI-758) seems to be $50.00 - $55.00 US each. Additional iron reagents were found online $8.99 for 25 tests. Calcium reagents were priced at $19.50 for 25 tests. The Hanna Calcium Standard (highly recommended) is about $15 US. Shipping and taxes might be additional.</p>
<h2>Optional Accessories</h2>
<p>The Iron and Calcium Checkers come standard with two 10-milliliter cuvettes (test tubes) and caps. Should the need for additional cuvettes arise, order Hanna part number HI731231 (4 cuvettes); the part number for 4 additional caps is HI-731225. These part numbers are identical for all Checkers, regardless of test. Hanna offers a Calcium Standard (HI758-11) for about $15 US; a similar standard for Iron is offered by Hanna (HI721-11; 1 mg/L) is also available for ~$10 US. Cuvette Cleaning Solution (HI93703-50; 230 mL) will clean dirty vials but really isn't needed if good lab practices are maintained. Other options include Cleaning Tissues (I use Kim Wipes™ or camera lens paper). Batteries (AAA) in my opinion should be purchased locally.</p>
<h2>Other Instruments from Hanna</h2>
<p>Many of Hanna's other instruments may be of interest to aquarist, including:</p>
<ul>
<li>HI-727 Color of Water (0-500 Platinum-Cobalt Units; absorbance @470nm)</li>
<li>HI-736 Phosphate Ultra-low Range (0-200ppb; Ascorbic Acid Method)</li>
<li>HI-718 Iodine (0-12.5 mg/l; DPD Method). Note that chlorine and bromine are positive interferences to the DPD method of analysis.</li>
<li>HI-706 Phosphate High Range (0-15mg/l; Ascorbic Acid Method)</li>
<li>HI-717 Phosphate High Range (0-30mg/l; Ascorbic Acid Method)</li>
<li>HI-764 Nitrite Ultra-low Range (0-200 ppb)</li>
<li>A Magnesium Checker is under development</li>
<li>Although Hanna markets the HI721 as able to analyze 'High Range' iron, there is no 'Low Range' instrument offered</li>
</ul>
<h2>Contact Information</h2>
<p>Hanna Instruments has targeted the aquarium market and has devoted a webpage to hobbyists. See: <a href="mailto:aquariums@hannainst.com">aquariums@hannainst.com</a></p>
<p>Specific questions concerning Hanna instruments and aquaculture can be addressed to Jessica Hoagland, Email: <a href="mailto:jhoagland@hannainst.com" title="Email Jessica Hoagland">jhoagland@hannainst.com</a></p>
<p>Or write to:</p>
<p>Hanna Instruments, Inc. <br /> 584 Park East Drive <br /> Woonsocket, RI 02895</p>
<h2>Testing Procedures and Suggestions</h2>
<p>Since Hanna's Marine Calcium Checker involves a series of steps and a large dilution factor, perhaps we should review things a hobbyist can do to ensure acceptable results. The iron test is easier to perform but basic requirements still apply. First of all, find a comfortable, uncluttered, and well-lighted area for your miniature laboratory.</p>
<p>Recall that the normal amount of calcium found in freshly mixed seawater (~400 mg/L) depends on a specific gravity of about 1.025 or salinity of about 35 parts per thousand (ppt).</p>
<p>Good laboratory practices should be followed to ensure consistent repeatable results. The manufacturer's directions are a good starting point - follow them! Treat the glass cuvettes with respect. Keep them clean, avoid using them if they become nicked, scratched or otherwise damaged. Don't allow the testing sample to sit for very long after the test is completed - this might result in inaccurate measurements and can stain the cuvette's glass. Don't add the powder reagent to the cuvette when it is in the Checker device. This invites fouling of the cuvette chamber, subsequent cleaning and the possibility of instrument damage.</p>
<p>Hanna's liquid reagents have a screw top with a snap ring to prevent spillage during shipping and for security reasons. Once the cap is removed, discard that annular ring remaining around the top. It is an accident waiting to happen - you'll eventually grasp that loose ring and spill the bottle's contents (I speak from experience!).</p>
<h3>The Meniscus</h3>
<p>Meniscus (from the Greek word <i>menikos</i> or "crescent") is a crescent shape formed at the surface of a liquid and its container. A concave meniscus is formed when the liquid adheres to the container. Figure 4 shows how to correctly read the surface of a concave meniscus.</p>
<div class="photo-wrapper"><a class="popup" href="review_album/image007.png" rel="gallery" title="Figure 4. For best accuracy, properly filling the reactor chamber (test tube or cuvette) is a must. The bottom of the curved water surface (meniscus) should be even with the top of the filling line. Observe this by holding the cuvette at eye level."><img src="review_album/image007.png/image_full" alt="image007.png" class="image-inline" /></a>
<p class="caption">Figure 4. For best accuracy, properly filling the reactor chamber (test tube or cuvette) is a must. The bottom of the curved water surface (meniscus) should be even with the top of the filling line. Observe this by holding the cuvette at eye level.</p>
</div>
<h3>An Inexpensive Cuvette Holder</h3>
<p>While on the subject of the cuvette - I highly recommend use of some sort of cuvette/test tube rack to minimize the chance of spillage during the testing procedure. You likely have one already if you have access to a basic laboratory. If not, and you've got a few bucks to spend, check with a local lab supplier or online vendor. A perfectly serviceable cuvette holder can be made by drilling an 18mm (11/16") hole in a short piece of dimensional lumber (such as a 2" x 4"). Cheap but effective.</p>
<h3>Tips on Sampling and Testing</h3>
<p>Test results will be only as good as the care taken during the sampling and testing procedures. Samples should be analyzed immediately (usually 'immediately' means with 15 minutes but this time can be stretched to perhaps an hour). If this is not possible the samples must be preserved.</p>
<h3>Sample Preservation Methods for Calcium and Iron</h3>
<p><i>Proper sample preservation requires use of reagents normally found only in a laboratory setting. For the vast majority of hobbyists, these procedures should be avoided by analyzing the sample immediately. Use of acidic and caustic reagents should not be attempted unless you have access to proper personal protection devices and are trained to use them while handling laboratory chemicals.</i></p>
<p>This procedure is required if the sample cannot be analyzed within an hour or so. For calcium, collect the sample in a pre-cleaned plastic or glass bottle (using a detergent followed by rinsing with 1:1 nitric acid and deionized water). Adjust pH to &lt;2 with nitric acid and refrigerate for up to six months at 4C (39F). Before analysis, warm the sample to room temperature and adjust the pH to ~7 with potassium hydroxide.</p>
<p>Iron samples should be collected in clean plastic or glass bottles. Adjust sample pH to &lt;2 with nitric acid and store at room temperature. Before analysis, adjust pH to 3-5 with sodium hydroxide.</p>
<h3>Waste Disposal</h3>
<p>None of the reagents used in the iron or calcium tests are particularly hazardous, but avoid contact or inhalation with any reagents. Wear all applicable personal safety devices. Reacted samples can be flushed down the drain. Note that the zincon calcium reagent has a tendency to stain.</p>
<h3>Thoughts of Product Quality Control in the Reef Aquarium Industry</h3>
<p>Like many, I was disturbed when I recently learned of heavy metals contamination of activated carbon marketed by a well-known international supplier of aquarium goods. For two months this company shipped potentially contaminated carbon. To their credit they recalled their product but real damage had been done to this company's reputation, not to mention the possible harm to more than a few aquarium inhabitants.</p>
<p>By chance, just a few days prior to this announcement, I attempted to mix a standard solution of calcium chloride (commercially available from this same marketer with a stated minimum guaranteed analysis of 33% calcium and a maximum of 37%). I calculated the amount required to mix a standard of just under 600 mg/L calcium. I have access to a relatively well-stocked wet lab and practiced conscientious laboratory techniques. Analyses were then performed by the Hanna Calcium Checker and checked against a Hanna laboratory-certified calcium standard. Test results were consistently below the expected concentration suggesting that 'guaranteed analyses' of the calcium chloride were incorrect. This revelation, followed by the incident described above, made me recall a few other events where marketers' hyperbole did not match results generated in my laboratory. In fact, I began purchasing laboratory equipment in the early 1990's due to 'too-good-to-be-true' claims made by a self-promoting and self-proclaimed aquarium 'guru'. Two phrases come to mind: 'Caveat emptor' and 'Trust but verify'.</p>
<h2></h2>
<h2>In Closing</h2>
<p>All items tested were obtained through normal retail channels.</p>
<p>Questions? Comments? Leave them in the comments section below. Private correspondence should be address to RiddleLabs@aol.com.</p>
</div> <br /><br /> <script type="text/javascript"><!-- google_ad_client = "ca-pub-5170032844807535"; /* Square250x250 */ google_ad_slot = "6862474606"; google_ad_width = 250; google_ad_height = 250; //--></script><script type="text/javascript" src="http://pagead2.googlesyndication.com/pagead/show_ads.js"></script>]]></content:encoded>
    <dc:publisher>No publisher</dc:publisher>
    
    <dc:creator>Dana Riddle</dc:creator>
    <dc:rights>Pomacanthus Publications, Inc.</dc:rights>
    
      <dc:subject>Hanna</dc:subject>
    
    
      <dc:subject>Calcium</dc:subject>
    
    
      <dc:subject>Hach</dc:subject>
    
    
      <dc:subject>Iron</dc:subject>
    
    
      <dc:subject>Chemistry</dc:subject>
    
    <dc:date>2012-04-18T15:00:00Z</dc:date>
    <dc:type>Page</dc:type>
  </item>


  <item rdf:about="http://www.advancedaquarist.com/2012/3/chemistry">
    <title>Aquarium Chemistry: Phosphate And Math: Yes You Need To Understand Both</title>
    <link>http://www.advancedaquarist.com/2012/3/chemistry</link>
    <description>Foods are by far the most important source of phosphate in most aquariums. In considering whether sources of phosphate other than foods are important, one must carefully look to the actual amounts involved to determine whether other sources are even worth trying to minimize.</description>
    <content:encoded xmlns:content="http://purl.org/rss/1.0/modules/content/"><![CDATA[<p><em><strong>Click through to see the images.</strong></em></p> <br /><div id="body">
<p><img src="chemistry_album/po4math2.jpg" alt="po4math2.jpg" class="image-inline" /></p>
<p><span class="dropcap">P</span>hosphate is an ion of great concern to reef aquarists. In fact, aside from calcium and alkalinity, it is probably the chemistry topic on which reef aquarists focus the most. Much of this concern is warranted, with phosphate potentially contributing to algae problems, poor coloration of corals and other invertebrates, and growth of most photosynthetic organisms. For these reasons, every reef should have a plan for export of phosphate in one or more ways, and the choices abound. Topics relating to desired target levels and the many export methods have been covered in detail <a href="http://reefkeeping.com/issues/2006-09/rhf/index.php">by me</a> and other authors in the past, and I won't dwell on them here.</p>
<p>What I will focus on relates to the various sources of phosphate in reef aquaria, and how important each one actually is to an operating aquarium. There have long been numerous misunderstandings of these source issues, but in the last two years it seems that these misunderstandings have become more common and are sometimes driving aquarists to unwarranted actions.</p>
<p>In part, I attribute this recent uptick in confusion to the newly available phosphate checkers from Hanna. Without getting into any discussion of their relative accuracy or the merits of using them, I think many aquarists are being lured into inappropriate actions by finding phosphate in various additives that they were not aware of previously. To paraphrase Field of Dreams: "Build it and they will find phosphate". In order for aquarists to interpret what these found values mean, they need to have an understanding of the overall phosphate balance in coral reef aquaria. This article strives to provide the understanding necessary to put phosphate issues into proper perspective.</p>
<p>So just for starters, let's see how many of you would be concerned by each of these scenarios:</p>
<ol>
<li>My purified fresh water I use for top off has 0.05 ppm phosphate in it. Since I'm trying to keep my tank at 0.02 ppm, that's obviously too much. What should I do?</li>
<li>I put a cube of my frozen fish food in a half cup of water and did a phosphate test on the water. I got a whopping value of 1.0 ppm!!! That's a huge problem, right?</li>
<li>I put a teaspoon of my GAC (granular activated carbon) in a glass of fresh water, and then tested the water for phosphate. It was dark blue and I could not even get a reading there was so much. Time to look for another brand, right?</li>
<li>I know I feed my fish and corals, but I carefully rinse my foods, use only frozen foods, and only feed enough that all is eaten. So I have no idea where my phosphate is coming from. Must be my RO/DI isn't working as there is no other possible source.</li>
</ol>
<p>Experience tells me that 95% or more of reef aquarists agree that the first three are problems to be solved, and at least half have the same feelings as expressed in number four. In reality, the first three are really not substantial issues at all and reefers need to understand why. Scenario four sums up the main point reefers need to understand: foods are the primarily source of phosphate in almost any aquarium that is being fed, regardless of the choice of foods and rinsing etc. In most aquaria, this source dominates all other sources by a factor of ten to a hundred or more, even if scenarios 1-3 are also true!</p>
<h2>Food Sources of Phosphate</h2>
<p>In order to begin to understand phosphate sources in aquaria, let's first look at foods. Contrary to what many suppose, phosphate is not something that can be avoided in a nutritious fish food. Phosphorus is present in many of the biomolecules of life, so every natural tissue that goes into a fish food will have substantial phosphorus in it. Phospholipids make up a substantial part of cell membranes. The genetic code of every organism is made of DNA, and that DNA contains a phosphate bridge between each base pair (Figure 1 shows how much phosphate is really in DNA). The way that all cells get energy is through conversion of ATP to ADP, and these molecules contain 3 and 2 phosphate moieties respectively (Figure 2).</p>
<div class="photo-wrapper"><a class="popup" href="chemistry_album/image001.jpg" rel="gallery" title="Figure 1. The structure of DNA as drawn by Madeleine Price Ball for Wikipedia. Phosphorus is shown in yellow."><img src="chemistry_album/image001.jpg/image_full" alt="image001.jpg" class="image-inline" /></a>
<p class="caption">Figure 1. The structure of DNA as drawn by Madeleine Price Ball for <a href="http://en.wikipedia.org/wiki/DNA">Wikipedia</a>. Phosphorus is shown in yellow.</p>
</div>
<div class="photo-wrapper"><a class="popup" href="chemistry_album/image003.jpg" rel="gallery" title="Figure 2. The structure of ATP showing the three phosphate moieties on the left hand side."><img src="chemistry_album/image003.jpg/image_full" alt="image003.jpg" class="image-inline" /></a>
<p class="caption">Figure 2. The structure of ATP showing the three phosphate moieties on the left hand side.</p>
</div>
<p>Most importantly for nutritional aspects of foods and phosphate, proteins contain phosphate. Many budding chemists understand that proteins are made of amino acids, and none of the standard amino acids contain phosphate, so where does the phosphate come from? It turns out that organisms attach phosphate to the hydroxyl group of the amino acids threonine and tyrosine in proteins to turn on and off many types of protein functions. Consequently, proteins often contain a lot of phosphate, making it very hard to make nutritionally complete foods without substantial phosphate. The relationship between phosphate and protein is so tight that people who suffer from excess phosphate (typically those with kidney disease, and especially those on dialysis) are unable to get enough protein without getting too much phosphate. These patients take oral phosphate binders to bind dietary phosphate before it is absorbed from their small intestines because restricting dietary phosphate just is not effective enough.</p>
<h2>Quantitation of Phosphate in Foods</h2>
<p>How much phosphate is in foods? A lot, but it does depend on the food. Some aquarium foods state on the label a minimum specified amount of phosphorus (phosphorus is the atom, P, at the center of a phosphate ion, PO<sub>4</sub><sup>---</sup>). Analyses of foods often quote an amount of phosphorus instead of phosphate as the unit of measure. Like feet and inches, these are just different units of measure of the same thing, and values of phosphorus are multiplied by 3.1 to get values to phosphate.</p>
<p>For foods that are intended for human consumption (such as shrimp or clams), we can look up known data on phosphorus content. Unfortunately, many manufacturers of aquarium foods do not supply phosphorus values and they are complex mixtures of many ingredients which preclude us from looking them up. Perhaps some manufacturers are concerned about scaring aquarists about the phosphate content. Fortunately<a href="http://web.archive.org/web/20010519165804/http:/www.animalnetwork.com/fish/data/foods.asp">, Ron Shimek</a> analyzed a variety of foods several years ago and this data set can also be used to understand how much phosphorus is in various commercial aquarium foods. Tables 1-3 contain data on the phosphorus and protein content of many aquarium foods, with Table 1 containing dry foods, Table 2 containing frozen foods, and Table 3 containing grocery store foods that are sometimes used in aquaria.</p>
<p>These raw phosphorus values alone allow us to know how much phosphorus is entering the aquarium by feeding a certain food, and we will use these numbers in several analyses later in this article. One must be wary of relying too much on such numbers for comparative purposes, however, since some foods have substantially more moisture or fillers in the food, which serve to drop the percent phosphorus, but are not necessarily better choices from a phosphorus standpoint. One simply needs to feed more of a wetter food than a drier one to attain the same total nutrition, offsetting the lower claimed phosphorus value.</p>
<p>One useful way to compare foods to each other is by comparing the phosphorus to protein ratio. In this crude way, we can eliminate effects due to moisture and fillers. Obviously this method has its own flaws since the nutritional value of foods is far more complex than a protein value alone provides, but it will allow us to understand among similar types of foods, which ones seem to provide more or less phosphorus. In order to help guide the reader, I have chosen to show the higher phosphorus to protein foods in red and the lower ones in green in Tables 1-3. The cutoff values I used are completely arbitrary, and one should definitely not make a choice of food based on this criterion alone. Nevertheless, several points are apparent:</p>
<ul>
<li>Dry and frozen foods vary substantially in phosphorus to protein content. There are high and low phosphorus foods in both categories. On balance, one could not say from this data that typical dry foods are any worse in this regard than are typical frozen foods.</li>
<li>With the exception of seaweeds, grocery store foods do generally seem to have a lower phosphorus to protein ratio than many other choices, although several Ocean Nutrition frozen foods are similarly low. This presumes that one is using grocery store foods that are not treated with phosphate to preserve freshness in the processing plant, but that is a concern for many of these materials.</li>
<li>Shrimp seem to be a standout in terms of a low protein to phosphorus ratio for grocery store foods.</li>
<li>Fish with bones have a high phosphorus content, since bones are modified calcium phosphate, but whether these bones are fully digested or not probably depends on what eats them and how long one otherwise waits for them to decompose.</li>
</ul>
<table class="listing nosort" id="table1">
<caption>Table 1. Phosphorus and protein content of some common dry aquarium foods.</caption> <thead> 
<tr>
<th>Food</th> <th>Protein (mg/g)</th> <th>Phosphorus (mg/g)</th> <th>Phosphorus/Protein(w/w)</th> <th>Source of Data</th>
</tr>
</thead> 
<tbody>
<tr>
<td>Brine Shrimp Direct Golden Pearls</td>
<td>550</td>
<td>15</td>
<td>0.027</td>
<td><a href="http://web.archive.org/web/20010519165804/http:/www.animalnetwork.com/fish/data/foods.asp">Shimek</a></td>
</tr>
<tr>
<td>Brine Shrimp Direct Plankton Gold Flakes</td>
<td>490</td>
<td>8.3</td>
<td>0.017</td>
<td><a href="http://web.archive.org/web/20010519165804/http:/www.animalnetwork.com/fish/data/foods.asp">Shimek</a></td>
</tr>
<tr>
<td>Cobalt Aquatics Brine Shrimp Flakes</td>
<td>440</td>
<td>10</td>
<td>0.023</td>
<td>Label</td>
</tr>
<tr>
<td>Cobalt Aquatics Spirulina Flakes</td>
<td>450</td>
<td>10</td>
<td>0.022</td>
<td>Label</td>
</tr>
<tr>
<td>IO Marine Chips Herbivore</td>
<td>460</td>
<td>9</td>
<td>0.020</td>
<td>Label</td>
</tr>
<tr>
<td>IO Marine Chips Omnivore</td>
<td>460</td>
<td>11</td>
<td>0.024</td>
<td>Label</td>
</tr>
<tr>
<td>IO Marine Grazing Block</td>
<td>40</td>
<td>0.5</td>
<td>0.013</td>
<td>Label</td>
</tr>
<tr>
<td>IO Marine Pellets Herbivore</td>
<td>440</td>
<td>10</td>
<td>0.023</td>
<td>Label</td>
</tr>
<tr>
<td>IO Marine Pellets Omnivore</td>
<td>470</td>
<td>12</td>
<td>0.026</td>
<td>Label</td>
</tr>
<tr>
<td>IO Seaweed Grazing Blocks</td>
<td>25</td>
<td>0.3</td>
<td>0.012</td>
<td>Label</td>
</tr>
<tr>
<td>Nutrafin Max Marine Angel Sinking Pellets</td>
<td>440</td>
<td>8</td>
<td>0.018</td>
<td>Label</td>
</tr>
<tr>
<td>OSI Marine Flake</td>
<td>470</td>
<td>6</td>
<td>0.013</td>
<td>Label</td>
</tr>
<tr>
<td>TetraAlgae Vegetable Enhanced Crisps</td>
<td>460</td>
<td>10</td>
<td>0.022</td>
<td>Label</td>
</tr>
<tr>
<td>TetraMarine Flakes</td>
<td>460</td>
<td>12</td>
<td>0.026</td>
<td>Label</td>
</tr>
<tr>
<td>TetraMarine Granules</td>
<td>440</td>
<td>14</td>
<td>0.032</td>
<td>Label</td>
</tr>
<tr>
<td>Vibragro Saltwater Staple</td>
<td>300</td>
<td>15</td>
<td>0.050</td>
<td><a href="http://web.archive.org/web/20010519165804/http:/www.animalnetwork.com/fish/data/foods.asp">Shimek</a></td>
</tr>
</tbody>
</table>
<table class="listing nosort" id="table2">
<caption>Table 2. Phosphorus and protein content of some common frozen aquarium foods.</caption> <thead> 
<tr>
<th>Food</th> <th>Protein (mg/g)</th> <th>Phosphorus (mg/g)</th> <th>Phosphorus/Protein(w/w)</th> <th>Source of Data</th>
</tr>
</thead> 
<tbody>
<tr>
<td>Direct Tahitian Blend Cryopaste</td>
<td>44</td>
<td>1.4</td>
<td>0.032</td>
<td><a href="http://web.archive.org/web/20010519165804/http:/www.animalnetwork.com/fish/data/foods.asp">Shimek</a></td>
</tr>
<tr>
<td>Frozen Plankton/Krill Brine Shrimp</td>
<td>88</td>
<td>1.6</td>
<td>0.018</td>
<td><a href="http://web.archive.org/web/20010519165804/http:/www.animalnetwork.com/fish/data/foods.asp">Shimek</a></td>
</tr>
<tr>
<td>Gamma Foods Lancefish</td>
<td>180</td>
<td>4.4</td>
<td>0.024</td>
<td><a href="http://web.archive.org/web/20010519165804/http:/www.animalnetwork.com/fish/data/foods.asp">Shimek</a></td>
</tr>
<tr>
<td>Hikari Bio-Pure Clam On A Half Shell</td>
<td>32.9</td>
<td>3</td>
<td>0.090<a name="_GoBack"></a></td>
<td>Label</td>
</tr>
<tr>
<td>Hikari Bio-Pure Clam On A Half Shell (meat only)</td>
<td>128.4</td>
<td>4.1</td>
<td>0.032</td>
<td>Label</td>
</tr>
<tr>
<td>Ocean Nutrition Frozen Formula 1</td>
<td>160</td>
<td>1.1</td>
<td>0.007</td>
<td><a href="http://web.archive.org/web/20010519165804/http:/www.animalnetwork.com/fish/data/foods.asp">Shimek</a></td>
</tr>
<tr>
<td>Ocean Nutrition Frozen Formula 2</td>
<td>62</td>
<td>1.2</td>
<td>0.019</td>
<td><a href="http://web.archive.org/web/20010519165804/http:/www.animalnetwork.com/fish/data/foods.asp">Shimek</a></td>
</tr>
<tr>
<td>Ocean Nutrition Frozen mysis</td>
<td>52</td>
<td>0.1</td>
<td>0.002</td>
<td>Label</td>
</tr>
<tr>
<td>Ocean Nutrition Frozen Prime Reef</td>
<td>130</td>
<td>0.9</td>
<td>0.007</td>
<td><a href="http://web.archive.org/web/20010519165804/http:/www.animalnetwork.com/fish/data/foods.asp">Shimek</a></td>
</tr>
<tr>
<td>Oregon Desert Brine Shrimp Company Silversides</td>
<td>42</td>
<td>4</td>
<td>0.095</td>
<td><a href="http://web.archive.org/web/20010519165804/http:/www.animalnetwork.com/fish/data/foods.asp">Shimek</a></td>
</tr>
<tr>
<td>San Francisco Brand Frozen Brine Shrimp</td>
<td>31</td>
<td>0.72</td>
<td>0.023</td>
<td><a href="http://web.archive.org/web/20010519165804/http:/www.animalnetwork.com/fish/data/foods.asp">Shimek</a></td>
</tr>
</tbody>
</table>
<table class="listing nosort" id="table3">
<caption>Table 3. Phosphorus and protein content of some common grocery store foods used in reef aquaria.</caption> <thead> 
<tr>
<th>Food</th> <th>Protein (mg/g)</th> <th>Phosphorus (mg/g)</th> <th>Phosphorus/Protein(w/w)</th> <th>Source of Data</th>
</tr>
</thead> 
<tbody>
<tr>
<td>Broccoli</td>
<td>30</td>
<td>0.66</td>
<td>0.022</td>
<td><a href="http://nutritiondata.self.com/facts/vegetables-and-vegetable-products/2816/2">analysis</a></td>
</tr>
<tr>
<td>Clams (no shell)</td>
<td>128</td>
<td>1.69</td>
<td>0.013</td>
<td><a href="http://nutritiondata.self.com/facts/finfish-and-shellfish-products/4180/2">analysis</a></td>
</tr>
<tr>
<td>Clams (no shell)</td>
<td>128</td>
<td>1.69</td>
<td>0.013</td>
<td><a href="http://lifestyle.iloveindia.com/lounge/health-benefits-of-clams-6922.html">analysis</a></td>
</tr>
<tr>
<td>Cod</td>
<td>179</td>
<td>1.74</td>
<td>0.010</td>
<td><a href="http://nutritiondata.self.com/facts/finfish-and-shellfish-products/4045/2">analysis</a></td>
</tr>
<tr>
<td>Cod</td>
<td>229</td>
<td>2.23</td>
<td>0.010</td>
<td><a href="http://lifestyle.iloveindia.com/lounge/nutritional-value-of-cod-6183.html">analysis</a></td>
</tr>
<tr>
<td>Eel</td>
<td>184</td>
<td>2.16</td>
<td>0.012</td>
<td><a href="http://nutritiondata.self.com/facts/finfish-and-shellfish-products/4051/2">analysis</a></td>
</tr>
<tr>
<td>Eel</td>
<td>186</td>
<td>2.16</td>
<td>0.012</td>
<td><a href="http://lifestyle.iloveindia.com/lounge/health-benefits-of-eel-7423.html">analysis</a></td>
</tr>
<tr>
<td>Kelp</td>
<td>17</td>
<td>0.42</td>
<td>0.025</td>
<td><a href="http://nutritiondata.self.com/facts/vegetables-and-vegetable-products/2617/2">analysis</a></td>
</tr>
<tr>
<td>Mackerel</td>
<td>186</td>
<td>2.17</td>
<td>0.012</td>
<td><a href="http://lifestyle.iloveindia.com/lounge/benefits-of-mackerel-8072.html">analysis</a></td>
</tr>
<tr>
<td>Mussel</td>
<td>119</td>
<td>1.97</td>
<td>0.017</td>
<td><a href="http://nutritiondata.self.com/facts/finfish-and-shellfish-products/4186/2">analysis</a></td>
</tr>
<tr>
<td>Nori</td>
<td>290</td>
<td>6.4</td>
<td>0.022</td>
<td><a href="http://web.archive.org/web/20010519165804/http:/www.animalnetwork.com/fish/data/foods.asp">Shimek</a></td>
</tr>
<tr>
<td>Octopus</td>
<td>149</td>
<td>1.86</td>
<td>0.013</td>
<td><a href="http://nutritiondata.self.com/facts/finfish-and-shellfish-products/4188/2">analysis</a></td>
</tr>
<tr>
<td>Oyster (no shell)</td>
<td>70</td>
<td>1.35</td>
<td>0.019</td>
<td><a href="http://nutritiondata.self.com/facts/finfish-and-shellfish-products/4189/2">analysis</a></td>
</tr>
<tr>
<td>Oyster (no shell)</td>
<td>71</td>
<td>1.35</td>
<td>0.019</td>
<td><a href="http://lifestyle.iloveindia.com/lounge/health-benefits-of-oyster-9049.html">analysis</a></td>
</tr>
<tr>
<td>Salmon</td>
<td>204</td>
<td>2.4</td>
<td>0.012</td>
<td><a href="http://nutritiondata.self.com/facts/finfish-and-shellfish-products/4258/2">analysis</a></td>
</tr>
<tr>
<td>Sardine</td>
<td>209</td>
<td>3.66</td>
<td>0.018</td>
<td><a href="http://lifestyle.iloveindia.com/lounge/health-benefits-of-sardines-9281.html">analysis</a></td>
</tr>
<tr>
<td>Scallops</td>
<td>168</td>
<td>2.19</td>
<td>0.013</td>
<td><a href="http://nutritiondata.self.com/facts/finfish-and-shellfish-products/4194/2">analysis</a></td>
</tr>
<tr>
<td>Shrimp</td>
<td>209</td>
<td>1.36</td>
<td>0.007</td>
<td><a href="http://nutritiondata.self.com/facts/finfish-and-shellfish-products/4174/2">analysis</a></td>
</tr>
<tr>
<td>Shrimp</td>
<td>210</td>
<td>0.7</td>
<td>0.004</td>
<td><a href="http://lifestyle.iloveindia.com/lounge/nutritional-value-of-cod-6183.html">analysis</a></td>
</tr>
<tr>
<td>Spirulina</td>
<td>59</td>
<td>1.1</td>
<td>0.019</td>
<td><a href="http://nutritiondata.self.com/facts/vegetables-and-vegetable-products/2764/2">analysis</a></td>
</tr>
<tr>
<td>Squid</td>
<td>156</td>
<td>2.2</td>
<td>0.014</td>
<td><a href="http://nutritiondata.self.com/facts/finfish-and-shellfish-products/4197/2">analysis</a></td>
</tr>
<tr>
<td>Wakame (seaweed)</td>
<td>30</td>
<td>0.8</td>
<td>0.027</td>
<td><a href="http://nutritiondata.self.com/facts/vegetables-and-vegetable-products/2766/2">analysis</a></td>
</tr>
</tbody>
</table>
<h2>Impact of Foods on the Aquarium Phosphate Balance</h2>
<p>Now we come to the heart of the issue. The actual amount of phosphorus present in foods and what it means. In order to understand the effects of foods, we need to understand what happens to them when added to an aquarium. Some aquarists are under the misconception that eaten foods do not contribute to the free phosphate in the water. Many aquarists are told the mantra of feeding only as much as is eaten, and they confound this idea with the assumption that when doing so, one minimizes the phosphate release. That idea is simply untrue.</p>
<p>A fish or other organism that eats foods takes in substantial phosphate, as shown above. But what happens to it? If the organism is not actually expanding in size (such as an adult green chromis, or a person), the phosphate that is taken in is almost entirely excreted back into the water. The only exception to that process is the very small amount of phosphorus that goes into eggs or sperm, and since in most aquaria those items are rapidly consumed by other organisms, the phosphorus will ultimately get into the water.</p>
<p>Growing organisms do take up a small amount of phosphorus from the diet and retain it in their growing tissues, but the emphasis is on small. A <a href="http://www.int-res.com/articles/meps/70/m070p263.pdf">study of a fish farm</a> with rapidly growing rainbow trout in the ocean showed that 78-82% of the phosphorus feed to the fish was lost to the environment. <a href="http://www.sciencedirect.com/science/article/pii/S0044848699002999">A second aquaculture study</a> using normal fish foods showed that 62% of the fed phosphate was released to the environment, with 35% being released as soluble phosphate available directly to algae, and 27% as phosphorus in fecal pellets (which if not removed, will break down in an aquarium releasing the phosphate again). <a href="http://www.sciencedirect.com/science/article/pii/S0044848603002175">Another study</a> showed that 81.5% of commercial diet phosphate was released to the environment, but that with a "special" diet with low phosphate and low fish meal this could be reduced to 64% lost. A <a href="http://www.sciencedirect.com/science/article/pii/S0044848697001452">fourth study</a> showed that growing fish fed slightly less phosphate than they need (to optimize theoretical uptake) take up and retain different phosphate sources differently. Using a purified protein diet, they observed retention of 72% of the phosphorus, 51% retention of phosphorus from added fish bone meal, and higher levels of uptake and retention for inorganic phosphate supplements (such as sodium phosphate).</p>
<p>This sort of study is of concern in aquaculture settings due to environmental contamination due to the released phosphorus and nitrogen. To my knowledge, however, it has never been done in a reef aquarium. Such phosphorus balance studies have also been performed in people for many years. In adults it is clear that nearly all phosphate taken up is excreted, mostly in the urine and some in the feces. Even in young <a href="http://jn.nutrition.org/content/10/4/373.full.pdf">growing children</a>, the amount of phosphorus retained from the diet is only 5-20% of that consumed, with 80-95% excreted in the urine and feces. While such studies are fairly far removed from reef aquaria, they do supporting the idea that organisms take in a lot more phosphorus than they retain, even when growing.</p>
<p>Consequently, reef aquarists should expect that much of the phosphorus added to a reef aquarium in the form of foods ultimately ends up in the water as phosphate. Whether that portion getting into the water is 95% or 35% won't substantially impact the conclusions below that foods add a very large amount of phosphate.</p>
<h2>Quantitation of the Food Impact Aquarium Phosphate</h2>
<p>Using the assumption that most of the phosphorus present in foods ultimately ends up as phosphate in the aquarium, we can calculate roughly what that effect is. Even if the actual number is a half or a quarter of that added, getting the ballpark information is very useful to gauge the importance of this phosphate source. Obviously the calculated value depends on how much of what is fed to what size aquarium.</p>
<p>Table 4 shows a variety of possible feeding schemes that an aquarist might use on a hypothetical 100 gallon (379 L; actual water volume) aquarium. Aquarists can decide for themselves how these regimens compare to their own feed schedules.</p>
<table class="listing nosort" id="table4">
<caption>Table 4. Phosphate additions to a 100 gallon actual water volume aquarium with different daily feeding regimens.</caption> <thead> 
<tr>
<th>Foods Fed</th> <th>Phosphorus Added Daily (mg)</th> <th>Equivalent Phosphate Added Daily (mg)</th> <th>Equivalent Phosphate Concentration Added Daily (ppm)</th>
</tr>
</thead> 
<tbody>
<tr>
<td>1 Prime Reef Cube</td>
<td>2.7</td>
<td>8.4</td>
<td>0.022</td>
</tr>
<tr>
<td>1 Prime Reef Cube1 Formula 1 Cube</td>
<td>6.0</td>
<td>18.6</td>
<td>0.049</td>
</tr>
<tr>
<td>1 Formula 2 Cube1 Mysis Cube</td>
<td>3.9</td>
<td>12.1</td>
<td>0.032</td>
</tr>
<tr>
<td>IO Marine Omnivore Chips (2 g)</td>
<td>22</td>
<td>68</td>
<td>0.18</td>
</tr>
<tr>
<td>IO Marine Omnivore Chips (1 g)Silversides (1/2 teaspoon)Nori (2.5 g = large sheet)</td>
<td>37</td>
<td>115</td>
<td>0.30</td>
</tr>
</tbody>
</table>
<p>Obviously there is a big range depending on how much is fed. What is surprising to many folks, however, is how large that number is relative to typical target levels of phosphate in reef aquaria, which might be something like 0.03 ppm or less. Even the light feeding of a single cube of a relatively low phosphate frozen food to this aquarium supplied most of that target amount in a single feeding. Heavy feeding added ten times that amount in a single day. <b>In short, this high daily addition rate is why phosphate control is often very difficult or reef aquaria.</b></p>
<h2>Rinsing Foods and the Effect on Phosphate</h2>
<p>Now that we have some information on the phosphate in foods, we can critically examine the concern that many aquarists have about foods, and specifically their rinsing of frozen foods before use. A typical test you see is someone taking a cube of fish food, thawing it, and putting it into a half cup of water. They then test that water for phosphate and find it "off the charts". Let's assume that means 1 ppm phosphate, which would give a very dark blue color in many phosphate tests. Bear in mind this is a thought problem, not an actual measured value, but it is typical of what people think the answer is.</p>
<p>Is that a lot of phosphate? Well, there are two ways to think of the answer.</p>
<p>The first way is as a portion of the total phosphate in that food. A half cup of water at 1 ppm (1 mg/L) phosphate contains a total of 0.12 mg of phosphate. A cube of Formula 2 contains about 11.2 mg of phosphate. <b>So the hypothetical rinsing step has removed about 1 percent of the phosphate in that food.</b> Not really worthwhile, in my opinion, but that decision is one every aquarist can make for themselves.</p>
<p>The second way to look at this rinsing is with respect to how much it reduces the boost to the aquarium phosphate concentration. Using the same calculation as above of 0.12 mg of phosphate, and adding that to 100 gallons total water volume, we find that phosphate that was rinsed away would have boosted the "in tank" phosphate concentration by 0.12 mg/379 L = 0.0003 ppm. <b>That amount washed away does not seem significant with respect to the "in tank" target level of about 50-100 times that level</b> (say, 0.015 to 0.03 ppm), <b>nor does it seem significant relative to the total amount of phosphate actually added each day in foods (which is perhaps 50-1000 times as much</b>, based on input rates from Table 4. Again, the conclusion I make is that rinsing is not really worthwhile, in my opinion.</p>
<h2>Comparison of Food Sources of Phosphate to Other Sources</h2>
<p>What about other sources of phosphate, like the "crappy" RO/DI water containing 0.05 ppm phosphate? A similar analysis will show it equally unimportant relative to foods.</p>
<p>Let's assume that the aquarist in question adds 1% of the total tank volume each day with RO/DI to replace evaporation. Simple math shows that the 0.05 ppm in the RO/DI becomes 0.0005 ppm added each day to the phosphate concentration in the aquarium. That dilution step is critical, taking a scary number like 0.05 ppm down to an almost meaningless 0.0005 ppm daily addition. Since that 0.0005 ppm is 40-600 times lower than the amount added each day in foods (Table 4), it does not seem worthy of the angst many aquarists put on such measurements. That said, <a href="../../2004/1/chemistry">tap water</a> could have as much as 5 ppm phosphate, and that value could then become a dominating source of phosphate and would be quite problematic. Purifying tap water is important for this and many other reasons.</p>
<p>The same sort of calculation applies to analyzing other phosphate issues, such as the GAC in scenario three. The issue of finding "high" phosphate in GAC soaked in fresh water was frequently quoted as a reason to use one or the other brand of GAC, and probably still is. But simple analysis as shown above for the food rinsing puts the lie to this being a big problem.</p>
<p>One needs to consider how much GAC one will really use in the aquarium and how often it is added in order to interpret how important the added phosphate is. A typical recommendation might be 1 cup of GAC per 100 gallons of aquarium water, and to change it in 4-6 weeks. Let's assume we detect 0.5 ppm phosphate when a teaspoon is placed in a cup of water, and we get scared by the dark blue color during the test. Is this reasonable? That 0.5 ppm from a teaspoon in a cup of water translates to 0.015 ppm phosphate when a cup is used in 100 gallons.</p>
<p>That 0.015 ppm may be significant, being a typical target concentration level for reef aquaria and amounting to about half to a twentieth of the amount added daily in foods, but remember, it is used for 4-6 weeks. During those 4-6 weeks before the next replacement, foods add 50-700 times as much phosphate. So while it is not unreasonable to look for another brand of GAC, to blame phosphate or algae issues in the aquarium on its use would stretch credibility because it is a very tiny portion of the total phosphate being added.</p>
<h2>Conclusion</h2>
<p>Foods are by far the most important source of phosphate in most aquariums. While there are big variations between foods, it does not appear in this analysis that dry foods are the nasties they are often made out to be, relative to frozen foods. There are better and poorer choices (with respect to phosphate) to be made within each food type. Avoiding foods with bones, however, might be worthwhile if delivering less phosphate is a goal. Additionally, fresh grocery store shrimp seems to be one of the best foods from this standpoint.</p>
<p>In considering whether sources of phosphate other than foods are important, one must carefully look to the actual amounts involved to determine whether other sources are even worth trying to minimize. It can be scary to learn that your purified fresh water has phosphate in it, or that your salt mix has detectable phosphate, or that your supplements or whatever have some phosphate. But just because you detect something, and maybe you even detect a concentration far higher than in your aquarium, that does not by any means imply that those sources are significant enough to warrant some sort of corrective action. Our analytical tools have become fairly sensitive, allowing us to detect things which might sound like trouble, but really aren't. We need to understand the various dilution issues involved as well as the overall phosphate balance in a reef aquarium to evaluate the importance of different measurements.</p>
<p>Just use some math and put it all into perspective, before using some dollars or time to chase a trivial "problem".</p>
<p>Happy Reefing</p>
</div> <br /><br /> <script type="text/javascript"><!-- google_ad_client = "ca-pub-5170032844807535"; /* Square250x250 */ google_ad_slot = "6862474606"; google_ad_width = 250; google_ad_height = 250; //--></script><script type="text/javascript" src="http://pagead2.googlesyndication.com/pagead/show_ads.js"></script>]]></content:encoded>
    <dc:publisher>No publisher</dc:publisher>
    
    <dc:creator>Randy Holmes-Farley, Ph.D.</dc:creator>
    <dc:rights>Pomacanthus Publications, Inc.</dc:rights>
    
      <dc:subject>Food</dc:subject>
    
    
      <dc:subject>Chemistry And The Aquarium</dc:subject>
    
    
      <dc:subject>Phosphate</dc:subject>
    
    
      <dc:subject>Aquarium Chemistry</dc:subject>
    
    
      <dc:subject>Phosphates</dc:subject>
    
    
      <dc:subject>Chemistry</dc:subject>
    
    
      <dc:subject>Randy Holmes-Farley</dc:subject>
    
    <dc:date>2012-03-21T13:00:00Z</dc:date>
    <dc:type>Page</dc:type>
  </item>


  <item rdf:about="http://www.advancedaquarist.com/2012/3/aafeature">
    <title>Feature Article: Spectral Distributions of LEDs: AI-Sol, Radion, Orphek, EcoRay, Mvava</title>
    <link>http://www.advancedaquarist.com/2012/3/aafeature</link>
    <description>In addition to the characterization of light by its intensity and distribution, the spectral distribution is also of interest. Light sources emit light at varying amounts at different wavelengths. Spectral distribution characterizes the light output across different wavelengths of the light spectrum.</description>
    <content:encoded xmlns:content="http://purl.org/rss/1.0/modules/content/"><![CDATA[<p><em><strong>Click through to see the images.</strong></em></p> <br /><div id="body">
<p><img src="aafeature_album/spectralLED2.jpg" alt="spectralLED2.jpg" class="image-inline" /></p>
<p><span class="dropcap">T</span>he wavelength of visible light is between 400-700nm. Incidentally, these also happen to be the majority of wavelengths of light that are relevant to photosynthesis. The combined effect of the complete range of radiation between 400-700nm appears as white light to the human eye. Radiation with a wavelength of 400 nm generates a response in the human eye that makes it perceived as violet, while radiation with a wavelength of 700nm appears red. The different colors of the rainbow (ROYGBV - red, orange, yellow, green, blue and violet) are arranged in descending order of their wavelength. Roughly, we can break down the various colors into wavelength bands as follows:</p>
<ul>
<li>Violet - 400 to 440nm</li>
<li>Blue - 440 to 490nm</li>
<li>Green - 490 to 540nm</li>
<li>Yellow - 540 to 590nm</li>
<li>Orange - 600 to 650nm</li>
<li>Red - 650 to 700nm</li>
</ul>
<p>Radiation below 400 nm wavelength is called ultraviolet (UV) radiation, and is typically divided into three segments: UV-A (400-315nm), UV-B (315-280nm) and UV-C (280-100nm). UV radiation is not visible to the human eye, but it can have a damaging impact on humans (as well as corals). The UV-A segment, the most common in sunlight, overlaps slightly with the shortest wavelengths in the visible portion of the spectrum. UV-B is effectively the most destructive UV radiation from the sun, because it penetrates the atmosphere and can injure biological tissues. UV-C radiation from the sun would cause even more injury, but it is absorbed by the atmosphere, so it almost never reaches the Earth's surface.</p>
<p>Infrared (IR) radiation has slightly longer wavelengths than visible light. The IR region of the electromagnetic spectrum is also divided into three segments: IR-A (780-1400 nm), IR-B (1400-3000 nm) and IR-C (3000-10600 nm). Infrared radiation is thermal and is felt as heat.</p>
<p>A typical spectral distribution of a light source is measured using an instrument called a spectroradiometer. A spectroradiometer simply is an instrument that has a sensor and associated hardware and software to determine the distribution of energy (measured as power density in Watts/m<sup>2</sup>) at different wavelengths of the electromagnetic spectrum. The power density at different wavelengths is also called the spectral irradiance. The data is usually displayed as a graph with the wavelength on the X-axis and the spectral irradiance on the Y-axis, and is called the <i>Spectral Power Distribution</i> (SPD) plot. One such SPD plot is shown in Figure 1 below. This is the most important piece of information about a light source, and all relevant light measures can be mathematically derived from it. A point of note here - since the measurement is in terms of watts/m<sup>2</sup>, changing the distance of the light source to the sensor will result in a change in the absolute measured values. Hence for comparison purposes, either the measurements must be made at the same distance or the data scaled and normalized.</p>
<p>The spectral distribution of light from the Metal Halide lamps has been characterized extensively in earlier research ( see <a href="http://www.manhattanreefs.com/lighting">http://www.manhattanreefs.com/lighting</a> for a catalog of spectral output of various metal halide lamps). However, little is known about the spectral characteristics of the LEDs currently available to the hobby and how they compare to the spectral characteristics of the metal halide and other light sources that have been used successfully in the past to maintain reef aquariums. The spectral characteristics of light impact both the coral and photosynthetic organisms and the visual aesthetics of the aquarium.</p>
<div class="photo-wrapper"><a class="popup" href="aafeature_album/figure_1_example_spd.jpg" rel="gallery" title="Figure 1: Example of a Spectral Power Distribution plot"><img src="aafeature_album/figure_1_example_spd.jpg/image_full" alt="figure_1_example_spd.jpg" class="image-inline" /></a>
<p class="caption">Figure 1: Example of a Spectral Power Distribution plot</p>
</div>
<p>Most of the new LED fixtures for reef lighting are configured with a mix of blue and white LEDs, or more recently with 4 or more different colored LEDs. The resulting light is a blend of the light output of the various LED colors. The light intensity and spectrum is typically a simple additive effect of the individual spectral output of the various LEDs.</p>
<h2>Methods and Approach</h2>
<p>For the purpose of this study, several popular LED fixtures (Table 1) were analyzed for their spectral distribution. The spectral distributions were measured using the Licor LI-1800 spectroradiometer. The spectral data was collected from the various LEDs and normalized such that integrated light output (spectral irradiance) between the wavelengths of 400-700 nm was 100 Watts/m<sup>2</sup>. Data was collected at full power output for the individual channels of light control (eg. Blue, white) along with data with ALL LEDs on at full power. The data was normalized so that the full output was at 100 Watts/m<sup>2</sup> over the wavelength range 400-700 nm. The various LED color outputs were then scaled by the same scale factor to allow of determination of the contribution of the various LEDs to the full output. The results are plotted as a SPD plot. Additionally, the spectrum is compared to two popular metal halide lamps - 400W Radium driven by a HQI ballast and a 400W Ushio 14000K driven by an Icecap Electronic ballast. The Radium 400W is a popular bulb among reef aquarists who prefer a "blue" look to the tank, and the 14000K Ushio is the bulb that I currently use on my tank and is a preferred choice for those who prefer a whiter look to the tank. Based on vast amounts of reported success with these lamps, these 2 were chosen as a reference to compare the light spectrum of the various LED fixtures.</p>
<table class="listing nosort" id="table1">
<caption>Table 1: LED Fixtures evaluated for Spectral Output</caption> <thead> 
<tr>
<th>Fixtures</th>
</tr>
</thead> 
<tbody>
<tr>
<td>Radion X30</td>
</tr>
<tr>
<td>Orphek PR-156</td>
</tr>
<tr>
<td>Ecoray 112</td>
</tr>
<tr>
<td>Mvava-2</td>
</tr>
<tr>
<td>Aquaillumination SOL White</td>
</tr>
<tr>
<td>Aquaillumination SOL Blue</td>
</tr>
<tr>
<td>Aquaillumination SOL Warm White</td>
</tr>
</tbody>
</table>
<h3>Radion XR30W</h3>
<p>The Ecotech Radion is one of the few LEDs that offers multiple color LEDs, with 2 types of LED blue, white, green and red leds. A total of 8 Cree XP-G Cool White LEDs run at 5W each, 8 Cree XP-E Blue LEDs run at 3W each, 10 Cree XP-E Royal Blue LEDs run at 3W each, 4 Cree XP-E Green LEDs run at 3W each and 4 Osram Oslon SSL Hyper Red LEDs run at 3W each. There are 4 separate channels of control that allow user to customize the light output by adjusting the output of the various channels independently via software program.</p>
<p>The contribution of each of the individual LEDs at full power to the overall resultant spectrum is seen in the figure 2a below. As seen from the figure the final resultant spectrum in a sum of the output of the different spectrums. This is one of the few LEDs with green and red LEDs, in an effort to provide a wider coverage of the light spectrum. The addition of the red leds help improve the color rendition especially for the red/pink corals as well as fish. Also, Chlorophyll in corals has an absorption band in the red region, hence it is speculated that the addition of red will enhance photosynthesis. Figure 2b shows how this compares to the Metal Halide lamps. It is interesting to note that the amount of Red spectrum is quite comparable to that of Radium.</p>
<div class="photo-wrapper"><a class="popup" href="aafeature_album/figure_2a_radion_vs_mh.jpg" rel="gallery" title="Figure 2a. Spectral Output of the different LED components - Radion XR30W"><img src="aafeature_album/figure_2a_radion_vs_mh.jpg/image_full" alt="figure_2a_radion_vs_mh.jpg" class="image-inline" /></a>
<p class="caption">Figure 2a. Spectral Output of the different LED components - Radion XR30W</p>
</div>
<div class="photo-wrapper"><a class="popup" href="aafeature_album/figure_2_radion_spectrums.jpg" rel="gallery" title="Figure 2b. Spectral Output of the Radion XR30W compared to Metal Halide"><img src="aafeature_album/figure_2_radion_spectrums.jpg/image_full" alt="figure_2_radion_spectrums.jpg" class="image-inline" /></a>
<p class="caption">Figure 2b. Spectral Output of the Radion XR30W compared to Metal Halide</p>
</div>
<h3>Orphek PR-156</h3>
<p>The Orphek array PR-156 is one of the newer models that includes 4 UV LEDs, in addition to the blue and white LEDs. A total of 60 LEDs running at around 2W each make up the complete array. The UV LEDs cannot be individually controlled, hence their output is combined with the main output with all LEDs turned ON. As seen in the figure 3a, the UV LEDs show in the spectral plot between 350 and 400 nm. The amount of UV is still less than what is output by the metal halide lamps as seen in Figure 3b. The Orphek PR 156 allows the moon lights to be controlled separately.</p>
<div class="photo-wrapper"><a class="popup" href="aafeature_album/figure_3a_orphek_pr156_vs_mh.jpg" rel="gallery" title="Figure 3a. Spectral Output of the different LED components - Orphek PR-156"><img src="aafeature_album/figure_3a_orphek_pr156_vs_mh.jpg/image_full" alt="figure_3a_orphek_pr156_vs_mh.jpg" class="image-inline" /></a>
<p class="caption">Figure 3a. Spectral Output of the different LED components - Orphek PR-156</p>
</div>
<div class="photo-wrapper"><a class="popup" href="aafeature_album/figure_3_orphek_pr_156_spectrums.jpg" rel="gallery" title="Figure 3b. Spectral Output of the Orphek PR156 as compared to Metal Halide"><img src="aafeature_album/figure_3_orphek_pr_156_spectrums.jpg/image_full" alt="figure_3_orphek_pr_156_spectrums.jpg" class="image-inline" /></a>
<p class="caption">Figure 3b. Spectral Output of the Orphek PR156 as compared to Metal Halide</p>
</div>
<h3>Ecoray 112</h3>
<p>Similar to the Ecoray 60 in design, this is the larger version with 112 LEDs - 56 White High Power 1 Watt LED, (color temperature 12000K - 160000K) and 56 Blue Actinic High Power 1 Watt LED (Wave Length 450-460 nm) arranged in a 8X14 grid. The white and blue LEDs can be controlled separately, only in 2 states ON or OFF. The spectral output for the different channels and all LEDs ON is shown in figure 4a along with the comparison to metal halide in figure 4b.</p>
<div class="photo-wrapper"><a class="popup" href="aafeature_album/figure_4a_ecoray_112_vs_mh.jpg" rel="gallery" title="Figure 4a. Spectral Output of the different LED components - Ecoray 112"><img src="aafeature_album/figure_4a_ecoray_112_vs_mh.jpg/image_full" alt="figure_4a_ecoray_112_vs_mh.jpg" class="image-inline" /></a>
<p class="caption">Figure 4a. Spectral Output of the different LED components - Ecoray 112</p>
</div>
<div class="photo-wrapper"><a class="popup" href="aafeature_album/figure_4_ecoray_112_spectrum.jpg" rel="gallery" title="Figure 4b. Spectral Output of the EcoRay 112 compared to Metal Halide"><img src="aafeature_album/figure_4_ecoray_112_spectrum.jpg/image_full" alt="figure_4_ecoray_112_spectrum.jpg" class="image-inline" /></a>
<p class="caption">Figure 4b. Spectral Output of the EcoRay 112 compared to Metal Halide</p>
</div>
<h3>MVAVA-II</h3>
<p>MVAVA II LED array (<a href="http://www.mvava.com/index.html">http://www.mvava.com/index.html</a>) comprised 56 1W Blue LED and 8 10W multichip White LEDs, in a ON/OFF control configuration. Figure 5a shows the output of the individual channels and figure 5b shows how it compares to metal halide lamps.</p>
<div class="photo-wrapper"><a class="popup" href="aafeature_album/figure_5a_mvava2_vs_mh.jpg" rel="gallery" title="Figure 5a. Spectral Output of the different LED components - Mvava II"><img src="aafeature_album/figure_5a_mvava2_vs_mh.jpg/image_full" alt="figure_5a_mvava2_vs_mh.jpg" class="image-inline" /></a>
<p class="caption">Figure 5a. Spectral Output of the different LED components - Mvava II</p>
</div>
<div class="photo-wrapper"><a class="popup" href="aafeature_album/figure_5_mava2_spectrum.jpg" rel="gallery" title="Figure 5b. Spectral Output of the MVAVA II compared to Metal Halide"><img src="aafeature_album/figure_5_mava2_spectrum.jpg/image_full" alt="figure_5_mava2_spectrum.jpg" class="image-inline" /></a>
<p class="caption">Figure 5b. Spectral Output of the MVAVA II compared to Metal Halide</p>
</div>
<h3>Aquaillumination - SOL White</h3>
<p>Aqua Illumination SOL White comprised 24 LEDs in the ratio of 2 Whites: 1 Blue. 16 CREE XPG White and 8 CREE XPE Blue, with custom designed light collimators were used in each module. A single 12" module was tested. These LEDs come standard with a controller that allows infinite control of the blue and white channels. Figure 6a shows the spectral output of the individual channels at full output and figure 6b shows the comparison to metal halides.</p>
<div class="photo-wrapper"><a class="popup" href="aafeature_album/figure_6a_sol_white_vs_mh.jpg" rel="gallery" title="Figure 6a. Spectral Output of the different LED components - AI Sol White"><img src="aafeature_album/figure_6a_sol_white_vs_mh.jpg/image_full" alt="figure_6a_sol_white_vs_mh.jpg" class="image-inline" /></a>
<p class="caption">Figure 6a. Spectral Output of the different LED components - AI Sol White</p>
</div>
<div class="photo-wrapper"><a class="popup" href="aafeature_album/figure_6_ai_sol_white_spectrum.jpg" rel="gallery" title="Figure 6b. Spectral Output of the AI Sol White as compared to Metal Halide"><img src="aafeature_album/figure_6_ai_sol_white_spectrum.jpg/image_full" alt="figure_6_ai_sol_white_spectrum.jpg" class="image-inline" /></a>
<p class="caption">Figure 6b. Spectral Output of the AI Sol White as compared to Metal Halide</p>
</div>
<h3>Aquaillumination - SOL BLUE</h3>
<p>The SOL Blue is similar in construction to the SOL White, with the primary difference being the ratio of blue to white LEDs. 8 Blue and 8 Royal Blue LEDs comprise the blue channel and 8 white LEDs comprise the white channel each of which can be controlled separately. <i>(Note that these were tested before updating the controller and hence the blue and royal blue could not be controlled separately)</i>. Figure 7a shows the output of the different channels blue and white, and figure 7b shows the comparison with metal halide lamps.</p>
<div class="photo-wrapper"><a class="popup" href="aafeature_album/figure_7a_sol_blue_vs_mh.jpg" rel="gallery" title="Figure 7a. Spectral Output of the different LED components - AI Sol Blue"><img src="aafeature_album/figure_7a_sol_blue_vs_mh.jpg/image_full" alt="figure_7a_sol_blue_vs_mh.jpg" class="image-inline" /></a>
<p class="caption">Figure 7a. Spectral Output of the different LED components - AI Sol Blue</p>
</div>
<div class="photo-wrapper"><a class="popup" href="aafeature_album/figure_7_ai_sol_blue_spectrum.jpg" rel="gallery" title="Figure 7b. Spectral Output of the AI Sol Blue as compared to Metal Halide"><img src="aafeature_album/figure_7_ai_sol_blue_spectrum.jpg/image_full" alt="figure_7_ai_sol_blue_spectrum.jpg" class="image-inline" /></a>
<p class="caption">Figure 7b. Spectral Output of the AI Sol Blue as compared to Metal Halide</p>
</div>
<h3>AI Nano Sol (with warm white)</h3>
<p>The fixture includes is a miniature version of the larger SOL White and SOL blue. With (2) Warm White XM-Ls, (4) Blue Cree XP-Es and (4) Royal Blue Cree XP'Es mounted in a pair of LED clusters. The controllers provides 3 channels of control one for each color allowing each to be controlled from 0-100% output. Figure 8a shows the light output of the various channels and figure 8b compares it to the metal halide spectrum.</p>
<div class="photo-wrapper"><a class="popup" href="aafeature_album/figure_8a_nano_sol_vs_mh.jpg" rel="gallery" title="Figure 8a. Spectral Output of the different LED components - AI Sol Nano"><img src="aafeature_album/figure_8a_nano_sol_vs_mh.jpg/image_full" alt="figure_8a_nano_sol_vs_mh.jpg" class="image-inline" /></a>
<p class="caption">Figure 8a. Spectral Output of the different LED components - AI Sol Nano</p>
</div>
<div class="photo-wrapper"><a class="popup" href="aafeature_album/figure_8_ai_nano_sol_warm.jpg" rel="gallery" title="Figure 8b. Spectral Output of the AI Sol Nano as compared to Metal Halide"><img src="aafeature_album/figure_8_ai_nano_sol_warm.jpg/image_full" alt="figure_8_ai_nano_sol_warm.jpg" class="image-inline" /></a>
<p class="caption">Figure 8b. Spectral Output of the AI Sol Nano as compared to Metal Halide</p>
</div>
<h2>Discussion</h2>
<p>As seen from the data, there are significant spectral differences between the LED spectrum and those of the most popular MH lamps. The LEDs tend to have more output in the blue regions 400-500 nm range, while lacking in the warmer regions of the spectrum. This could explain why the aquariums tend to have a "flat" look when lit by LEDs. Lack of the red spectrum results in corals and fish with red color to look lack lustre. Lack of a broader spectrum and missing quantities of output at wavelengths to promote a more full spectrum is often a concern cited with LEDs, and it is obvious when comparing the spectrums to metal halides. As seen from the newer generation of LEDs there is an attempted to address this by providing more choice of colors (and channels of control) to allow tweaking of individual channels to enable users to fine tune the look of the aquariums and provide the ability to have one light fixture with the potential to satisfy a wide range of users.</p>
<p>There are some difference between the spectral output of the LED fixtures, especially outside the blue spectrum. These differences seen in Figure 9, are primarily due to the differences in the white LEDs being used and the quantity of white light. The figure below shows how the different LED fixture compare against each other and the differences between the spectral output.</p>
<div class="photo-wrapper"><a class="popup" href="aafeature_album/figure_9_comparison_of_all_led_spectrums.jpg" rel="gallery" title="Figure 9."><img src="aafeature_album/figure_9_comparison_of_all_led_spectrums.jpg/image_full" alt="figure_9_comparison_of_all_led_spectrums.jpg" class="image-inline" /></a>
<p class="caption">Figure 9.</p>
</div>
<p>These spectral difference will impact the visual look of the aquarium as well have some impact on the colors that develop in the corals. It should be noted that these spectral plots are measured with all lights at 100%, while in practice some users may dim certain colors to create a look that suits them and their perception of how a tank should look. What is obvious, from looking at the individual graphs is that the resulting light spectrum will be a direct addition of the spectral output of the various component lamps. In this regard the LEDs definitely provide a significant advantage over the traditional one bulb one look approach of metal halide lighting. The data presented here should be viewed in conjunction with the distributed data presented in my earlier articles provided in the references.</p>
<h2>References</h2>
<ol>
<li>S. Joshi, <a href="../../2010/2/aafeature2">Quantitative Comparison of Lighting Technologies: Metal Halide, T5 Fluorescent and LED</a>, Advanced Aquarist, Vol. IX, Feb. 2010</li>
<li>S. Joshi, <a href="../../2010/5/aafeature2">LED Lighting Tests: Aquaillumination, Blue Moon, Eco-Lamp KR-91, Ecoxotic Panorama</a>, Advanced Aquarist, Vol. IX, May 2010.</li>
<li>S. Joshi, <a href="../../2011/8/aafeature">LED Lighting Tests: Ecoray, Reef Fanatic, and MaxSpect</a>, Advanced Aquarist, Vol. X, Aug. 2011.</li>
<li>S. Joshi, <a href="../1/aafeature">LED Lighting Tests: Radion, Orphek, Mvava, Ecoray and Ecoxotic</a>, Advanced Aquarist, Vol. X1, Jan. 2012.</li>
</ol></div> <br /><br /> <script type="text/javascript"><!-- google_ad_client = "ca-pub-5170032844807535"; /* Square250x250 */ google_ad_slot = "6862474606"; google_ad_width = 250; google_ad_height = 250; //--></script><script type="text/javascript" src="http://pagead2.googlesyndication.com/pagead/show_ads.js"></script>]]></content:encoded>
    <dc:publisher>No publisher</dc:publisher>
    
    <dc:creator>Sanjay Joshi</dc:creator>
    <dc:rights>Pomacanthus Publications, Inc.</dc:rights>
    
      <dc:subject>LED</dc:subject>
    
    
      <dc:subject>Ecotech</dc:subject>
    
    
      <dc:subject>Aqua Illumination</dc:subject>
    
    
      <dc:subject>Spectrum</dc:subject>
    
    
      <dc:subject>Lighting</dc:subject>
    
    
      <dc:subject>Orphek</dc:subject>
    
    
      <dc:subject>Sanjay Joshi, Ph.D.</dc:subject>
    
    
      <dc:subject>Ecoray</dc:subject>
    
    
      <dc:subject>Mvava</dc:subject>
    
    
      <dc:subject>Radion</dc:subject>
    
    <dc:date>2012-03-07T15:00:00Z</dc:date>
    <dc:type>Page</dc:type>
  </item>


  <item rdf:about="http://www.advancedaquarist.com/2012/2/chemistry">
    <title>Aquarium Chemistry: Effects of GFO (Granular Ferric Oxide) on 'Trace' Metals Concentrations in Artificial Seawater</title>
    <link>http://www.advancedaquarist.com/2012/2/chemistry</link>
    <description>Granular Ferric Oxide (GFO) is popular among reef hobbyists as a means to decrease phosphate levels and subsequently algal growth in their tanks. GFO, however, can also affect other ions and compound levels as well. In this article, Dana investigates the effect that GFO has on our tanks outside of decreasing phosphate levels.</description>
    <content:encoded xmlns:content="http://purl.org/rss/1.0/modules/content/"><![CDATA[<p><em><strong>Click through to see the images.</strong></em></p> <br /><div id="body">
<p><img src="chemistry_album/GFO2a.jpg" alt="GFO2a.jpg" class="image-inline" /></p>
<p><span class="dropcap">U</span>se of Granular Ferric Oxide (GFO, or iron oxide hydroxide) is a popular and effective means to reduce reactive phosphate (a non-metal) concentrations in aquaria hence reducing the potential for algal growths. Silicate (a metalloid) is also efficiently removed. It is known that GFO can also remove a number of transition metals (such as zinc, copper, manganese, etc.) but few experiments have been conducted on the removal (or addition) of metals, non-metals, and metalloids from/to seasoned artificial seawater. This article will examine the results of recent testing and discuss the implications for reef hobbyists.</p>
<p>In an attempt to consolidate information, data concerning phosphorus and silica removal as well as alkalinity are included, previously published here: <a href="http://www.advancedaquarist.com/2011/6/review">http://www.advancedaquarist.com/2011/6/review</a></p>
<h2></h2>
<h2>Glossary</h2>
<p>Before proceeding, a review of terms used in this article will be defined:</p>
<dl> <dt>Alkalinity</dt> <dd>A measure of a liquid's ability to resist shifts to lower (acidic) pH values. Alkalinity can be composed of carbonate, bicarbonate, and/or hydroxide as well as borate, silicate, phosphate and other bases. Reported as milligrams per liter calcium carbonate (CaCO<sub>3</sub> ).</dd> <dt>Chelation</dt> <dd>Combining a metallic ion with an organic substance (such as EDTA - ethylenediaminetetraacetic acid - or perhaps with naturally-occurring aquatic humic substances). By doing so, the metal stays in solution and may be 'bio-available'. A chelated substance can also be called <b>complexed</b>.</dd> <dt>Cobalt (Co)</dt> <dd>Cobalt is an essential trace element for algae, some bacteria and animals (but not higher plants). Cobalt is a transition metal and is found at very low concentrations (0.003 to 0.4 ppb) in natural seawater.</dd> <dt>Copper (Cu)</dt> <dd>Copper is an essential trace element for plants and animals. By law, copper cannot exceed 1.5 mg/L in 10% of homes served by larger potable water systems. Copper levels can exceed this maximum allowable limit when aggressive (corrosive) water degrades copper piping and fixtures. Copper is a transition metal and low concentrations are toxic to invertebrates and is often found in natural seawater at concentrations of ~0.001 to 0.01 mg/L.</dd> <dt>Digestion</dt> <dd>This is a technique used to break down a substance into components that can be analyzed. Digestion usually involves exposing the substance to high temperature and strong acids and is necessary in order to accurately access concentrations of metals chelated with organic substances. However, vigorous digestion is not always required in order to estimate total metals (such is the case for Hach's iron and copper chemistries).</dd> <dt>Iron (Fe)</dt> <dd>Iron is absolutely required for growth and well-being of plants and animals. The EPA has set a secondary limit (suggested, but not enforceable) on concentrations of iron in drinking water at 0.3 mg/L. High iron concentrations in drinking water can cause staining of plumbing and clothes as well as impart objectionable taste and color to food. Iron is a transition metal. Ocean water contains 0.002 to 0.02 mg/L iron.</dd> <dt>Manganese (Mn)</dt> <dd>Manganese is an essential element for plant and animal growth. Its concentration should not exceed 50µg/L (U.S. EPA secondary standard for potable water) and elevated concentrations can stain plumbing, cooking utensils and clothing. Manganese is a transition metal. Previous research suggests manganese can be effectively removed by GFO. Seawater contains 0.001 to 0.01 mg/L.</dd> <dt>mg/L</dt> <dd>Milligrams per liter, essentially the same thing as <b>parts per million</b> (ppm).</dd> <dt>Nickel (Ni)</dt> <dd>Nickel is suspected to be an essential element for at least some plants and animals. The EPA has established a primary, enforceable limit of 0.1 mg/L in drinking water. Nickel is a transition metal and naturally occurs in seawater at ~0.0001 mg/L. Hach's reagents allow determination of cobalt and nickel through analyses of a single sample. Since the protocol did not include spiking of samples with nickel, it is not surprising that nickel levels fell below the detection limit of the instrument (data not shown).</dd> <dt>pH</dt> <dd>The intensity of the acidic or basic character of a solution.</dd> <dt>Phosphorus (P)</dt> <dd>Phosphorus occurs in water almost exclusively as phosphate (PO<sub>4</sub><sup>3-</sup>). Excessive amounts of reactive (or ortho-) phosphate encourages algal and plant growth but can be a limiting nutrient at low concentrations. Phosphorus is essential to all living organisms. Phosphorus is a non-metal.</dd> <dt>Silicon (Si, as SiO<sub>2</sub>)</dt> <dd>Silicon is required for proper function by some plants and animals. It is used by diatoms to produce skeletons and is sometimes not included in the formulation of artificial seawater. There is no limit established by the U.S. EPA on silicates in drinking water. Silicon is a metalloid.</dd> <dt>Zinc (Zn)</dt> <dd>Zinc is an essential element for growth in plants and animals but elevated levels may be toxic. The U.S. EPA has established a level of no greater than 5 mg/L in drinking water. Deterioration of galvanized pipe and brass fixtures can add zinc to drinking water and can cause a bitter taste. Zinc is required in the genetic make-up of every cell and is an absolute requirement for all biologic reproduction including DNA and RNA syntheses. Zinc is an integral component of about 200 metalloenzymes, including carbonic anhydrase, superoxide dismutase, alcohol dehydrogenase, carboxypeptidase, glutamic dehydrogenase, lactic dehydrogenase, and alkaline phosphatase as well as hormones. Zinc is a transition metal and has been shown to be adsorbed by GFO regardless of the solution's ionic strength. Zinc is found in seawater at a level of ~0.005 mg/L.</dd> </dl>
<h2>Results</h2>
<h3>Alkalinity</h3>
<p>Most instructions for use of iron-based materials used in phosphorus removal will caution the end-user of potential drops in aquarium water alkalinity.</p>
<div class="photo-wrapper"><a class="popup" href="chemistry_album/image001.png" rel="gallery" title="Figure 1. Effects of GFO on alkalinity (as mg/L CaCO3)."><img src="chemistry_album/image001.png/image_full" alt="image001.png" class="image-inline" /></a>
<p class="caption">Figure 1. Effects of GFO on alkalinity (as mg/L CaCO<sub>3</sub>).</p>
</div>
<p>As expected, alkalinity was affected by the addition of GFO (see Figure 1). Hobbyists should be aware that many substances will impact alkalinity levels, including two that these GFO products removal effectively - phosphorus and silica!</p>
<h3>Cobalt</h3>
<p>Cobalt is found in natural seawater at parts per billion concentrations. Under the conditions of this procedure, cobalt (likely only free cobalt) is actively removed by GFO. See Figure 2.</p>
<div class="photo-wrapper"><a class="popup" href="chemistry_album/image003.png" rel="gallery" title="Figure 2. Cobalt concentrations fell after GFO was introduced."><img src="chemistry_album/image003.png/image_full" alt="image003.png" class="image-inline" /></a>
<p class="caption">Figure 2. Cobalt concentrations fell after GFO was introduced.</p>
</div>
<h3>Copper (Free)</h3>
<p>Copper in an aquarium is a double-edged sword. It is an essential trace element but is toxic at higher concentrations. Free and total copper were determined. See Figures 3 and 4.</p>
<div class="photo-wrapper"><a class="popup" href="chemistry_album/image005.png" rel="gallery" title="Figure 3. Free copper removal by GFO. The Detection Limit of the test is 0.02 mg/L as Cu. The final reading (0.09 mg/L) is still above that usually seen in natural seawater."><img src="chemistry_album/image005.png/image_full" alt="image005.png" class="image-inline" /></a>
<p class="caption">Figure 3. Free copper removal by GFO. The Detection Limit of the test is 0.02 mg/L as Cu. The final reading (0.09 mg/L) is still above that usually seen in natural seawater.</p>
</div>
<h3></h3>
<h3>Copper (Total)</h3>
<p>Total copper is the sum of free and complexed copper.</p>
<div class="photo-wrapper"><a class="popup" href="chemistry_album/image007.png" rel="gallery" title="Figure 4. Total copper fell due to removal of free copper by GFO."><img src="chemistry_album/image007.png/image_full" alt="image007.png" class="image-inline" /></a>
<p class="caption">Figure 4. Total copper fell due to removal of free copper by GFO.</p>
</div>
<h3>Copper (Chelated or Complexed)</h3>
<p>Copper, complexed with organic substances, can be determined by subtracting free copper from total copper. Figure 5 shows complexed copper is weakly removed, if at all, by GFO.</p>
<div class="photo-wrapper"><a class="popup" href="chemistry_album/image009.png" rel="gallery" title="Figure 5. Chelated (complexed) copper is very weakly removed by GFO, if at all."><img src="chemistry_album/image009.png/image_full" alt="image009.png" class="image-inline" /></a>
<p class="caption">Figure 5. Chelated (complexed) copper is very weakly removed by GFO, if at all.</p>
</div>
<h3>Iron</h3>
<p>Since iron is a major component of GFO, and this substance is subject to weak grinding action within a fluidized reactor, it might be expected that the iron content of the aquarium water would increase, and indeed it did. Further analyses found the iron to be almost entirely in the ferric form, but perhaps more importantly, as mostly in the form of suspended particulates and not dissolved. See Figures 6 through 9.</p>
<div class="photo-wrapper"><a class="popup" href="chemistry_album/image011.png" rel="gallery" title="Figure 6. Experiment #1 showed total iron initially rose and then fell."><img src="chemistry_album/image011.png/image_full" alt="image011.png" class="image-inline" /></a>
<p class="caption">Figure 6. Experiment #1 showed total iron initially rose and then fell.</p>
</div>
<div class="photo-wrapper"><a class="popup" href="chemistry_album/image013.png" rel="gallery" title="Figure 7. Results of experiment #2 found total iron concentrations rose and fell very much like that seen in experiment #1."><img src="chemistry_album/image013.png/image_full" alt="image013.png" class="image-inline" /></a>
<p class="caption">Figure 7. Results of experiment #2 found total iron concentrations rose and fell very much like that seen in experiment #1.</p>
</div>
<div class="photo-wrapper"><a class="popup" href="chemistry_album/image015.png" rel="gallery" title="Figure 8. Total iron minus ferrous iron equals ferric iron."><img src="chemistry_album/image015.png/image_full" alt="image015.png" class="image-inline" /></a>
<p class="caption">Figure 8. Total iron minus ferrous iron equals ferric iron.</p>
</div>
<div class="photo-wrapper"><a class="popup" href="chemistry_album/image017.png" rel="gallery" title="Figure 9. Very little of the total iron was soluble but instead found in the suspended form."><img src="chemistry_album/image017.png/image_full" alt="image017.png" class="image-inline" /></a>
<p class="caption">Figure 9. Very little of the total iron was soluble but instead found in the suspended form.</p>
</div>
<h3>Manganese</h3>
<p>Manganese is an essential element for plants and animals. Free manganese is actively removed by GFO, although the concentration of manganese in the spiked sample plateaued at ~0.07 mg/L at about 120 hours and thereafter. See Figure 10.</p>
<div class="photo-wrapper"><a class="popup" href="chemistry_album/image019.png" rel="gallery" title="Figure 10. Manganese was actively removed by GFO. The analytical procedure can report Mn concentrations of 0.006-0.7 mg/L, while natural seawater contains ~0.001 to 0.01 mg/L."><img src="chemistry_album/image019.png/image_full" alt="image019.png" class="image-inline" /></a>
<p class="caption">Figure 10. Manganese was actively removed by GFO. The analytical procedure can report Mn concentrations of 0.006-0.7 mg/L, while natural seawater contains ~0.001 to 0.01 mg/L.</p>
</div>
<h3>Silica</h3>
<p>GFO is advertised to effectively remove silica, and testing confirms this. Silica is quickly and effectively reduced in concentration, as its concentration fell to below the detection limit of the testing device (in essence 'zero'). See Figure 11.</p>
<div class="photo-wrapper"><a class="popup" href="chemistry_album/image021.png" rel="gallery" title="Figure 11. Silica concentrations fell to below the detection limit of the instrument (essentially zero) inn less than 24 hours under the conditions of this experiment."><img src="chemistry_album/image021.png/image_full" alt="image021.png" class="image-inline" /></a>
<p class="caption">Figure 11. Silica concentrations fell to below the detection limit of the instrument (essentially zero) inn less than 24 hours under the conditions of this experiment.</p>
</div>
<h3>Zinc</h3>
<p>Zinc (free and not complexed) is rapidly removed by GFO. At 104 hours, the concentration had fallen from ~6mg/L to 0.38 mg/L (a removal of ~94%). See Figure 12.</p>
<div class="photo-wrapper"><a class="popup" href="chemistry_album/image023.png" rel="gallery" title="Figure 12. The Detection Limit of the analytical device is 0.02 mg/L as Zn."><img src="chemistry_album/image023.png/image_full" alt="image023.png" class="image-inline" /></a>
<p class="caption">Figure 12. The Detection Limit of the analytical device is 0.02 mg/L as Zn.</p>
</div>
<h3>pH</h3>
<p>pH (the intensity of the basic or acidic natural of a substance) is known to be influenced through use of GFO. Figure 13 demonstrates this effect.</p>
<div class="photo-wrapper"><a class="popup" href="chemistry_album/image025.png" rel="gallery" title="Figure 13. Use of GFO can cause rapid shifts in pH."><img src="chemistry_album/image025.png/image_full" alt="image025.png" class="image-inline" /></a>
<p class="caption">Figure 13. Use of GFO can cause rapid shifts in pH.</p>
</div>
<h3>Phosphorus</h3>
<p>As with many elements, phosphorus is essential for life but can cause problems - specifically that of enhanced algal growths - at relatively low concentrations. Hobbyists should be concerned with reactive or ortho-, phosphate as this is the form that fuels algae growth (this is the form most all 'test kits' report). On the other hand, total phosphorus is that bound with other substances and requires a specialized digestion process including heat and an acidic environment. See Figures 14 and 15.</p>
<div class="photo-wrapper"><a class="popup" href="chemistry_album/image027.png" rel="gallery" title="Figure 14. Time-course Total and Reactive Phosphorus concentrations. Reactive P fell to below the detection limit of the instrument (essentially zero) after only 12 hours. When we subtract…"><img src="chemistry_album/image027.png/image_full" alt="image027.png" class="image-inline" /></a>
<p class="caption">Figure 14. Time-course Total and Reactive Phosphorus concentrations. Reactive P fell to below the detection limit of the instrument (essentially zero) after only 12 hours. When we subtract…</p>
</div>
<div class="photo-wrapper"><a class="popup" href="chemistry_album/image029.png" rel="gallery" title="Figure 15. …reactive phosphorus from total phosphorus, we find total phosphorus concentrations remain static. Total phosphorus is weakly, if at all, removed by GFO. This form of phosphorus is likely organically bound in suspended particles."><img src="chemistry_album/image029.png/image_full" alt="image029.png" class="image-inline" /></a>
<p class="caption">Figure 15. …reactive phosphorus from total phosphorus, we find total phosphorus concentrations remain static. Total phosphorus is weakly, if at all, removed by GFO. This form of phosphorus is likely organically bound in suspended particles.</p>
</div>
<h3><b>Reduction-Oxidation Potential (Redox) or Oxidation-Reduction Potential (ORP)</b></h3>
<p>Redox, or ORP, is the tendency of an aqueous solution to gain or lose electrons from the introduction of a new substance. Redox measurements of a few natural reefs here in Hawaii are not substantially different than those taken during this procedure (See Figure 16).</p>
<div class="photo-wrapper"><a class="popup" href="chemistry_album/image031.png" rel="gallery" title="Figure 16. At the first use of GFO, the redox value of the water trended upwards (the procedure began at 12:39 pm)."><img src="chemistry_album/image031.png/image_full" alt="image031.png" class="image-inline" /></a>
<p class="caption">Figure 16. At the first use of GFO, the redox value of the water trended upwards (the procedure began at 12:39 pm).</p>
</div>
<h2><b>Trace Elements Addition</b></h2>
<p>Addition of various metals to an aquarium can result from a number of factors ranging from inadvertent to deliberate. However, two likely account for most input: Feeding and water top-off and/or water changes. We'll examine these in some detail:</p>
<p><b>Fish Food</b>: Many hobbyists, if asked, might say they do not deliberately add copper to their reef aquaria. The truth is that they do in the form of fish food. Prepared fish foods often contain trace amounts of copper sulfate, ferrous sulfate, manganese sulfate, zinc sulfate and potassium iodide.</p>
<p><b>Tap Water:</b> Tap water may be from surface water (rivers, lakes), ground water (wells) and in some cases catchment (captured rain). Water quality varies with location, and elevated levels of nitrate, lead, copper, iron, manganese, calcium, magnesium and others may require pretreatment before release from the water treatment facility. In many parts of the country, water receives little treatment before distribution to customers, with disinfection (via chlorination, fluoridation or ozonation) being common. Small and private water systems are not regulated by the EPA, although guidelines have been established. Larger water systems are required to provide annual Consumer Confidence Reports (CCRs) that state levels of contamination if present. Bear in mind that clean water does not like to stay that way and often picks up contaminants from the plumbing within your dwelling.</p>
<p><b>Reverse Osmosis (or nano-filtration):</b> Reverse osmosis is a popular means used to remove contaminants from water. Removal efficiency depends upon many parameters including type of pretreatment used and the type of reverse osmosis membrane used. In most all cases, removal of contaminants by RO filtration is not complete and small percentages of contaminants found in feed water are not removed.</p>
<p><b>De-ionized (DI) Water:</b> DI water is often the most pure of waters regularly added to an aquarium either as that used to mix artificial salts or as top-off water. Functioning cationic/anionic de-ionization units can delivery water suitable for making dilutions when testing for various substances. Conductivity of DI water is low - mine produces water of just 4 or 5μS.cm<sup>2</sup> Obviously, DI units can import little metals.</p>
<p><b>Well Water:</b> Well water is naturally enough groundwater and is subject to absorbing any number of inorganic and organic substances in the soil. Private or small water systems using well water are not regulated by the US EPA and it is up to the owner(s) to determine suitability of this source for drinking or any other use for that matter.</p>
<p><b>Impurities in Supplements:</b> We tend to think of the supplements added to our aquaria as being relatively pure when I fact they are not. For instance, 'laboratory grade' manganese chloride (ACS, 99.5% purity) contains 0.001% zinc and iron at 1.7 ppm. Technical-grade chemicals may be around 95% pure.</p>
<p><b>Natural Chelators:</b> Aquatic humic substances are generally those produced by aquatic plants and algae either by biochemical pathways or through their decay. These substances can combine with metals in solution and cloak them from detection with most test kits used by hobbyists.</p>
<p><b>Artificial Chelators:</b> Artificial chelators such as EDTA or EGTA can bond with metals. One major artificial seawater -Instant Ocean - advertises to contain no EDTA or any other metal chelators (see <a href="http://www.instantocean.com/">www.instantocean.com</a> for details).</p>
<h3><b>Water Motion, Boundary Layer, and 'Trace Elements'</b></h3>
<p>All benthic objects are surrounded by a thin layer of stagnant water called the boundary layer. Its thickness is determined by the amount of water motion around the object, and is inversely proportional. In other words, the layer of stagnant water decreases when flow increases, and vice versa. Diffusion of elements through the boundary layer is related to the concentration of the substance in solution - the higher the concentration, the less likely it is to be limited by diffusion rates. The carry-home message is clear - insufficient water motion within a coral reef aquarium is to be avoided and directly affects the availability of 'trace elements.' Most aquaria do not even come close to 'natural' water motion where, in my experiences, sensors mounted to 5-pound lead weights can be tossed about by passing waves in even sheltered coves.</p>
<h3><b>Metals in Natural Seawater</b></h3>
<p>A water sample was collected in the littoral zone at the 4 Mile Marker on Alii Drive in Kailua-Kona, Big Island of Hawaii. This island is geologically young and metals bound in lava rock are leached by acid rain (a mixture of volcanic 'vog' -volcanic smoke containing tons of sulfur dioxide- and water vapor). The amount of copper found in natural seawater is roughly equivalent to that reported in the County of Hawaii drinking (ground) water Consumer Confidence Report (see Figure 17). This report does not include concentrations of iron and zinc.</p>
<div class="photo-wrapper"><a class="popup" href="chemistry_album/image036.png" rel="gallery" title="Figure 17. Concentrations of copper and iron at the 4 Mile Reef in Kailua-Kona, Hawaii. There is likely a terregenous impact from acid rain leaching through geologically-young lava rock."><img src="chemistry_album/image036.png/image_full" alt="image036.png" class="image-inline" /></a>
<p class="caption">Figure 17. Concentrations of copper and iron at the 4 Mile Reef in Kailua-Kona, Hawaii. There is likely a terregenous impact from acid rain leaching through geologically-young lava rock.</p>
</div>
<h2>Conclusions</h2>
<p>A brief review of existing journal literature leaves little doubt that at least some metals can be effectively removed by GFO.</p>
<p>The goal of this project was to establish metals removal/addition by iron oxide hydroxide. As with most endeavors of this type, results ask further questions. Metals concentrations within waters of captive environments are dynamic and subject to a number of influences such as pH, ionic strength or amount and type of chelators available. Even then, extraneous factors, such as poor water motion may limit the rate of metals' diffusion through a boundary layer. Whatever the case, supply and demand are ultimate factors.</p>
<p>GFO (at least the brand tested) has a high affinity for phosphorus and silica and rapidly removes ortho-phosphate and silicates. Copper in the free form is removed, while ferric iron is added, though in a particulate and not soluble form. Zinc, manganese, and cobalt are also removed though concentrations never fell to critical concentrations. It is possible that the testing process reported weakly-chelated metals.</p>
<p>Introduction of any chemical filtration could introduce competing processes in an aquarium, where the biochemical demand of animals competes with chemical extraction. No evidence was found where any element fell to critical levels. However, their initial concentrations were quite high and the salt content of water was only a fraction of natural seawater in the case of cobalt and manganese. Further simple colorimetric testing will likely lend little new useful data. More refined testing techniques will be needed before the impact of chemical filtration and its effects on metals is understood.</p>
<h2><b>Methods and Materials</b></h2>
<p>A 20-gallon aquarium was filled with seasoned artificial seawater (from a water change). Baseline measurements were made for reactive phosphate, iron, copper, zinc, and pH. The water was then spiked with copper chloride (Certified ACS) and 99% zinc sulfate (both chelated with EDTA, though apparently not enough as some free copper was determined through testing). Coarse bubble aeration was provided by a small air pump. The aquarium was not lighted, and incident light was only that from another aquarium approximately 10 feet away.</p>
<p>A different protocol was established in order to conduct testing for cobalt, nickel and manganese. These tests report erroneous results when magnesium concentrations exceed 300 to 400 mg/L Mg (as CaCO<sub>3</sub>). Additionally, the cobalt test is interfered by chloride (&gt;8,000 mg/L), manganese (&gt;25 mg/L) and sodium (&gt;5,000 mg/L). To avoid these interferences, seasoned aquarium water was diluted with water previously treated via reverse osmosis. This water was then spiked with manganese (manganous) chloride (ACS grade; 99.5% purity) and cobalt chloride (ACS; 98.6% purity and chelated with EDTA). Baseline data were established for salinity, pH, iron, cobalt, manganese, magnesium, calcium, and alkalinity. Circulation within the tank was provided by a small powerhead (MaxiJet 400), and, as with the previous test, the aquarium was only weakly illuminated.</p>
<p>A sample of water was tested for total iron, and an aliquot of this sample was also filtered under vacuum through a 0.45 micron filter in order to determine if iron added to the aquarium water column is dissolved or particulate.</p>
<p>For each procedure, a fluidized bed reactor (Two Little Fishies) was filled with 60g (dry weight) Aquamaxx Phosphate Out GFO. A small water pump (Maxi-Jet 400) provided flow to the reactor which was regulated with a small ball valve to ~700 ml/min. The GFO was flushed with about 2 gallons of water before use and the reactor's effluent appeared clear to the eye. The reactor was installed on the experiment's aquarium and testing began. During testing for copper and zinc removal, new GFO (rinsed 60g dry material) was added after 8 hours due to a suspected saturation of the initial material (which was discarded).</p>
<p>Most test reagents were from Hach, and results were generated through use of a colorimeter (Hach DR890) or a spectrophotometer (Hach DR2000). Glassware was cleaned with 1:1 HCL (glassware used for manganese was cleaned with nitric acid) and rinsed with deionized water. Samples were drawn directly from the aquarium with cuvettes. Zinc samples initially required dilution; de-ionized water was used.</p>
<p>Quality assurance was conducted using a standard (Hach potable water standard). Recovery was &gt;98% for both iron and copper and 93% for manganese.</p>
<p>Copper, iron, manganese, and zinc were analyzed by a Hach DR890 colorimeter. Cobalt and nickel were tested by a Hach DR2000 spectrophotometer. Alkalinity was determined with a Hanna Alkalinity 'Checker'. Salinity was measured through use of a calibrated refractometer. Silica was measured with a LaMotte Smart2 colorimeter. Redox (or oxidation-reduction potential) and pH were measured and recorded with a Hach HQ40d data-logger with appropriate probes. Reactive and total phosphorus (involving digestion) used Hach's TnT reagents and a block heater with analyses performed with a Hach DR2800 spectrophotometer.</p>
<p>These Hach reagents were used for testing:</p>
<p><b>Alkalinity</b> was determined by titration of a sample with an acid of known strength to a standardized endpoint. This method is not the most reliable for testing of seawater. However, we are not concerned with absolute values and are more interested in relative alkalinity in order to demonstrate GFO's impact.</p>
<p><b>Cobalt</b> <b>(PAN Method; Range: 0.01 - 2.00 mg/L).</b> Cobalt and nickel can be determined on the same sample using the PAN chemistry. Normal strength seawater must be diluted in order to properly perform this test - see 'Nickel' below for details. Determination is made at 620nm. A vigorous digestion was performed to determine total cobalt.</p>
<p><b>Copper</b> <b>(Bicinchoninate Method; Range: 0.04 - 5.00 mg/L).</b> Since copper was complexed with EDTA, free copper was initially determined. Hydrosulfite was added to the same sample for determination of total copper. Estimated Detection Limit is 0.02 mg/L as Cu. No known interferences were present. No digestion was performed. EPA approved method.</p>
<p><b>Iron</b> <b>(FerroVer Method; Range: 0.03 - 3.00 mg/L).</b> This reagent reacts with all soluble and most insoluble forms of iron (Fe<sup>2+</sup> and Fe<sup>3+</sup> as well as complexed iron) to produce soluble ferrous iron. 1,10-phenanthroline reacts with ferrous iron to produce an orange color. Estimated detection limit is 0.03 mg/L as Fe. No known interferences were present. No digestion was performed. EPA approved method. Other methods exist (using Hach's brand names):</p>
<p><b>Ferrous Iron Reagent</b> tests for ferrous (Fe<sup>2+</sup>) iron only. 1,10-phenanthroline reacts with ferrous iron to produce an orange color. Since ferrous iron can be rapidly converted to ferric iron, samples must be analyzed immediately. <b>Total iron</b> - <b>ferrous iron</b> = <b>ferric iron</b>.</p>
<p><b>Manganese (PAN Method; Range: 0.006 - 0.700 mg/L).</b> Ascorbic acid reduces all oxidized forms of Mn to Mn<sup>2+</sup>. An alkaline-cyanide reagent masks most interference. The PAN reagent (1-(2-Pyridylazo)-2-Naphthol) combines with Mn<sup>2+</sup> to produce an orange color, which is measured with a spectrometer at 560nm. Magnesium interferes at a concentration of 300 mg/L (as CaCO<sub>3</sub>), so seawater samples must be diluted. Total manganese was determined on samples subjected to an EPA-approved vigorous digestion method.</p>
<p><b>Nickel (PAN Method; Range: 0.006 - 1.000 mg/L)</b><b>.</b> Analysis involves the PAN method, where the sample is buffered and any ferric iron is masked by pyrophosphate, nickel and many other metals react with 1-(2-Pyridylazo)-2-Naphthol (PAN). EDTA is added to preferentially destroy metal-PAN complexes except for nickel and cobalt. Seawater samples must be diluted since they contain many interfering elements, such as chloride (8,000 mg/l), potassium (500 mg/l), magnesium (400 mg/l) and sodium (5,000 mg/l). Spectrometric determination is made at 560nm.</p>
<p><b>Phosphorus, ortho- or reactive</b> <b>(PhosVer3 Method).</b> The estimated detection limit is 0.07 mg/L as PO <sub>4</sub> <sup>3-</sup> .No known interferences were present. EPA accepted method if no dilution is required. The aquarium water was tested before the procedure began - the result was 0.01 mg/l as P.</p>
<p><b>pH</b>. This parameter was monitored and recorded with a Hach HQ40d multimeter/datalogger and pH probe. The meter was calibrated to two points - 7 and 10 pH buffers were used.</p>
<p><b>Silica (Heteropoly Blue Method).</b> Reactive silica reacts with ammonium molybdate in acidic conditions to produce a yellow-green color. Since phosphate also reacts with molybdate, oxalic acid is added to prevent the interference. Silica-molybdate is then reduced by ascorbic acid to produce a blue color that can be measured through spectroscopy. These reagents were manufactured by LaMotte Company.</p>
<p><b>Zinc</b> <b>(Zincon Method; Range: 0.02 - 3.00 mg/L).</b> This test is not listed as applicable to natural seawater since the expected concentration would fall well below the instrument's detection limit (0.02 mg/L as Zn); however no interferences prevent its use for determination of zinc at high concentrations in brine samples. Copper and iron concentrations fell below the levels known to cause interference. Zinc (and other metals) are complexed with cyanide (hence my obsession with sample pH) and cyclohexane selectively releases zinc. The Zincon reagent (2-carboxy-2'-hydroxy-5'-sulfoforamazyl benzene) reacts with zinc to form coloration ranging from orange to blue depending upon concentration. EPA approved method. No digestion was performed. EPA approved method.</p>
<h2><b>Acknowledgment</b></h2>
<p>Many thanks to Randy Holmes-Farley for his comments during the preparation of this article.</p>
<h2><b>References</b></h2>
<ol>
<li>Kanungo, S., 1994. Adsorption of cations on hydrous oxides of iron. II. Adsorption of Mn, Co, Ni, and Zn onto amorphous FeOOH from simple electrolyte solutions as well as from a complex electrolyte solution resembling seawater in major ion content. Journal of Colloid and Interface Science, 162(1), 93-102.</li>
<li>Kanungo, S., 1994. Adsorption of cations on hydrous oxides of iron. III. Adsorption of Mn, Co, Ni, and Zn of bFeOOH from simple electrolyte solutions as well as from a complex electrolyte solution resembling seawater in major ion content. Reg. Res. Lab., Bhubaneswar, India. Journal of Colloid and Interface Science, 162(1), 103-109.</li>
<li>Johnson, C., 1986. The regulation of trace element concentrations in river and estuarine waters contaminated with acid mine drainage: The adsorption of copper and zinc on amorphous iron oxyhydroxides. R. Sch. Mines, Imp. Coll., London, UK. Geochimica et Cosmochimica Acta, 50(11), 2433-8.</li>
</ol></div> <br /><br /> <script type="text/javascript"><!-- google_ad_client = "ca-pub-5170032844807535"; /* Square250x250 */ google_ad_slot = "6862474606"; google_ad_width = 250; google_ad_height = 250; //--></script><script type="text/javascript" src="http://pagead2.googlesyndication.com/pagead/show_ads.js"></script>]]></content:encoded>
    <dc:publisher>No publisher</dc:publisher>
    
    <dc:creator>Dana Riddle</dc:creator>
    <dc:rights>Pomacanthus Publications, Inc.</dc:rights>
    
      <dc:subject>Chemistry And The Aquarium</dc:subject>
    
    
      <dc:subject>Chemistry and the Aquarium</dc:subject>
    
    
      <dc:subject>Dana Riddle</dc:subject>
    
    
      <dc:subject>GFO</dc:subject>
    
    
      <dc:subject>Chemistry</dc:subject>
    
    
      <dc:subject>Granular Ferric Oxide</dc:subject>
    
    <dc:date>2012-02-15T15:00:00Z</dc:date>
    <dc:type>Page</dc:type>
  </item>


  <item rdf:about="http://www.advancedaquarist.com/2011/10/chemistry">
    <title>Aquarium Chemistry: Calcite, Aragonite, Limestone, and More</title>
    <link>http://www.advancedaquarist.com/2011/10/chemistry</link>
    <description>It's been said a million times that aragonite helps buffer aquarium water, or helps maintain calcium concentrations, while other (carbonate) substrates do not. However, to the best of my knowledge this simply isn't true.</description>
    <content:encoded xmlns:content="http://purl.org/rss/1.0/modules/content/"><![CDATA[<p><em><strong>Click through to see the images.</strong></em></p> <br /><div id="body">
<p><img src="chemistry_album/carbs2.jpg" alt="carbs2.jpg" class="image-inline" /></p>
<p><span class="dropcap">W</span>ith the exception of something like an aquarium set up for jellyfishes, essentially all marine aquariums contain solid materials made of the minerals calcite and aragonite. Oddly enough, these two minerals are made of the same thing though, as both are composed of calcium carbonate in different forms. So, anything made of either or both of these are collectively known as carbonate materials, and I'm going to give you some information about each of these materials and a few other things, and explain what's what and how they're related to each other. That might not sound too exciting, but I'm sure you'll find this interesting and learn something good, nonetheless.</p>
<div class="photo-wrapper"><a class="popup" href="chemistry_album/IMG_6930.jpg" rel="gallery" title="Essentially everything solid in our aquariums that isn't made of tissue is made of calcium carbonate, so it's worthwhile to know a bit about it."><img src="chemistry_album/IMG_6930.jpg/image_full" alt="IMG_6930.jpg" class="image-inline" /></a>
<p class="caption">Essentially everything solid in our aquariums that isn't made of tissue is made of calcium carbonate, so it's worthwhile to know a bit about it.</p>
</div>
<h2></h2>
<h2>Carbonate Minerals</h2>
<p>Through the never-ending processes of weathering and erosion, rain and flowing water manage to slowly wear away various types of rocks and transport most of the sediments and dissolved substances produced in the process to the seas. Mixed in these rocks we can find dozens of elements, one of them being calcium. Thus, in the process of breaking down rocks, literally ton upon ton of calcium is washed into the world's oceans every year by streams and rivers.</p>
<p>On the other hand, in the atmosphere we find carbon dioxide, which is produced by animals as a respiratory waste product and the burning of organic matter, and exhaled by the Earth through volcanic activity. Carbon dioxide is also found in seawater, as it is given of by fishes and other animals and naturally dissolves into the water from the atmosphere, too. The process of diffusion allows it to constantly soak into surface waters exposed to air, after which it's mixed into deeper waters by the constant activity of waves and currents.</p>
<p>Then, under the right conditions, calcium, carbon dioxide, and water can chemically interact to form calcium carbonate - CaCO<sub>3</sub>. A number of other elements can end up in the mix, and can form some closely related compounds, as well. So, we tend to group all of these similar products together and call them the carbonates. Of these, the ones that are best related to the aquarium hobby are calcite, aragonite, and dolomite, which are the constituents of limestone (and thus live rock), carbonate sands and gravels, and the shells, skeletons, and other hard parts of various invertebrate organisms. So, let's take a look at all three of these minerals.</p>
<h3><b>Calcite</b></h3>
<p>Calcite is a mineral that in its purest form is made of nothing but calcium carbonate. It is common in the marine realm and in rocks formed in marine waters, and it is chemically stable enough to resist being dissolved under common conditions. However, it oftentimes isn't so pure, as a few other elements commonly get mixed in during its formation. Some of these elements are magnesium, manganese, and iron, all of which have chemical properties that allow their incorporation.</p>
<p>So, as calcite is being formed, any of these elements present in the water that the mineral is being precipitated from can slip in from time to time and take the place of a calcium atom. Magnesium is the most common impurity of the bunch, so calcite is oftentimes called either low-magnesium calcite (LMC) or high-magnesium calcite (HMC) depending on how much magnesium is present in a given sample.</p>
<h3><b>Aragonite</b></h3>
<p>Like calcite, the mineral aragonite in its purest form is also made of just calcium carbonate. However, when aragonite forms the calcium, carbon, and oxygen atoms bond together differently and become arranged in a different pattern. The atoms in a sample of calcite are arranged in what's called a rhombohedral crystal, while the atoms in a sample of aragonite are arranged in an orthorhombic crystal.</p>
<p>Two different crystal forms made of the same stuff may sound odd, but it really isn't. This ability to exist in two crystal forms is called polymorphism, meaning many shapes, and I guarantee you've seen it before. Think about graphite, commonly known as pencil lead, and diamond. Graphite is actually one of the softest minerals, coming in at #1 on the Mohs Hardness Scale, while diamond is the hardest mineral known to man at #10, yet they're both made of exactly the same thing - carbon. Yep, both are made of nothing but carbon atoms which are simply found in different arrangements.</p>
<p>Calcite and aragonite certainly aren't as different as graphite and diamond, as they both have a similar hardness and are typically white in color. However, the change in atomic arrangements does change the list of impurities that can be easily included in aragonite. While calcite is commonly riddled with magnesium atoms, aragonite is typically found to be riddled with strontium atoms instead. Elements like barium and lead and a few others are also mixed in at times, but strontium is the most common of the bunch.</p>
<p>The structure of aragonite is also less stable than that of calcite, so it's more apt to dissolve under similar conditions. And, when strontium is added into the mix it becomes even more unstable. In fact, aragonite is considered to be a metastable mineral that can ever so slowly degrade to calcite all by itself over time at normal temperatures and pressures, without the help of water, with this change occurring even faster at high temperatures.</p>
<h3><b>Dolomite</b></h3>
<p>The third carbonate mineral to mention is dolomite, which is something like calcite with a very high concentration of magnesium in it. I'd said that calcite is typically riddled with magnesium atoms, but even in high-magnesium calcite the magnesium only makes up a small fraction of the whole. However, under some conditions there can be much more magnesium added in, and when the amount of magnesium becomes roughly the same as the calcium, the resulting mineral is called dolomite. So, dolomite is similar to calcite and still has a rhombohedral form, but it's chemical formula is CaMg(CO<sub>3</sub>)<sub>2</sub>.</p>
<h2><b>Materials Composed of Carbonates</b></h2>
<p>Now that you've got a basic idea of what carbonate minerals are, let's look at things that go into our aquariums that are composed of them.</p>
<h3><b>Shells, skeletons, and other hard parts</b></h3>
<p>Many organisms can extract calcium and other elements from seawater and then use carbon dioxide from the water or from their own respiration to precipitate carbonate hard parts. So, I'll run through some of the major users and the mineral(s) each uses:</p>
<p>Long ago there were some stony corals called rugosans and other called tabulates that are thought to have used calcite to form their skeletons. But, all of these disappeared from the Earth during the extraordinary Permian-Triassic mass extinction that occurred around 250 million years ago. Regardless, all of the stony corals that are with us today use aragonite to build their skeletons. However, almost all of the things that we lump under the name "soft coral" use calcite to form the tiny sclerites and spicules that support and strengthen their bodies.</p>
<div class="photo-wrapper"><a class="popup" href="chemistry_album/11jan113.jpg" rel="gallery" title="Unlike modern stony corals, the extinct rugose corals used calcite to build their skeletons."><img src="chemistry_album/11jan113.jpg/image_full" alt="11jan113.jpg" class="image-inline" /></a>
<p class="caption">Unlike modern stony corals, the extinct rugose corals used calcite to build their skeletons.</p>
</div>
<p>Likewise, all of the echinoderms, including the sea stars, brittle stars, crinoids, sea urchins, etc., use calcite to form the pieces, plates, and spines that make up their skeletons. All of the sponges belonging to the Class Calcispongiae use calcite to form their spicules. All of the hard tube-building worms, like Christmas tree worms, use calcite and/or aragonite to form their tubes. Some arthropods, like barnacles, use calcite to form the plates that make up their houses, while others may use calcite crystals to strengthen their protein-based shells. Most molluscs use aragonite to build their shells, although some clams and snails may use a combination of calcite and aragonite in layers, and a few others, like oysters, use calcite exclusively.</p>
<div class="photo-wrapper"><a class="popup" href="chemistry_album/DSCN7413.jpg" rel="gallery"><img src="chemistry_album/DSCN7413.jpg/image_full" alt="DSCN7413.jpg" class="image-inline" /></a></div>
<div class="photo-wrapper"><a class="popup" href="chemistry_album/IMG_2221.jpg" rel="gallery" title="Carbonate sediments are oftentimes comprised primarily of bits and pieces of broken up coral skeleton, clam and snail shells, echinoderm parts such as sand dollar and sea urchin spines and tests, and other things like these bits of calcite that are freed to the environment when sea stars die."><img src="chemistry_album/IMG_2221.jpg/image_full" alt="IMG_2221.jpg" class="image-inline" /></a>
<p class="caption">Carbonate sediments are oftentimes comprised primarily of bits and pieces of broken up coral skeleton, clam and snail shells, echinoderm parts such as sand dollar and sea urchin spines and tests, and other things like these bits of calcite that are freed to the environment when sea stars die.</p>
</div>
<p>Green calcareous algae, like <i>Halimeda</i>, also use aragonite to build their leaf-like blades, while, red calcareous algae, commonly called coralline algae, use calcite to form crusts and rinds over surfaces. And lastly, a wide range of plankton, like foraminiferans and coccolithophorids, use aragonite or calcite to build their tiny shells, as well.</p>
<div class="photo-wrapper"><a class="popup" href="chemistry_album/IMG_4443.jpg" rel="gallery"><img src="chemistry_album/IMG_4443.jpg/image_full" alt="IMG_4443.jpg" class="image-inline" /></a></div>
<div class="photo-wrapper"><a class="popup" href="chemistry_album/DSCN1951.jpg" rel="gallery"><img src="chemistry_album/DSCN1951.jpg/image_full" alt="DSCN1951.jpg" class="image-inline" /></a></div>
<div class="photo-wrapper"><a class="popup" href="chemistry_album/IMG_2137.jpg" rel="gallery" title="Animals aren't the only things that use calcium carbonate. Various types of calcareous and coralline algae and several types of plankton do, as well. When these die, their hard parts also become carbonate sediments that are incorporated with those produced by animals."><img src="chemistry_album/IMG_2137.jpg/image_full" alt="IMG_2137.jpg" class="image-inline" /></a>
<p class="caption">Animals aren't the only things that use calcium carbonate. Various types of calcareous and coralline algae and several types of plankton do, as well. When these die, their hard parts also become carbonate sediments that are incorporated with those produced by animals.</p>
</div>
<p>So, as you can see, lots of invertebrates use calcium carbonate to make their hard parts (while vertebrates use calcium phosphate to make theirs). However, as you may have also noticed, dolomite is not used by any marine organisms to produce hard parts. For that matter, geochemists haven't even figured out how to make it themselves in a lab under conditions that can be found in the marine environment. How it forms in different geological settings has been argued for years, and the jury is still out on exactly how the transition from magnesian calcite to dolomite occurs, but what I can tell you is that it isn't forming in significant quantities in any of the modern marine environments, with or without the help of organisms.</p>
<h3><b>Aragonite and oolite sands</b></h3>
<p>Most of us have some fine sand in our aquariums, and the most commonly used type is aragonitic sand. So, it's composed of bits of aragonite with varying origins. Some of the aragonite sands available are relatively coarse and are made of ground up sea shells, while others are very fine with the grains primarily being smaller bits of various organisms' hard parts produced when wave activity and bioeroders like parrotfishes break down their shells and carbonate rocks, etc. However, there are some other products called oolitic sands that look pretty much like any other fine sand, but are actually quite different in origin.</p>
<div class="photo-wrapper"><a class="popup" href="chemistry_album/11a.jpg" rel="gallery"><img src="chemistry_album/11a.jpg/image_full" alt="11a.jpg" class="image-inline" /></a></div>
<div class="photo-wrapper"><a class="popup" href="chemistry_album/DSCN2401.jpg" rel="gallery" title="Animals like parrotfishes and sea urchins are considered to be bioeroders, as they're organisms that chew on various rocks and substrates and produce sediments in the process. Parrots bite off pieces of limestone and ingest them, digest whatever was living on them, and then defecate copious quantities of carbonate sand later. Likewise, many urchins use their hard " teeth="teeth"><img src="chemistry_album/DSCN2401.jpg/image_full" alt="DSCN2401.jpg" class="image-inline" /></a>
<p class="caption">Animals like parrotfishes and sea urchins are considered to be bioeroders, as they're organisms that chew on various rocks and substrates and produce sediments in the process. Parrots bite off pieces of limestone and ingest them, digest whatever was living on them, and then defecate copious quantities of carbonate sand later. Likewise, many urchins use their hard "teeth" to grind coralline algae off rocks, and also produce carbonate sand in the process.</p>
</div>
<p>Oolitic sands have normal-looking white to pinkish-white grains, but they're composed of tiny structures that are not derived from organisms' hard parts. Almost all modern ooids are indeed composed of aragonite, but some are HMC, and some are composed of both. To the contrary, almost all ancient ooids, which is what many oolitic sands being sold are comprised of, are calcitic. Regardless, they all look like tiny bites of hard candy when cut open. They may be smooth and shiny on the outside, but the inside can have numerous layers and coatings, or tiny fibrous crystals, and again, none are produced as hard parts by organisms. Instead, while the details aren't well-understood, these are produced abiotically in various marine environments.</p>
<h3><b>Shelly substrates</b></h3>
<p>There are many other substrates available that are comprised of small sea shells, or larger pieces of ground up shells. Examples are the "puka" substrates and crushed oyster shell. Since most molluscs use aragonite to build their shells, most puka gravels will of course be composed of aragonite. However, as I mentioned above, oysters are an exception to the general rule and make their shells entirely of calcite. So, crushed oyster shell gravel is composed of calcite.</p>
<div class="photo-wrapper"><a class="popup" href="chemistry_album/34001.jpg" rel="gallery" title="Some substrates are comprised of small but whole shells, and are thus composed primarily of aragonite."><img src="chemistry_album/34001.jpg/image_full" alt="34001.jpg" class="image-inline" /></a>
<p class="caption">Some substrates are comprised of small but whole shells, and are thus composed primarily of aragonite.</p>
</div>
<h3><b>Crushed coral gravels</b></h3>
<p>In light of the fact that stony corals use aragonite to build their skeletons, it should make perfect sense that any bags of gravel labeled "crushed coral" are in fact bags of aragonite. However, I've also seen many bags of crushed coral gravel that were actually bags of dolomite (it said so right on the bags). This is odd because dolomite isn't collected from modern reef environments, and it certainly isn't ground up coral or hard parts of any other organisms, either.</p>
<p>I suppose it's possible that this particular kind of gravel could be produced from some rock formation containing fossilized corals that were buried, turned into dolomite over millions of years, then dug up and ground into gravel. But, I can assure you that it isn't collected around modern reef environments and isn't made by crunching up the skeletons of dead non-fossil corals, either. Does that mean there's anything wrong with using it? Well, like puka or crushed oyster shell gravels, it's really not a good size for a reef aquarium substrate since it tends to get completely clogged with detritus when there's no significant water movement through it, but I probably used about a ton of it setting up tanks with undergravel filters in the past since it was white in color and exactly the right grain size for the job.</p>
<h3><b>Limestone and live rock</b></h3>
<p>At this point I'm sure you can understand that the vast majority of carbonate sediments found in reef environments are actually chunks and bits of various organisms' hard parts including eroded coral skeleton and snail and clam shells, etc. with a large amount of broken up calcareous algae thrown in, too. Now let's get to how rocks can be made from these.</p>
<p>When all of these carbonate sediments are deposited together around reefs and slowly compacted by the constant addition of more sediment, additional carbonate material can abiotically precipitate from seawater in the miniscule void spaces between the sediments and cement them together. So, under the right environmental conditions sediments can literally get glued together by even more calcium carbonate. Then, after enough time and under the right conditions, the sediments and cements themselves can be dissolved to some degree, followed by more abiotic precipitation too, which is how most live rock and much limestone come to be. In fact, live rock really is limestone, although there are other types of limestone that can form through a variety of abiotic processes.</p>
<div class="photo-wrapper"><a class="popup" href="chemistry_album/IMG_4083.jpg" rel="gallery" title="Here you can see a mess of carbonate materials that are weakly cemented together. While not quite limestone, this material was certainly on its way to becoming solid rock before being exposed."><img src="chemistry_album/IMG_4083.jpg/image_full" alt="IMG_4083.jpg" class="image-inline" /></a>
<p class="caption">Here you can see a mess of carbonate materials that are weakly cemented together. While not quite limestone, this material was certainly on its way to becoming solid rock before being exposed.</p>
</div>
<div class="photo-wrapper"><a class="popup" href="chemistry_album/DSC09112.jpg" rel="gallery" title="Given enough time, materials like these pieces of Acropora palmata and A. cervicornis can be buried along with carbonate sand and other bits of stuff, glued together by carbonate cements, and eventually turned to solid limestone as seen here."><img src="chemistry_album/DSC09112.jpg/image_full" alt="DSC09112.jpg" class="image-inline" /></a>
<p class="caption">Given enough time, materials like these pieces of <i>Acropora palmata</i> and <i>A. cervicornis</i> can be buried along with carbonate sand and other bits of stuff, glued together by carbonate cements, and eventually turned to solid limestone as seen here.</p>
</div>
<p>Regardless, while live rock and limestone are obviously composed of calcium carbonate, oftentimes there are no distinct grains or pieces left in either that you can pick out. Want a good example? Just cut or break a piece of live rock in half and take a good look. You'll likely find the blurred remnants of coral skeletons and other things all cemented together and transformed from carbonate sediments into stone. So, as you can see, most everything that we call sand, gravel, rock, etc. that comes from reef environments is actually made up of carbonate material produced by the organisms right there on the reef.</p>
<div class="photo-wrapper"><a class="popup" href="chemistry_album/DSCN1244.jpg" rel="gallery" title="Busting a piece of live rock open will typically reveal some remnants of the coral skeleton, shell material, etc. that were originally un-cemented sediments."><img src="chemistry_album/DSCN1244.jpg/image_full" alt="DSCN1244.jpg" class="image-inline" /></a>
<p class="caption">Busting a piece of live rock open will typically reveal some remnants of the coral skeleton, shell material, etc. that were originally un-cemented sediments.</p>
</div>
<h2><b>Wrap up</b></h2>
<p>Okay, so I imagine that at this point you might be wondering if there's any good reason to pick things that are made of aragonite over things made of calcite, or vice versa. It's been said a million times that aragonite helps buffer aquarium water, or helps maintain calcium concentrations, while other (carbonate) substrates do not. However, to the best of my knowledge this simply isn't true.</p>
<p>I have yet to see any solid evidence that using aragonitic materials provides any advantage over using calcitic materials in an aquarium. And, in the words of the chemist-aquarist-author Randy Holmes-Farley "calcium carbonate will not dissolve in the water column of normal marine aquaria". Some may dissolve within a deep sand bed where water chemistry changes from the top of the bed to the bottom, but this is unlikely to have any significant effect on overall water quality. So, I wouldn't waste a minute of my time worrying about whether or not something is made of one or the other, or of dolomite either for that matter. Still, I hope this has helped you to understand the carbonates and many of the terms we see that are associated with them, and why calcium additions to reef aquariums are so important, too.</p>
<h2><b>References and</b> <b>sources for more information</b></h2>
<ol>
<li>Aragonite: <a href="http://en.wikipedia.org/wiki/Aragonite">http://en.wikipedia.org/wiki/Aragonite</a></li>
<li>Bioerosion: <a href="http://en.wikipedia.org/wiki/Bioerosion">http://en.wikipedia.org/wiki/Bioerosion</a></li>
<li>Calcite: <a href="http://en.wikipedia.org/wiki/Calcite">http://en.wikipedia.org/wiki/Calcite</a></li>
<li>Coccolithophorids: <a href="http://en.wikipedia.org/wiki/Coccolithophore">http://en.wikipedia.org/wiki/Coccolithophore</a></li>
<li>Dolomite: <a href="http://en.wikipedia.org/wiki/Dolomite">http://en.wikipedia.org/wiki/Dolomite</a></li>
<li>Foraminiferans: <a href="http://en.wikipedia.org/wiki/Foraminifera">http://en.wikipedia.org/wiki/Foraminifera</a></li>
<li>Holmes-Farley, R. 2002. Chemistry and the Aquarium: Calcium Carbonate as a Supplement. <i>Advanced Aquarist</i>, 1(7).</li>
<li>Limestone: <a href="http://en.wikipedia.org/wiki/Limestone">http://en.wikipedia.org/wiki/Limestone</a></li>
<li>Ooids: <a href="http://en.wikipedia.org/wiki/Ooid">http://en.wikipedia.org/wiki/Ooid</a></li>
<li>Ooids: <a href="http://www.geologyrocks.co.uk/tutorials/ooid_formation">http://www.geologyrocks.co.uk/tutorials/ooid_formation</a></li>
<li>Rugose corals: <a href="http://en.wikipedia.org/wiki/Rugose_coral">http://en.wikipedia.org/wiki/Rugose_coral</a></li>
<li>Permian-Triassic mass extinction: <a href="http://en.wikipedia.org/wiki/Permian%E2%80%93Triassic_extinction_event">http://en.wikipedia.org/wiki/Permian-Triassic_extinction_event</a></li>
<li>Tabulate corals: <a href="http://en.wikipedia.org/wiki/Tabulate_coral">http://en.wikipedia.org/wiki/Tabulate_coral</a></li>
</ol></div> <br /><br /> <script type="text/javascript"><!-- google_ad_client = "ca-pub-5170032844807535"; /* Square250x250 */ google_ad_slot = "6862474606"; google_ad_width = 250; google_ad_height = 250; //--></script><script type="text/javascript" src="http://pagead2.googlesyndication.com/pagead/show_ads.js"></script>]]></content:encoded>
    <dc:publisher>No publisher</dc:publisher>
    
    <dc:creator>James W. Fatherree</dc:creator>
    <dc:rights>Pomacanthus Publications, Inc.</dc:rights>
    
      <dc:subject>James W. Fatherree</dc:subject>
    
    
      <dc:subject>Aquarium Chemistry</dc:subject>
    
    
      <dc:subject>Dolomite</dc:subject>
    
    
      <dc:subject>Calcite</dc:subject>
    
    
      <dc:subject>Aragonite</dc:subject>
    
    <dc:date>2011-10-26T12:00:00Z</dc:date>
    <dc:type>Page</dc:type>
  </item>


  <item rdf:about="http://www.advancedaquarist.com/2011/9/podcast">
    <title>AmericanReef Video Podcast: Part II - Can Coral Reefs Survive Ocean Acidification and Global Warming?</title>
    <link>http://www.advancedaquarist.com/2011/9/podcast</link>
    <description>American Reef returns to Reef Systems Coral Farms, a collaborator in an important study of how both global warming and increasing ocean acidity affect coral life.   Part 2 of 2.</description>
    <content:encoded xmlns:content="http://purl.org/rss/1.0/modules/content/"><![CDATA[<p><em><strong>Click through to see the images.</strong></em></p> <br /><div id="body">
<p><span class="dropcap">R</span>esearchers from Ohio State University, the University of Delaware, and the University of Georgia plan to identify corals resilient to these stressful conditions, as well as pinpoint factors that could fortify resiliency. Known as the 4Coral Research Group, these scientists hope the results of their experiment can be used by conservationists to focus their preservation efforts. As always, send any questions to <a href="mailto:AmericanReef@me.com" title="mailto:AmericanReef@me.com">AmericanReef@me.com</a> or sound off in the comments below.</p>
<div class="photo-wrapper"><a href="http://www.fishnetwork.tv/AdvancedAquarist/AdvancedAquarist/AmericanReef_-_Advanced_Aquarists_Edition/Entries/2011/9/20_Part_II_-_Can_Coral_Reefs_Survive_Ocean_Acidification_and_Global_Warming_2.html"> <img src="podcast_album/podcast.jpg/image_full" alt="podcast.jpg" class="image-inline" /></a></div>
<p><a href="http://www.fishnetwork.tv/AdvancedAquarist/AdvancedAquarist/AmericanReef_-_Advanced_Aquarists_Edition/Entries/2011/9/20_Part_II_-_Can_Coral_Reefs_Survive_Ocean_Acidification_and_Global_Warming_2.html">Watch The Video...</a></p>
</div> <br /><br /> <script type="text/javascript"><!-- google_ad_client = "ca-pub-5170032844807535"; /* Square250x250 */ google_ad_slot = "6862474606"; google_ad_width = 250; google_ad_height = 250; //--></script><script type="text/javascript" src="http://pagead2.googlesyndication.com/pagead/show_ads.js"></script>]]></content:encoded>
    <dc:publisher>No publisher</dc:publisher>
    
    <dc:creator>Russ Kikel</dc:creator>
    <dc:rights>Pomacanthus Publications, Inc.</dc:rights>
    
      <dc:subject>temperature</dc:subject>
    
    
      <dc:subject>Aquariums</dc:subject>
    
    
      <dc:subject>Russ Kikel</dc:subject>
    
    
      <dc:subject>Water Quality</dc:subject>
    
    
      <dc:subject>Article</dc:subject>
    
    
      <dc:subject>Podcast</dc:subject>
    
    <dc:date>2011-09-29T12:00:00Z</dc:date>
    <dc:type>Page</dc:type>
  </item>


  <item rdf:about="http://www.advancedaquarist.com/2011/8/review">
    <title>Product Review: Inexpensive Analytical Devices: Hanna Instruments' Checkers: Alkalinity and Phosphate</title>
    <link>http://www.advancedaquarist.com/2011/8/review</link>
    <description>In many cases, results from colorimeters are superior to visually judging colored samples. Will an inexpensive device deliver results comparable to an expensive spectrophotometer? Dana tests the Hanna Checkers to find out.</description>
    <content:encoded xmlns:content="http://purl.org/rss/1.0/modules/content/"><![CDATA[<p><em><strong>Click through to see the images.</strong></em></p> <br /><div id="body">
<p><img src="hanna2.jpg" alt="hanna2.jpg" class="image-inline" /></p>
<p><span class="dropcap">W</span>hen I first started work in a laboratory, determination of various aqueous constituents was a laborious task, beginning with mixing standards, manually graphing their absorbances, and then making comparisons with samples' absorbance tests results. We manually recorded this information and charted it on graph paper. It was state-of-the-art for the 1970's. We would be (and are) amazed with today's analytical instruments. Compact, battery-operated colorimeters (a type of spectrometer) use conveniently packaged chemicals to quickly determine concentrations of various aqueous substances.</p>
<div class="photo-wrapper"><a class="popup" href="review_album/image001.jpg" rel="gallery"><img src="review_album/image001.jpg/image_full" alt="image001.jpg" class="image-inline" /></a></div>
<p>Of particular interest to me in this new world of laboratory instruments are devices used to analyze for alkalinity and phosphorus. Hanna Instruments offers relatively inexpensive colorimeters called 'Checkers' priced at about $50-$60 each (including a small supply of reagents, 2 test tubes, and carrying case). These instruments are small and highly portable. But how accurate are they, and are they worthy of your consideration? This article will attempt to answer these questions.</p>
<h2>Hanna Instruments</h2>
<p>Hanna Instruments (Woonsocket, Rhode Island, USA) has been in business since 1978, and today offers over 3,000 products to its customers worldwide. Many of their products are of interest to aquarist and Hanna has in fact targeted the aquarium market. For more details, see 'Contact Information' near the close of this article. Hanna imports the Checkers and their reagents from Europe (Romania).</p>
<h2>Why Test?</h2>
<p>Since you're reading an article about testing for phosphorus and alkalinity, I'll make an assumption you understand the role they play in aquaria. If you'd like to learn more about these, see:</p>
<ol>
<li>Phosphates: <a href="http://reefkeeping.com/issues/2006-09/rhf/index.php">http://reefkeeping.com/issues/2006-09/rhf/index.php</a></li>
<li>Alkalinity: <a href="../../2002/11/chemistry">http://www.advancedaquarist.com/2002/11/chemistry</a></li>
</ol>
<h2>Glossary</h2>
<p>The following terms are used in this article:</p>
<dl> <dt>Cuvette</dt> <dd>A vessel for holding water, especially a transparent laboratory vessel (such as a test tube)</dd> <dt>Colorimeter</dt> <dd>A device for determining the concentration of a substance dissolved in liquid by comparing the intensity of its color with that of standard solution(s) of known concentration(s)</dd> <dt>mg/L</dt> <dd>milligrams per liter, essentially the same thing as ppm</dd> <dt>ppm</dt> <dd>parts per million</dd> <dt>Reagent</dt> <dd>A substance for use in a chemical reaction, especially for analysis</dd> <dt>Spectrometer</dt> <dd>For our purposes, an optical instrument capable of measuring intensity of transmitted light at a specific (but varying) wavelength, especially for determining the concentration of a dissolved substance</dd> <dt>Titrant</dt> <dd>The liquid reagent used in titrations</dd> <dt>Titration</dt> <dd>A method for determining the concentration of an aqueous substance by adding a liquid reagent of known concentration and measuring the volume necessary to convert the substance from one form to another</dd> </dl>
<h2>Methods and Materials</h2>
<p>First of all, the results shown here are simply comparisons of those gathered by different analytical means. No standards were tested, and I am operating on the assumption that results of Hach's EPA-approved methods and a 'laboratory-grade' spectrometer are most accurate. In addition, only one Hanna instrument each was used in these comparisons.</p>
<p>Water, gathered from a functioning marine fish-only aquarium, was used for the testing.</p>
<p>Samples tested for phosphate were gathered in acid-washed glassware and analyzed within a few hours' time. Initial analyses indicated the phosphate content was at the upper detection limits of both instruments used (a Hach DR2800 spectrometer and the Hanna HI-713 colorimeter). Simple dilution with deionized water brought the phosphate to concentrations spanning the full range of both instruments and to levels realistically found in many reef aquaria. The Hanna and Hach devices both use the ascorbic acid chemistry method for analyses.</p>
<p>Comparing alkalinity results is not as straight-forward. The Hanna device estimates alkalinity through colorimetric analysis. Apparently Hanna has made correlation of chromatic shifts (indicating pH) and the impact of an acidic titrant on alkalinity. While making for a quick and convenient test, there are caveats. First, the amount of alkalinity determines the titration endpoint. In addition, the presence or absence of phosphate and/or silica also affects testing protocol (See Table 1 for titration endpoints).</p>
<table class="listing nosort" id="table1">
<caption>Table 1. Titration end-point pH Values.</caption> <thead> 
<tr>
<th colspan="2">Test Condition</th> <th>End-Point pH Values</th>
</tr>
</thead> 
<tbody>
<tr>
<td>Alkalinity Concentration (as ppm CaCO3):</td>
<td>30</td>
<td>4.9</td>
</tr>
<tr>
<td></td>
<td>150</td>
<td>4.6</td>
</tr>
<tr>
<td></td>
<td>500</td>
<td>4.3</td>
</tr>
<tr>
<td colspan="2">Silicates, Phosphates present or suspected</td>
<td>4.5</td>
</tr>
</tbody>
</table>
<p>For comparative purposes, alkalinity values were determining using the Hanna's colorimetric method and an end-point pH titration method. Hach reagents (sulfuric acid, either 0.160 or 1.600N) were used to titrate a magnetically-stirred sample. A calibrated meter monitored pH.</p>
<p>End-points depended upon alkalinity values shown in Table 1 while Figure 1 shows various endpoints based on alkalinity concentrations. Figure 2 is a photo of equipment used in measuring alkalinity according to EPA guidelines.</p>
<div class="photo-wrapper"><a class="popup" href="review_album/image003.png" rel="gallery" title="Figure 1. Titration endpoints for determining alkalinity while using Hach reagents."><img src="review_album/image003.png/image_full" alt="image003.png" class="image-inline" /></a>
<p class="caption">Figure 1. Titration endpoints for determining alkalinity while using Hach reagents.</p>
</div>
<div class="photo-wrapper"><a class="popup" href="review_album/image005.jpg" rel="gallery" title="Figure 2. Measuring alkalinity according to EPA guidelines requires a bit of laboratory equipment."><img src="review_album/image005.jpg/image_full" alt="image005.jpg" class="image-inline" /></a>
<p class="caption">Figure 2. Measuring alkalinity according to EPA guidelines requires a bit of laboratory equipment.</p>
</div>
<p>With background information out of the way, we can now turn our attention to Hanna's HI-755 and HI-713 devices.</p>
<h2>Alkalinity: Hanna Instrument HI-755</h2>
<p>Hanna advertises these specifications for their Alkalinity Checker:</p>
<table class="listing nosort" id="table2">
<caption>Hana Specifications for Alkalinity Checker</caption> <thead> 
<tr>
<th>Item</th> <th>Specification</th>
</tr>
</thead> 
<tbody>
<tr>
<td>Range:</td>
<td>0 to 300 ppm (mg/L) (some retailer ads incorrectly say 250 ppm)</td>
</tr>
<tr>
<td>Resolution:</td>
<td>1 ppm (or mg/L, if you prefer)</td>
</tr>
<tr>
<td>Accuracy :</td>
<td>±5 ppm (mg/L) ±5% of reading @ 25°C (77°F)</td>
</tr>
<tr>
<td>Battery Type:</td>
<td>One 1.5V AAA (included)</td>
</tr>
<tr>
<td>Light Source:</td>
<td>LED @ 610 nm</td>
</tr>
<tr>
<td>Light Detector:</td>
<td>Silicon photocell</td>
</tr>
<tr>
<td>Environment:</td>
<td>0 to 50°C (32 to 122°F); 95% Relative Humidity maximum, non-condensing</td>
</tr>
<tr>
<td>Auto-off:</td>
<td>Yes, after ten minutes of non-use</td>
</tr>
<tr>
<td>Dimensions:</td>
<td>81.5 x 61 x 37.5 mm (3.2 x 2.4 x 1.5")</td>
</tr>
<tr>
<td>Weight:</td>
<td>64 grams (2.25 oz.) - actually a little heavier (~75 g - yes, I checked!)</td>
</tr>
<tr>
<td></td>
<td>Colorimetric method, using a liquid pH indicator (bromcresol green)</td>
</tr>
</tbody>
</table>
<p>As discussed in detail in the Methods and Materials section, the results from the Hanna Checker were compared to analyses performed by the acid titration method using endpoints dictated by alkalinity concentrations and the presence of phosphates and/or silica. The results are shown in Figure 3.</p>
<div class="photo-wrapper"><a class="popup" href="review_album/image006.png" rel="gallery" title="Figure 3. The Hanna Alkalinity Checker consistently reported values higher than those measured by the pH-endpoint titration method, but see Discussion (below)."><img src="review_album/image006.png/image_full" alt="image006.png" class="image-inline" /></a>
<p class="caption">Figure 3. The Hanna Alkalinity Checker consistently reported values higher than those measured by the pH-endpoint titration method, but see Discussion (below).</p>
</div>
<p>Next, we'll look at the Hanna Phosphorus Checker. Hanna advertises these specifications:</p>
<h2>Phosphorus (Low Range), Hanna Instrument HI-713</h2>
<p>Suitable for freshwater, brackish and seawater. Model Tested: HI-713 Phosphorus, Low Range</p>
<table class="listing nosort" id="table3">
<caption>Hana Specifications for Low Range Phosphorus</caption> <thead> 
<tr>
<th>Item</th> <th>Specification</th>
</tr>
</thead> 
<tbody>
<tr>
<td>Range:</td>
<td>0.00 - 2.50 ppm (mg/l) as Phosphate (PO<sub>4</sub><sup>3-</sup>)</td>
</tr>
<tr>
<td>Resolution:</td>
<td>0.01 ppm (mg/l)</td>
</tr>
<tr>
<td>Accuracy :</td>
<td>±4 % of reading @ 25°C (77°F)</td>
</tr>
<tr>
<td>Battery Type:</td>
<td>One 1.5V AAA (included)</td>
</tr>
<tr>
<td>Light Source:</td>
<td>LED @ 610 nm</td>
</tr>
<tr>
<td>Light Detector:</td>
<td>Silicon photocell</td>
</tr>
<tr>
<td>Environment:</td>
<td>0 to 50°C (32 to 122°F); Relative humidity: 95% maximum, non-condensing</td>
</tr>
<tr>
<td>Auto-off:</td>
<td>After two minutes of non-use, and ten seconds after reading</td>
</tr>
<tr>
<td>Dimensions:</td>
<td>81.5 x 61 x 37.5 mm (3.2 x 2.4 x 1.5")</td>
</tr>
<tr>
<td>Weight:</td>
<td>64 grams (2.25 oz.)</td>
</tr>
<tr>
<td>Analytical Chemistry:</td>
<td>Ascorbic Acid Method: Ammonium molybdate and potassium antimonyl tartrate react in an acid medium with ortho-phosphate to form phosphomolybdic acid that is reduced to molybdenum blue by ascorbic acid.</td>
</tr>
<tr>
<td>Interferences:</td>
<td>Silicates in excess of 10 mg/l; highly colored water (such as visibly yellow water)</td>
</tr>
</tbody>
</table>
<p>As discussed in detail in the Methods and Materials section, the results from the Hanna Checker were compared to analyses reported by a Hach 2800 spectrometer and ascorbic acid reagent. The results are shown in Figure 4.</p>
<div class="photo-wrapper"><a class="popup" href="review_album/image008.png" rel="gallery" title="Figure 4. The results generated by the inexpensive Hanna Checker are remarkably close to those reported by a $3,500 spectrometer."><img src="review_album/image008.png/image_full" alt="image008.png" class="image-inline" /></a>
<p class="caption">Figure 4. The results generated by the inexpensive Hanna Checker are remarkably close to those reported by a $3,500 spectrometer.</p>
</div>
<h2>Comments and Recommendations</h2>
<p>In many cases, results from colorimeters (and other photometric devices such as spectrometers) are superior to visually judging (comparing) colored samples. In fact, Standard method states: <i>Visual comparisons of treated samples in Nessler tubes is not better than 5% (more often 10%) whereas photometric analyses can be reliable to within 3%, depending upon many factors</i>. Naturally, the photometric device can eliminate personal biases of the user as well as accurately and precisely differentiate between small increments of sample absorbance/transmission.</p>
<p>If photometric analyses are potentially superior, the question of device engineering and quality becomes the issue (that is, will an inexpensive device deliver results comparable to an expensive one?). Under the conditions stated in the Methods and Materials section (above), these observations and recommendations are made:</p>
<h3>Hanna Alkalinity Checker</h3>
<p>These observations apply to the Hanna Checker HI-755 (Note the instrument is marked 'Checker Marine' suggesting it is intended for seawater analyses only):</p>
<p>Likes:</p>
<ul>
<li>Easy to use</li>
<li>Results are generated in seconds</li>
<li>The procedure is simple - no drip titration is required (just add reagent, shake, and read)</li>
<li>Does not require any manual conversions (results are expressed as parts per million calcium carbonate)</li>
<li>Replacement reagent is inexpensive</li>
<li>Auto-shutoff</li>
<li>Reagents marked with expiration date</li>
<li>Small sample size (10 milliliters)</li>
<li>Spare cuvette included</li>
<li>Directions and MSDS available online</li>
</ul>
<p>Dislikes:</p>
<ul>
<li>Alkalinity measurements were consistently higher than those generated by the titration/pH end-point method</li>
<li>Multiple measurements are not possible without zeroing the instrument each time</li>
<li>No Material Safety Data Sheet included (see below for link)</li>
<li>Reagent will stain skin and clothing (all procedures using organic dyes carry the same risk)</li>
<li>Battery replacement requires a small screwdriver and removal of a tiny screw</li>
</ul>
<p>Recommendation (Alkalinity):</p>
<p>Though my quick comparisons showed the Hanna Alkalinity Checker delivered results consistently higher than those obtained with an EPA-approved method, I am impressed with the speed and ease of measurement. If I were to establish a correction (and comfort) factor to apply to the Hanna Checker's results, this would be my method of choice for establishing alkalinity concentrations.</p>
<p>I recently received a Hach catalog advertising their version of a colorimetric alkalinity test. Hach's chemistry, just as Hanna's, apparently uses bromocresol green sodium salt in the analysis method. It seems this method is becoming widely accepted, if only for estimations (this is not an EPA-accepted procedure).</p>
<p>Recommendation: <i>Yes, with some reservations</i></p>
<p>Footnote:</p>
<ul>
<li>1 ppm Alkalinity as CaCO<sub>3</sub> = 0.02 milliequivalent per liter (meq/L)</li>
<li>1 ppm Alkalinity as CaCO<sub>3</sub> = 0.056 degrees Carbonate Hardness (dKH, or German Hardness)</li>
</ul>
<h3>Hanna Phosphate Checker</h3>
<p>These observations apply to the Hanna Checker HI-713 (Low Range Phosphate):</p>
<p>Likes:</p>
<ul>
<li>Results compare very favorably with those generated by a much more expensive device</li>
<li>Much less expensive than a full-blown spectrometer or photometer</li>
<li>Easy to use and portable</li>
<li>Results are generated in several minutes (including a 3-minute reaction time)</li>
<li>The Checker incorporates a timer</li>
<li>The procedure is simple - Add reagent, shake and bake for several minutes, and read results in parts per million as phosphate</li>
<li>Replacement reagent is competitively priced</li>
<li>Auto-shutoff</li>
<li>Reagents work in fresh, brackish, and saltwater</li>
<li>Reagents marked with expiration date</li>
<li>Low Battery, Dead Battery, Under Range, Over Range, Inverted Cuvettes, High Light and Low Light errors are displayed when appropriate</li>
<li>Small sample size (10 milliliters)</li>
<li>Spare cuvette included</li>
<li>Directions (but not MSDS) available online</li>
</ul>
<p>Dislikes:</p>
<ul>
<li>Test results for phosphate are displayed for only 10 seconds after they are reported</li>
<li>Multiple measurements are not possible without zeroing the instrument each time</li>
<li>No Material Safety Data Sheet available</li>
<li>Battery replacement requires a small screwdriver and removal of a tiny screw</li>
</ul>
<p>Recommendation (Phosphate): <i>Yes!</i></p>
<p>Footnote: To convert PO<sub>4</sub><sup>3</sup> to P, divide by 3.066</p>
<h3>Reagent Cost Comparisons</h3>
<p>The following approximate prices are for replacement reagents only, and do not include instruments (unless noted), taxes, insurance, or shipping costs.</p>
<p>Phosphate:</p>
<ul>
<li>Hanna Phosphate Reagents: $27.99 U.S. per 100 tests</li>
<li>Hach PhosVer3: $28.19 U.S. per 100 tests (10 milliliter sample)</li>
<li>Footnote: The Hanna HI-714 phosphate colorimeter can use Hach reagents (ascorbic acid powder pillows).</li>
</ul>
<p>Alkalinity:</p>
<ul>
<li>Hanna Alkalinity: $9.99 U.S. for 25 tests (~40 cents per test)</li>
<li>Hach: Alkalinity for digital Titrator, $59.17 - includes sulfuric titration cartridges, phenolphthalein and bromcresol green/methyl red reagents. $219 includes reagents and Digital Titrator. To comply with EPA guidelines, a pH meter is also required, and a magnetic stirrer is useful.</li>
<li>Hach's new colorimetric Total Alkalinity test (25-4,000 mg/l as CaCO<sub>3</sub>): 25 tests for $31.45 ($1.26 U.S. per test) using <i>only</i> their spectrometer models DR2800, 3900 and 5000 (Note: These spectrometers begin at about $3,500 U.S.)</li>
</ul>
<h2>Material Safety Data Sheets (MSDS)</h2>
<p>The two kits I obtained did not include Material Safety Data Sheets. Here is a link to the Alkalinity reagent: <a href="http://www.hannainst.com/sds/SDS_HI%20755S_2010-12-14.pdf">http://www.hannainst.com/sds/SDS_HI%20755S_2010-12-14.pdf</a> I could not find a link to the Low Range Phosphate reagents on Hanna's website at the time of this writing.</p>
<h2>Sampling Procedures</h2>
<p><i>"Garbage in; Garbage out"</i> is a saying applicable to results generated when improper sampling procedures are in place. Use reasonable care when gathering samples for analyses. It is recommended that the vials (cuvettes) supplied by Hanna are used when sampling to avoid contamination.</p>
<p>Alkalinity: Analyze immediately or fix sample by refrigerating at 4°C (39.2°F) for up to 24 hours. Bring to room temperature before analysis. If the sample is gathered in a container other than Hanna's cuvette, either clean plastic or glass is OK, and it should be completely filled to avoid prolonged exposure to any air trapped in the bottle. Filter if the sample contains excessive suspended particles.</p>
<p>Phosphate: Analyze immediately. Use the Hanna 10 milliliter cuvette to draw the sample if possible. If not possible, use clean plastic or glass containers - they should be scrupulously clean - preferable acid-washed with 1:1 hydrochloric acid and rinsed with de-ionized water. To fix the sample, exclude particulate matter via filtration and refrigerate at 4°C (or 39.2°F). Maximum holding time is 48 hours.</p>
<p>Treat the cuvettes with respect, and keep them clean and free of scratches. Don't allow the treated samples to remain in the cuvettes any longer than necessary as the chemicals might stain the glass. If the vials do become stained, gently clean them with paper used for sensitive applications (such as that used to clean camera lenses). In extreme cases, a dilute bleach solution may be required to remove the stains. Some hobbyists keep the vials filled with deionized water between uses to prevent spotting within them.</p>
<h2>Other Instruments from Hanna</h2>
<p>Many of Hanna's other instruments may be of interest to aquarist, including:</p>
<ul>
<li>HI-727 Color of Water (0-500 Platinum-Cobalt Units; absorbance @470nm)</li>
<li>HI-736 Phosphate Ultra-low Range (0-200ppb; Ascorbic Acid Method)</li>
<li>HI-718 Iodine (0-12.5 mg/l; DPD Method)</li>
<li>HI-706 Phosphate High Range (0-15mg/l; Ascorbic Acid Method)</li>
<li>HI-717 Phosphate High Range (0-30mg/l; Ascorbic Acid Method)</li>
<li>HI-764 Nitrite Ultra-low Range (0-200 ppb)</li>
</ul>
<h2>Contact Information</h2>
<p>Hanna Instruments has targeted the aquarium market and has devoted a webpage to hobbyists. See: <a href="mailto:aquariums@hannainst.com">aquariums@hannainst.com</a></p>
<p>Specific questions concerning Hanna instruments and aquaculture can be addressed to Jessica Hoagland, Email: <a href="mailto:jhoagland@hannainst.com" title="Email Jessica Hoagland">jhoagland@hannainst.com</a></p>
<p>Or write to:</p>
<p>Hanna Instruments, Inc. <br /> 584 Park East Drive <br /> Woonsocket, RI 02895</p>
<h2>Additional Comments</h2>
<p>These products were obtained through normal retail channels, and descriptions, specifications and other information were current at the time of writing.</p>
<p>Questions? Comments? I am best reached at: RiddleLabs@aol.com or sound off in the comments below.</p>
<h2>References</h2>
<ol>
<li>Holmes-Farley, R., 2006. Phosphate and the reef aquarium. <a href="http://reefkeeping.com/issues/2006-09/rhf/index.php">http://reefkeeping.com/issues/2006-09/rhf/index.php</a></li>
<li>Holmes-Farley, R., 2002. Chemistry and the aquarium: Solving calcium and alkalinity problems. <a href="../../2002/11/chemistry">http://www.advancedaquarist.com/2002/11/chemistry</a></li>
</ol></div> <br /><br /> <script type="text/javascript"><!-- google_ad_client = "ca-pub-5170032844807535"; /* Square250x250 */ google_ad_slot = "6862474606"; google_ad_width = 250; google_ad_height = 250; //--></script><script type="text/javascript" src="http://pagead2.googlesyndication.com/pagead/show_ads.js"></script>]]></content:encoded>
    <dc:publisher>No publisher</dc:publisher>
    
    <dc:creator>Dana Riddle</dc:creator>
    <dc:rights>Pomacanthus Publications, Inc.</dc:rights>
    
      <dc:subject>Alkalinity</dc:subject>
    
    
      <dc:subject>Phosphates</dc:subject>
    
    
      <dc:subject>Water Testing</dc:subject>
    
    
      <dc:subject>Product Review</dc:subject>
    
    
      <dc:subject>Dana Riddle</dc:subject>
    
    
      <dc:subject>Water Quality</dc:subject>
    
    
      <dc:subject>Phosphate</dc:subject>
    
    <dc:date>2011-08-24T12:00:00Z</dc:date>
    <dc:type>Page</dc:type>
  </item>


  <item rdf:about="http://www.advancedaquarist.com/2011/8/podcast">
    <title>AmericanReef Video Podcast: Can Coral Reefs Survive Ocean Acidification and Global Warming?</title>
    <link>http://www.advancedaquarist.com/2011/8/podcast</link>
    <description>American Reef returns to Reef Systems Coral Farms, a collaborator in an important study of how both global warming and increasing ocean acidity affect coral life.   Part 1 of 2.</description>
    <content:encoded xmlns:content="http://purl.org/rss/1.0/modules/content/"><![CDATA[<p><em><strong>Click through to see the images.</strong></em></p> <br /><div id="body">
<p><span class="dropcap">R</span>esearchers from Ohio State University, the University of Delaware, and the University of Georgia plan to identify corals resilient to these stressful conditions, as well as pinpoint factors that could fortify resiliency. Known as the 4Coral Research Group, these scientists hope the results of their experiment can be used by conservationists to focus their preservation efforts. As always, send any questions to <a href="mailto:AmericanReef@me.com" title="mailto:AmericanReef@me.com">AmericanReef@me.com</a> or sound off in the comments below.</p>
<div class="photo-wrapper"><a href="http://www.fishnetwork.tv/AdvancedAquarist/AdvancedAquarist/AmericanReef_-_Advanced_Aquarists_Edition/Entries/2011/8/15_A_Day_with_Sanjay_-_Part_II_2.html"> <img src="podcast_album/podcast.jpg/image_full" alt="podcast.jpg" class="image-inline" /></a></div>
<p><a href="http://www.fishnetwork.tv/AdvancedAquarist/AdvancedAquarist/AmericanReef_-_Advanced_Aquarists_Edition/Entries/2011/8/15_A_Day_with_Sanjay_-_Part_II_2.html">Watch The Video...</a></p>
</div> <br /><br /> <script type="text/javascript"><!-- google_ad_client = "ca-pub-5170032844807535"; /* Square250x250 */ google_ad_slot = "6862474606"; google_ad_width = 250; google_ad_height = 250; //--></script><script type="text/javascript" src="http://pagead2.googlesyndication.com/pagead/show_ads.js"></script>]]></content:encoded>
    <dc:publisher>No publisher</dc:publisher>
    
    <dc:creator>Russ Kikel</dc:creator>
    <dc:rights>Pomacanthus Publications, Inc.</dc:rights>
    
      <dc:subject>temperature</dc:subject>
    
    
      <dc:subject>Aquariums</dc:subject>
    
    
      <dc:subject>Russ Kikel</dc:subject>
    
    
      <dc:subject>Water Quality</dc:subject>
    
    
      <dc:subject>Article</dc:subject>
    
    
      <dc:subject>Podcast</dc:subject>
    
    <dc:date>2011-08-17T12:00:00Z</dc:date>
    <dc:type>Page</dc:type>
  </item>


  <item rdf:about="http://www.advancedaquarist.com/2011/7/aafeature">
    <title>Feature Article: Experimental Comparison of Measured Flow Output of Aquarium Propeller Pumps</title>
    <link>http://www.advancedaquarist.com/2011/7/aafeature</link>
    <description>Hobbyists have seen significant advancements in the range of aquarium circulation pumps available over the past decade. While all manufacturers provide a flow rate for the pumps, it is not clear what methods have been used to arrive at the numbers. Further, different manufacturers may use different methods. We have presented a standard method that we hope can be adopted by the manufacturers thus enabling a more accurate and verifiable approach.</description>
    <content:encoded xmlns:content="http://purl.org/rss/1.0/modules/content/"><![CDATA[<p><em><strong>Click through to see the images.</strong></em></p> <br /><div id="body">
<div><img src="aafeature_album/proppumps2.jpg" alt="leader image" /></div>
<p> </p>
<h2>Abstract</h2>
<p><span class="dropcap">T</span>he purpose of this study was to investigate a method to more accurately determine the output flows of several aquarium propeller pumps. To complete this investigation, a test setup was constructed in a 350 gallon aquarium tank using a <a class="external-link" href="http://www.sontek.com/10mhzadv.php">Sontek 10-MHz Acoustic Doppler Velocimeter</a> for data acquisition. The velocity profile of the pump exit flow was measured at a distance of one diameter downstream from the output of the pumps and used to determine the volume flow rate output. The results of this investigation reveals that there can be large variability between the manufacturer's advertised flow rates for propeller driven pumps and the flow rates measured by this method. The results suggest that a standardized approach to measuring flow should be created to better enable manufacturers to more accurately advertise the correct flow rates so that consumers can choose the appropriate pump for their aquarium.</p>
<h2>Flow in the Aquarium</h2>
<p>Sufficient water movement in aquariums is known to be an important component for animal health and long term success. In general, most reef hobbyist attempt to maximize the water movement within their aquarium (flow rate) using pumps, power heads, or wave devices while minimizing the maximum velocity of the water "hitting" sessile animals. This prevents shearing off of tissue and disturbing the health of corals. The flow rate is defined as the amount or volume of water moved per unit of time and is usually provided in units such as gallons per hour or liters per hour.</p>
<p>However there are no simple rules on how to adequately quantify the amount and type of water motion needed for aquarium success. Reasons for this include the lack of a detailed data and real understanding of the needed water movement or type of movement necessary for specific animals. In general, the amount of water motion for corals has been linked to the location of specimens relative to the reef zone (such as fore reef, reef flats, lagoon, etc). However in reality the water motion in the ocean is very chaotic both in short (seconds, minutes) and long (hours, days and longer) time scales. In an aquarium the amount of achievable flow at any point is further complicated and impacted by both aesthetic (non-living) and living (such as coral) structures, placement of pumps, and tank walls; all of which add friction, change flow direction and constrain or limit water movement. Also any structure in the path of water flow can induce change in flow directions, secondary flows, momentum losses, unsteadiness and turbulence.The aquarium industry characterizes the pumps using the flow rate - amount of water moved per unit of time (eg. Gallons/hr). However, the more accurate definition of volumetric flow rate is " the volume of fluid which passes through a given surface area per unit time" This definition indicates that there is a velocity component to the flow. For a fixed surface area, the volumetric flow rate can be increased or decreased by changing the flow velocity. Also, a fixed flow rate can be achieved by increasing the velocity and reducing the surface area or by decreasing the velocity and increasing the surface area.Given an area <i>A</i>, and a fluid flowing through it with uniform velocity <i>V</i> with an angle away from the perpendicular direction to <i>A</i>, the flow rate is:</p>
<p>Q = (V)(A) cos θ (1)</p>
<p>In the special case where the velocity is perpendicular to A,</p>
<p>Q = (V)(A) (2)</p>
<p>In general, the flow velocity at any location in the ocean (or in the aquarium) can be in any direction and can be defined by a vector or</p>
<p><img src="aafeature_album/equation3.png/image_full" alt="equation3.png" /> (3)</p>
<p>Since the direction and magnitude of the velocity may change in time, the water velocity can also be defined by</p>
<p><img src="aafeature_album/equation4.png/image_full" alt="equation4.png" /> (4)</p>
<p>where <img src="aafeature_album/velocityvector.png" alt="vector" />is the mean velocity component of the fluid and V' is the unsteady or time-varying component . The magnitude and direction of the unsteady component, V'(t) is a function of time. The unsteady component can also be sub-classified as deterministic (such as periodic or coherent variations in water movement due to waves or wakes from the rotating propeller blades) or non-deterministic (random motion or turbulence). Turbulence is initiated by shear or gradients in flowing water and is characterized by chaotic mixing of the water through large scale eddies which spawn ever smaller scale eddies.</p>
<p>In the aquarium, water movement is typically achieved using powerheads or pump driven return pipes and closed loop circuits. The outlet portion of each of these devices results in the generation of a submerged jet similar to what is shown in Figure 1 for a simple submerged turbulent jet. Submerged jets are jets of water that flow into a reservoir (tank) of water. Contrary to common aquarium myth, in most cases, except possibly the smallest powerheads, the jet is turbulent and not laminar. Also, as will be shown in this paper, the exit flows from propeller driven pumps are much more complicated than a simple jet shown below.</p>
<div class="photo-wrapper"><a class="popup" href="aafeature_album/figure_1.jpg" rel="gallery" title="Figure 1. Schematic of simple turbulent jet [1]"><img src="aafeature_album/figure_1.jpg/image_full" alt="figure_1.jpg" class="image-inline" /></a>
<p class="caption">Figure 1. Schematic of simple turbulent jet [1]</p>
</div>
<h2>Introduction</h2>
<p>The use of propeller bladed pumps/powerheads for water movement in the aquarium industry has expanded significantly in the past few years with the advent of DIY, retrofit kits, and specific commercial lines. The first propeller pump available to reef aquarist consumers was created by Jimmy Chen in 2002 and sold as a retrofit kit to be installed on a Little Giant submersible pump [2]. While providing high flow rates with minimal power consumption, this product did not feature the benefit of long term research and development and was plagued by failures. Tunze unvieled the first widely available commercialized propeller pumps at Interzoo in May 2002 branded as the "Tunze Stream." The synchronous models of Stream were available at retail in July 2002 and the controllable models followed in November. They also offered brushless DC models which were capable of speed control through their own proprietary controller.</p>
<p>In 2005 EcoTech Marine introduced a through-the-glass magnetically coupled aquarium pump, using a brushless DC, controllable motor. More recently, Hydor introduced their Koralia line of propeller pumps and made available controllable versions as well. The Hydor line of controllable powerheads is distinctly different from the Tunze and EcoTech Marine products because it utilizes low voltage AC current to drive the pumps and the controllers use frequency modulation to change the speed. The major difference of these two approaches is that brushless DC pumps are typically more expensive but their controllers are relatively inexpensive, whereas low-voltage AC pumps are more economical however their controller is expensive to produce. Generally, brushless DC pumps are capable of more precise rpm changes to enable flow augmentations such as pulsing for waves generation.</p>
<p>The objective of the current experiment was to investigate a more accurate method to determine the volumetric flow rates for widely available models of propeller pumps. The advantage of propeller pumps is that they are capable of moving large volumes of water at very low pressures with minimal power consumption. Some DIY methods of measuring the flow rate of small pumps include timed bag filling experiments, pumping from one reservoir to another and placing the powerheads in a constrained systems (inlet or exit piped) with a flow meter. These types of tests however, can impart unrealistic hydrodynamic loads on the propeller pumps by altering the inlet and/or exit flows in ways that are not typically seen in our aquarium set ups. Adding piping and other constraints such as bags on the exit jet may impart back-pressure that can affect the pump's performance. These DIY methods add additional blockage (similar to covering the exit jet or inlet grating) which negatively reflects the true flowrate of the pump. In addition, the pump exit jet flow tends to expand radially as it exits the nozzle as shown in the Figure 1. Any intrusive method (such as a bag, added piping, increased pressure head between reservoirs) adds momentum and friction losses not accounted by most measurement methodologies. Therefore more sophisticated methods must be employed to obtain accurate flow readings from propeller driven pumps. An experimental method was developed incorporating acoustic Doppler velocimetry (ADV) technology, which has been used to measure open channel flow. The advantage of this methodology is that it is nearly non-intrusive and does not apply backpressure to the pump. It also measures the flow velocities directly in contrast to diffusion/dissolving methods which only infer flow rates [3].</p>
<p>The pumps included in this study are listed in Table 1 along with their manufacturer's advertised flowrate. Due to the expense of some of these products and constraints on the budget, every product on the market could not be included in this evaluation. The study was restricted to the following list of pumps shown in Table 1.</p>
<table class="listing nosort" id="table1">
<caption>Table 1. Pumps included in flow experiment</caption> <thead> 
<tr>
<th>Pump</th> <th>Advertised Output Flow (Gallons/hr)</th>
</tr>
</thead> 
<tbody>
<tr>
<td>Aqueon 2400</td>
<td>2400</td>
</tr>
<tr>
<td>Coralife CP 2900</td>
<td>2900</td>
</tr>
<tr>
<td>Ecotech Marine MP-10</td>
<td>1575</td>
</tr>
<tr>
<td>Ecotech Marine MP-40</td>
<td>3200</td>
</tr>
<tr>
<td>Ecotech Marine MP-60</td>
<td>7500</td>
</tr>
<tr>
<td>Hydor Koralia 5</td>
<td>1650</td>
</tr>
<tr>
<td>Hydor Koralia 6</td>
<td>2200</td>
</tr>
<tr>
<td>Hydor Koralia 7</td>
<td>2700</td>
</tr>
<tr>
<td>Hydor Koralia 8</td>
<td>3250</td>
</tr>
<tr>
<td>Maxijet 1200</td>
<td>295</td>
</tr>
<tr>
<td>Tunze 6105</td>
<td>3434</td>
</tr>
<tr>
<td>Tunze 6205</td>
<td>5811</td>
</tr>
<tr>
<td>Tunze 6305</td>
<td>7925</td>
</tr>
</tbody>
</table>
<p>The majority of the pumps included in this test cater to the high-end saltwater aquarium market. A less expensive traditional impeller driven Maxijet 1200 powerhead was included in this test as a comparison to propeller pumps.</p>
<h2>Theory</h2>
<p>Because these propeller based aquarium pumps operate between two fluid reservoirs that are at the same pressure, one cannot simply displace water from one reservoir to another without adversely affecting the accuracy of the measured volume flow rate. For this reason, a velocity measurement of flow is needed to determine the true volume flow rate through the pump. A single velocity measurement is not sufficient for propeller pumps since the flow velocity varies across the large diameter cross section of the exit nozzle. To accurately measure the velocity of the flow across the entire output profile, several sample measurements were taken at locations ranging from the very outside of the flow jet to the center of the flow jet. For the purpose of this experiment, the flow was divided into <i>n</i> distinct regions, illustrated in Figure 2.</p>
<div class="photo-wrapper"><a class="popup" href="aafeature_album/figure_2.jpg" rel="gallery" title="Figure 2. Division of flow based on radial position"><img src="aafeature_album/figure_2.jpg/image_full" alt="figure_2.jpg" class="image-inline" /></a>
<p class="caption">Figure 2. Division of flow based on radial position</p>
</div>
<p>After measuring the flow velocity in these regions, the subsequent volume flow rate of the region can be found using</p>
<p>VFR<sub>i</sub> = V<sub>i</sub>*A<sub>i</sub> (5)</p>
<p>where, <i>VFR<sub>i</sub></i> is the volume of water flowing per unit time through the incremental area <i>A<sub>i</sub></i> at velocity <i>V<sub>i</sub></i> . This calculation can be repeated over the velocity profile to yield the total volume flow rate of the system. This idea can be expressed as</p>
<p>VFR<sub>s</sub> = Σ V<sub>i</sub> * A<sub>i</sub>. (6)</p>
<p>The area of each region can be calculated using</p>
<p>A<sub>i</sub> = π * (r<sub>i</sub><sup>2</sup>-r<sub>(i-1)</sub><sup>2</sup>). (7)</p>
<p>This type of calculation is known as a Reimann Sum, and is used to approximate real-world integration. The accuracy of this method depends greatly on the number of iterations completed.</p>
<h2>Experimental Apparatus</h2>
<p>For this experiment, a test setup needed to be developed that would accurately measure the velocity of water flow over a series of points across the flow profile. To accomplish this task, a Sontek 10-MHz Acoustic Doppler Velocimeter was selected for its ability to measure open-channel flow in a volume of water as small as 0.25 cc. The ADV selected also had the capability of measuring 3-Dimensional flow. Table 2 is taken from Sontek's literature for the 10 MHz ADV used.</p>
<p>The ADV that was used to collect the velocity measurements was positioned using an extruded aluminum scaffolding system shown in Figure 3. The system was designed to be adjustable in the three dimensions shown, labeled X, Y, and Z. The vectors shown correspond to the ADV measurements taken for the X, Y, and Z directions.</p>
<p>To accurately measure the position of the ADV over the course of each trial, the scaffolding structure in Figure 3 was fitted with Wixey Model WR510 digital positioning gauges on both the Z and the Y axes. The specifications for the gauges used are shown in Table 3.</p>
<table class="listing nosort" id="table2">
<caption>Table 2. Sontek Adv Specifications</caption> <thead> 
<tr>
<th colspan="2">Sontek 10 MHz ADV</th>
</tr>
</thead> 
<tbody>
<tr>
<td>Sampling Rate <a name="RANGE_A2_B12"></a></td>
<td>0.1 to 25 Hz</td>
</tr>
<tr>
<td>Sampling Volume</td>
<td>0.25 cc</td>
</tr>
<tr>
<td>Distance to Sampling Volume</td>
<td>10 cm</td>
</tr>
<tr>
<td>Resolution</td>
<td>0.01 cm/s</td>
</tr>
<tr>
<td>Programmed Velocity Range</td>
<td>3, 10, 30, 100, 250 cm/s</td>
</tr>
<tr>
<td>Accuracy</td>
<td>1% of measured velocity, 0.25 cm/s</td>
</tr>
<tr>
<td>Maximum Depth</td>
<td>60 m</td>
</tr>
<tr>
<td>Temperature Sensor</td>
<td>0.1°C</td>
</tr>
<tr>
<td>Resolution - Heading,Pitch, Roll</td>
<td>0.1°</td>
</tr>
<tr>
<td>Accuracy - Heading</td>
<td>±2°</td>
</tr>
<tr>
<td>Accuracy - Pitch, Roll</td>
<td>±1°</td>
</tr>
</tbody>
</table>
<div class="photo-wrapper"><a class="popup" href="aafeature_album/figure_3.jpg" rel="gallery" title="Figure 3. Scaffolding support structure for ADV positioning"><img src="aafeature_album/figure_3.jpg/image_full" alt="figure_3.jpg" class="image-inline" /></a>
<p class="caption">Figure 3. Scaffolding support structure for ADV positioning</p>
</div>
<table class="listing nosort" id="table3">
<caption>Table 3. Specifications for Wixley Model WR 510</caption> <thead> 
<tr>
<th colspan="2">Wixey Model WR 510</th>
</tr>
</thead> 
<tbody>
<tr>
<td>Resolution:</td>
<td>Decimal = .005 in.</td>
</tr>
<tr>
<td></td>
<td>Fraction = 1/32 in.</td>
</tr>
<tr>
<td></td>
<td>Metric = 0.1 mm</td>
</tr>
<tr>
<td></td>
<td></td>
</tr>
<tr>
<td>Accuracy:</td>
<td>Decimal = .0025 in.</td>
</tr>
<tr>
<td></td>
<td>Fraction = 1/500 in.</td>
</tr>
<tr>
<td></td>
<td>Metric = .05 mm</td>
</tr>
</tbody>
</table>
<p>Figure 4 shows the setup of the positioning and integration of one of the gauges used. This test setup allowed for accurate recording of the position of the ADV to within 0.05 mm, as listed in the specifications. Because positioning in the X direction was less critical, a tape measure was used to position the ADV at approximately one diameter downstream from the face of the pump, +/- 1/32<sup>nd</sup> of an inch.</p>
<div class="photo-wrapper"><a class="popup" href="aafeature_album/figure_4.jpg" rel="gallery" title="Figure 4. Integration of digital positioning gauges into scaffolding structure"><img src="aafeature_album/figure_4.jpg/image_full" alt="figure_4.jpg" class="image-inline" /></a>
<p class="caption">Figure 4. Integration of digital positioning gauges into scaffolding structure</p>
</div>
<p>Figure 5 shows the final ADV positioning for testing of the Tunze 6305. As shown in the figure, the ADV is positioned at the centerline of the pump face and one diameter downstream from the face.</p>
<p>Figure 5 also shows the particulate matter that was suspended in the tank for the duration of testing. These particulates were the seeding material provided by Sontek in order to increase the signal-to-noise ratio returned by the velocimeter.</p>
<div class="photo-wrapper"><a class="popup" href="aafeature_album/figure_5.jpg" rel="gallery" title="Figure 5. Initial positioning of the ADV during testing"><img src="aafeature_album/figure_5.jpg/image_full" alt="figure_5.jpg" class="image-inline" /></a>
<p class="caption">Figure 5. Initial positioning of the ADV during testing</p>
</div>
<p>Besides the velocity components and standard deviation of the axial velocity, the power consumption and the rotational speed of each pump were recorded. The power consumption was monitored through a wattmeter which is shown in Figure 6. The rotational speed of each pump was determined using the strobe tachometer shown in Figure 7. Figure 8 shows the tachometer in use while testing the Coralife CP 2900.</p>
<div class="photo-wrapper"><a class="popup" href="aafeature_album/figure_6.jpg" rel="gallery" title="Figure 6. Watt meter used in testing"><img src="aafeature_album/figure_6.jpg/image_full" alt="figure_6.jpg" class="image-inline" /></a>
<p class="caption">Figure 6. Watt meter used in testing</p>
</div>
<div class="photo-wrapper"><a class="popup" href="aafeature_album/figure_7.jpg" rel="gallery" title="Figure 7. Strobe tachometer used in testing"><img src="aafeature_album/figure_7.jpg/image_full" alt="figure_7.jpg" class="image-inline" /></a>
<p class="caption">Figure 7. Strobe tachometer used in testing</p>
</div>
<div class="photo-wrapper"><a class="popup" href="aafeature_album/figure_8.jpg" rel="gallery" title="Figure 8: Coralife pump as seen under strobe lighting"><img src="aafeature_album/figure_8.jpg/image_full" alt="figure_8.jpg" class="image-inline" /></a>
<p class="caption">Figure 8: Coralife pump as seen under strobe lighting</p>
</div>
<h2>Test Procedure</h2>
<p>Before testing could begin on any of the pumps, an appropriate measurement time duration needed to be established to ensure that enough samples were taken to accurately represent the measured flow velocity and minimize measurement bias. To determine this duration, a value of the turbulence intensity was determined for several trials of differing time durations. The turbulence intensity F<sub>T</sub> is calculated using Equation 11, where  is the standard deviation of the axial velocity and V<sub>avg</sub> is the mean of the sample velocity.</p>
<p>F<sub>T</sub> =  σ / V<sub>avg</sub> (8)</p>
<p>The turbulence intensity is a value representing the degree of unsteadiness or fluctuations in the measured flow field. An ideal steady flow with absolutely no fluctuations would have a turbulence intensity value of zero. When measuring unsteady flows, care must be taken to ensure that the fluctuations are accounted for and do not lead to temporal biasing of the mean velocity measurements. Theoretically, the mean velocity and turbulence intensity values will approach constant values as the sample time is increased to infinity. The reason for this is that as sample time is increased, any temporal bias in the measurement will be reduced.</p>
<p>During the test, two trials were averaged at various time intervals to produce the data shown in Table 4. The data was then plotted in Figure 9 to locate the "shoulder" of the curve, or the point that would produce reliable and accurate velocity data.</p>
<table class="listing nosort" id="table4">
<caption>Table 4. Turbulence factors calculated for various time durations. <br /> Turbulence Intensity Data</caption> <thead> 
<tr>
<th>Time (sec)</th> <th>Sigma (ft/sec)</th> <th>V (ft/sec)</th> <th>F<sub>T</sub></th>
</tr>
</thead> 
<tbody>
<tr>
<td>0</td>
<td>0.30</td>
<td>2.5</td>
<td>0.120</td>
</tr>
<tr>
<td>20</td>
<td>0.21</td>
<td>2.2</td>
<td>0.095</td>
</tr>
<tr>
<td>30</td>
<td>0.14</td>
<td>2.4</td>
<td>0.058</td>
</tr>
<tr>
<td>40</td>
<td>0.12</td>
<td>2.3</td>
<td>0.052</td>
</tr>
<tr>
<td>45</td>
<td>0.11</td>
<td>2.5</td>
<td>0.044</td>
</tr>
<tr>
<td>50</td>
<td>0.11</td>
<td>2.5</td>
<td>0.044</td>
</tr>
<tr>
<td>60</td>
<td>0.11</td>
<td>2.4</td>
<td>0.046</td>
</tr>
</tbody>
</table>
<div class="photo-wrapper"><a class="popup" href="aafeature_album/figure_9.jpg" rel="gallery" title="Figure 9. Turbulence Intensity plotted for various time durations"><img src="aafeature_album/figure_9.jpg/image_full" alt="figure_9.jpg" class="image-inline" /></a>
<p class="caption">Figure 9. Turbulence Intensity plotted for various time durations</p>
</div>
<p>As shown in Figure 9, the point at which the turbulence intensity curve leveled off was found to be about 45 seconds. This duration was determined adequate to represent the velocity data for the pumps. For the extent of the test, velocity samples were taken using this time duration for sampling at each location.</p>
<div class="photo-wrapper"><a class="popup" href="aafeature_album/figure_10.jpg" rel="gallery" title="Figure 10. Illustration of velocity measurement locations"><img src="aafeature_album/figure_10.jpg/image_full" alt="figure_10.jpg" class="image-inline" /></a>
<p class="caption">Figure 10. Illustration of velocity measurement locations</p>
</div>
<p>With the time of each sample established, flow testing on the pumps could begin. The output nozzle diameter was measured for each pump and recorded for later use. Flow testing was broken down into two sets of trials for each pump: a horizontal set and a vertical set. The two data sets allowed the flow to be broken into four quadrants, providing a more accurate measure of the entire velocity profile. The data points taken are shown in Figure 10.</p>
<p>To begin taking data, the ADV was positioned such that the sampling volume of the measurement corresponded to the center of the pump output and was located one diameter downstream of the nozzle, as illustrated in Figure 5. The ADV was first positioned well outside the range of the flow, which was defined as a stagnant, or near zero, X velocity. The velocimeter was then moved in the positive Y direction across the velocity profile in 5mm increments until a non-stagnant X velocity was observed. Velocity measurements were then recorded for successive 5mm increments for the entirety of the profile until a stagnant velocity was reached at the corresponding location on the opposite side of the flow jet. This process was repeated moving the ADV vertically to achieve the measurements shown in Figure 10.</p>
<p>The raw data taken during the testing needed to be corrected before it could be used to calculate the volume flow rate. To begin, the velocity measurements taken from the velocimeter were in component form. The three velocity components (along the X, Y and Z axis) needed to be combined through vector addition in order to produce the final velocity measurement for the given location. This process is described through Equation 12, where V<sub>total</sub> is the combined velocity, and V<sub>x,y,z</sub> are the individual component velocities. This is an important step as the rotating propeller blades in many of the tested designs swirl the flow in a screw like fashion. The exit jet also expands as it leaves the pump. A simple one component velocity measurement may underestimate the actual water velocity.</p>
<p>V<sub>total</sub> = (V<sub>x</sub><sup>2</sup> + V<sub>y</sub><sup>2</sup> + V<sub>z</sub><sup>2</sup>)<sup>1/2</sup> (12)</p>
<p>The next modification to the data was made to "center" the measured points. This process was done to ensure that the velocity measurements taken matched up correctly to their radial location used in the flow calculation. Centering the data involved a set of criteria described below:</p>
<ul>
<li>If the data contained an obvious flow deficit ("void") which represented the center of the propeller, the data was centered such that the void was assigned a radial position of 0 mm.</li>
<li>If the measured data did not contain an obvious flow deficit the data was centered symmetrically over a radial position of 0 mm.</li>
</ul>
<p>To measure the rotational speed of the pumps, a small mark was painted on one side of the propeller, and the pump was turned on and set to the maximum speed. The strobe tachometer was positioned outside the aquarium facing the pump. The speed of the tachometer was adjusted until the mark on the propeller appeared stationary, and the RPM value displayed was recorded.</p>
<p>To measure the power consumed by each pump, the power source was run through the wattmeter shown in Figure 6. There was often a "settling" period observed where the pump initially drew slightly higher wattages, so the power value was recorded after taking the velocity measurements.</p>
<p>One exception made to this procedure was the measurements made on the MaxiJet 1200. This pump had an output diameter of less than ½", making measurement difficult at one diameter downstream. To compensate for the small output radius and ensure enough data points were taken, the ADV was positioned 1" downstream from the face of the pump. Due to the lack of a visual propeller on the MaxiJet, the pump speed was not measured.</p>
<h2>Results</h2>
<p>Using the data collected, the flow profiles of the pumps was computed in the Z (vertical) and Y(horizontal) directions. The majority of the pumps tested produced nearly symmetric velocity profiles. Figures 11, 12 and 13 show the Ecotech Marine MP-60, the Tunze 6305, and the Hydor Koralia 8, respectively, which are examples of pumps that exhibited somewhat symmetrical flow fields. These figures show the results of both the horizontal and the vertical data sets for each pump. In these examples, it is seen that the MP-60 and Tunze 6305 produced a broad and comparably gentle flow, where the Koralia 8 produced a more concentrated jet with a higher peak velocity. The flow profiles for all the pumps is presented in Appendix 2. The reader should note the differences in complexity of the flow generated by the propeller generated pumps compared to that of a traditional impeller driven powerhead like the Maxijet 1200 (see Figure Appendix 2.7). The complexity of their exit flow field that makes simple single point measurement methods unreliable in determining rated flow rates.</p>
<div class="photo-wrapper"><a class="popup" href="aafeature_album/figure_11.jpg" rel="gallery" title="Figure 11. Velocity Profile of Ecotech Marine VorTech MP-60"><img src="aafeature_album/figure_11.jpg/image_full" alt="figure_11.jpg" class="image-inline" /></a>
<p class="caption">Figure 11. Velocity Profile of Ecotech Marine VorTech MP-60</p>
</div>
<div class="photo-wrapper"><a class="popup" href="aafeature_album/figure_12.jpg" rel="gallery" title="Figure 12. Velocity Profile of Tunze 6305"><img src="aafeature_album/figure_12.jpg/image_full" alt="figure_12.jpg" class="image-inline" /></a>
<p class="caption">Figure 12. Velocity Profile of Tunze 6305</p>
</div>
<div class="photo-wrapper"><a class="popup" href="aafeature_album/figure_13.jpg" rel="gallery" title="Figure 13. Velocity Profile of Hydor Koralia 8"><img src="aafeature_album/figure_13.jpg/image_full" alt="figure_13.jpg" class="image-inline" /></a>
<p class="caption">Figure 13. Velocity Profile of Hydor Koralia 8</p>
</div>
<h3>Uncertainity and Error</h3>
<p>While the Sontek specifications state a measured accuracy of +/- 1% of the reading, in actual situations this error will be higher. There are several sources of error and uncertainity that contribute to the flow calculations, some of which are listed below</p>
<ul>
<li class="ListParagraph">Approximations used for integration depend on the granularity of data and number of points sampled</li>
<li class="ListParagraph">Unsteady nature of the flow field, due to blade wake passing, asymmetric or blocked inflow, inlet and exit grill interactions, ADV vibrations, etc.</li>
</ul>
<p>While all the associated uncertainties are difficult to quantify without detailed analysis and huge investments in time and effort, based on our experience with flow measurements it is reasonable to expect that the error range of the calculated volumetric flow rates to be limited to 5-7% of the reported values.</p>
<p>Based on these flow profiles, the volumetric flow rate was calculated. The results are presented in Table 5. The column on the far right labeled "% Change from Manufacturer's Claim" is a comparison between the calculated experimental flow and the manufacturer's stated maximum output flow. This calculation is expressed by</p>
<p><img src="aafeature_album/equation13.png" alt="equation" /> (13)</p>
<p>Table 5 represents the data such that a positive change indicates an increase in the observed flow from the manufacturer's claim and vice versa. The data is shown graphically in figure 15.</p>
<table class="listing nosort" id="table5">
<caption>Table 5. Test results for the various pumps at maximum power</caption> <thead> 
<tr>
<th>Pump</th> <th>Pump Speed (RPM)</th> <th>Power Use (Watts)</th> <th>Calculated Flow (Gal/hr)</th> <th>% Change of Mean from Manufacturer's Rate</th>
</tr>
</thead> 
<tbody>
<tr>
<td>Aqueon 2400</td>
<td>3600</td>
<td>14.2</td>
<td>2744</td>
<td>14.30%</td>
</tr>
<tr>
<td>Coralife CP 2900</td>
<td>3600</td>
<td>18.8</td>
<td>2437.2</td>
<td>-16.00%</td>
</tr>
<tr>
<td>Hydor Koralia 5</td>
<td>3600</td>
<td>22</td>
<td>2597.59</td>
<td>57.43%</td>
</tr>
<tr>
<td>Hydor Koralia 6</td>
<td>3600</td>
<td>21.8</td>
<td>2205.6</td>
<td>0.30%</td>
</tr>
<tr>
<td>Hydor Koralia 7</td>
<td>3600</td>
<td>12</td>
<td>2659.1</td>
<td>-1.50%</td>
</tr>
<tr>
<td>Hydor Koralia 8</td>
<td>3600</td>
<td>18</td>
<td>3188.3</td>
<td>-1.90%</td>
</tr>
<tr>
<td>MaxiJet 1200</td>
<td>Unknown</td>
<td>20.7</td>
<td>405.7</td>
<td>37.50%</td>
</tr>
<tr>
<td>Tunze 6105</td>
<td>3250</td>
<td>24</td>
<td>2358.2</td>
<td>-31.30%</td>
</tr>
<tr>
<td>Tunze 6205</td>
<td>3160</td>
<td>45</td>
<td>3234</td>
<td>-44.30%</td>
</tr>
<tr>
<td>Tunze 6305</td>
<td>3060</td>
<td>48</td>
<td>3597.3</td>
<td>-54.60%</td>
</tr>
<tr>
<td>VorTech MP-10</td>
<td>3270</td>
<td>19.8</td>
<td>2460.3</td>
<td>56.20%</td>
</tr>
<tr>
<td>VorTech MP-40</td>
<td>2440</td>
<td>29</td>
<td>3781.2</td>
<td>18.20%</td>
</tr>
<tr>
<td>VorTech MP-60</td>
<td>2100</td>
<td>53</td>
<td>8509.8</td>
<td>13.5%</td>
</tr>
</tbody>
</table>
<div class="photo-wrapper"><a class="popup" href="aafeature_album/figure_14_pump_flowrate.jpg" rel="gallery" title="Figure 14. Comparison of Advertised Output Flowrates with Measured Output Flowrates"><img src="aafeature_album/figure_14_pump_flowrate.jpg/image_full" alt="figure_14_pump_flowrate.jpg" class="image-inline" /></a>
<p class="caption">Figure 14. Comparison of Advertised Output Flowrates with Measured Output Flowrates</p>
</div>
<p>Another metric that could be use to evaluate the pumps is the Flow Efficiency, measured as the ratio of measured flowrate to actual power consumed. Table 6 and Figure 15 summarizes the flow efficiencies in units of GPH/watt. As shown, the pumps are broken into three different categories: AC (non-controllable), ACC (controllable), and DC (controllable). While the AC models offer better flow efficiencies, they do not offer the flexibility of output modification or advanced programming. The highest efficiency for the ACC pumps was the Hydor Koralia 7 and for the DC pumps was the Ecotech Marine Vortech MP-60.</p>
<table class="listing nosort" id="table6">
<caption>Table 6. Summary of flow Efficiencies</caption> <thead> 
<tr>
<th>Pump</th> <th>Flow/Power (GPH/watt)</th> <th>Power Type (AC/DC)</th>
</tr>
</thead> 
<tbody>
<tr>
<td>Aqueon 2400</td>
<td>193.2</td>
<td>AC</td>
</tr>
<tr>
<td>Coralife CP 2900</td>
<td>129.6</td>
<td>AC</td>
</tr>
<tr>
<td>Hydor Koralia 5</td>
<td>118.8</td>
<td>ACC</td>
</tr>
<tr>
<td>Hydor Koralia 6</td>
<td>101.2</td>
<td>ACC</td>
</tr>
<tr>
<td>Hydor Koralia 7</td>
<td>221.6</td>
<td>ACC</td>
</tr>
<tr>
<td>Hydor Koralia 8</td>
<td>177.1</td>
<td>ACC</td>
</tr>
<tr>
<td>MaxiJet 1200</td>
<td>19.6</td>
<td>AC</td>
</tr>
<tr>
<td>Tunze 6105</td>
<td>98.3</td>
<td>DC</td>
</tr>
<tr>
<td>Tunze 6205</td>
<td>71.9</td>
<td>DC</td>
</tr>
<tr>
<td>Tunze 6305</td>
<td>74.9</td>
<td>DC</td>
</tr>
<tr>
<td>Vortech MP-10</td>
<td>124.3</td>
<td>DC</td>
</tr>
<tr>
<td>Vortech MP-40</td>
<td>130.4</td>
<td>DC</td>
</tr>
<tr>
<td>Vortech MP-60</td>
<td>160.6</td>
<td>DC</td>
</tr>
</tbody>
</table>
<div class="photo-wrapper"><a class="popup" href="aafeature_album/figure_15_flow_efficiencies.jpg" rel="gallery" title="Figure 15. Flow Efficiency of the Pumps Tested"><img src="aafeature_album/figure_15_flow_efficiencies.jpg/image_full" alt="figure_15_flow_efficiencies.jpg" class="image-inline" /></a>
<p class="caption">Figure 15. Flow Efficiency of the Pumps Tested</p>
</div>
<h2>Conclusions</h2>
<p>A standard method for evaluating flow rates of pumps using ADV was developed, and applied to measurement of flow of several popular aquarium propeller pumps. Data obtained during this study shows that the generated flow field is more complex than a simple submerged jet and therefore single point measurements may not accurately represent the flow rate. After the completion of this experiment, it is clear that there is a difference between many of the measured results and their manufacturer's advertised performance. While most aquarium manufacturers are within a reasonable range of their claimed flows, there were some notable exceptions. As shown, measured values of volume flow rate for the Aqueon, MaxiJet, and EcoTech Marine models were generally higher than advertised flow outputs. The Hydor 6, 7, and 8 were measured to within 2% of the manufacture specifications. The Hydor 5 and Vortech MP-10 both presented an anomaly in that they produced 55-60% more flow than claimed. In fact, the Koralia 5 that was tested produced significantly more flow than the Koralia 6, and almost matched the output of the Koralia 7. The reason for this difference in claimed and experimental flow measurements is unknown.</p>
<p>On the other hand, for the Tunze units' measured flow rates were consistently under the advertised flow rates on the models tested. In the case of the Tunze 6305, the measured flow was less than half that of the manufacturer's claimed flow. Further investigation may be needed to determine how this manufacturer originally developed the advertised flow rates of each of its models (see Addendum).</p>
<p>Another conclusion that can be drawn from this experiment is that there is a wide range of flow efficiencies shown. The flow efficiency, or unit of flow observed per unit of power consumed, varies greatly from manufacturer-to-manufacturer and model-to-model. The flow efficiency values are presented in Table 6.</p>
<p>Hobbyists have seen significant advancements in the range of aquarium circulation pumps available over the past decade. While all manufacturers provide a flow rate for the pumps, it is not clear what methods have been used to arrive at the numbers. Further, different manufacturers may use different methods. We have presented a standard method that we hope can be adopted by the manufacturers thus enabling a more accurate and verifiable approach.</p>
<h2>Addendum</h2>
<p>On completion of the study, the paper was sent to Tunze and Hydor prior to this publication. Based on these results, Tunze conducted its own independent tests on the Tunze pumps and have confirmed our results. On furthe<a name="_GoBack"></a>r discussion with Tunze we do not feel the errors were deliberate attempts to mislead, but rather their misguided faith in theoretical calculations that often do not translate well into real world application and use. In light of these finding Tunze is working to remedy the situation. For any resolution on how Tunze will address this please refer to Tunze's website for more information.</p>
<h2>Acknowledgment</h2>
<p>We would like to thank EcoTech Marine for providing the large aquarium and renting the equipment needed for the study. The work was performed under the technical guidance and consultation with Bill Straka and Sanjay Joshi of Penn State University. The data was collected by Mike Sandford during his summer internship at EcoTech Marine.</p>
<h2>References</h2>
<ol>
<li>Blevins, R. D., <i>Applied Fluid Dynamics Handbook</i>, Van Nostrand Reinhold Co., New York, 1984.</li>
<li>Harker, Richard. "Product Review: Propeller Pumps In The Aquarium." <i>Advanced Aquarist</i>. Pomacanthus Publications, LLC. Web., <a href="../../2002/6/review">http://www.advancedaquarist.com/2002/6/review</a>.</li>
<li>Riddle, Dana. "Feature Article: Measuring Water Movement in Your Reef Aquarium for Less Than $100." Advanced Aquarist. Pomacanthus Publications, LLC. Web., <a href="http://www.advanceda quarist.com/2011/1/aafeature">http://www.advanceda quarist.com/2011/1/aafeature</a>.</li>
<li>Taylor, John R. "Chapter 3." <i>An Introduction to Error Analysis: the Study of Uncertainties in Physical Measurements</i>. Sausalito, CA: University Science, 1997. Print.</li>
</ol>
<h2>Appendix 1: Example of Sample Data (Data Sample from Ecotech Marine Vortech MP-40)</h2>
<p>Editor's note: The original article contained an embedded table that was to be displayed in-line with the article. Due to width constraints, we have instead converted this data into an image and are providing the data as an Excel spreadsheet and Adobe PDF.</p>
<ul>
<li><a href="aafeature.xls">Excel File</a></li>
<li><a href="aafeature.pdf">Adobe PDF File</a></li>
</ul>
<div class="photo-wrapper"><a class="popup" href="aafeature_album/appendix_1.png" rel="gallery"><img src="aafeature_album/appendix_1.png/image_full" alt="appendix_1.png" class="image-inline" /></a></div>
<h2>Appendix 2: Plots of Velocity Profiles</h2>
<div class="photo-wrapper"><a class="popup" href="aafeature_album/appendix_2_1.jpg" rel="gallery" title="Appendix 2.1. Velocity profiles of the Aqueon 2400"><img src="aafeature_album/appendix_2_1.jpg/image_full" alt="appendix_2_1.jpg" class="image-inline" /></a>
<p class="caption">Appendix 2.1. Velocity profiles of the Aqueon 2400</p>
</div>
<div class="photo-wrapper"><a class="popup" href="aafeature_album/appendix_2_2.jpg" rel="gallery" title="Appendix 2.2. Velocity profiles of the Coralife CP 2900"><img src="aafeature_album/appendix_2_2.jpg/image_full" alt="appendix_2_2.jpg" class="image-inline" /></a>
<p class="caption">Appendix 2.2. Velocity profiles of the Coralife CP 2900</p>
</div>
<div class="photo-wrapper"><a class="popup" href="aafeature_album/appendix_2_3.jpg" rel="gallery" title="Appendix 2.3. Velocity profiles of the Hydor Koralia 5"><img src="aafeature_album/appendix_2_3.jpg/image_full" alt="appendix_2_3.jpg" class="image-inline" /></a>
<p class="caption">Appendix 2.3. Velocity profiles of the Hydor Koralia 5</p>
</div>
<div class="photo-wrapper"><a class="popup" href="aafeature_album/appendix_2_4.jpg" rel="gallery" title="Appendix 2.4. Velocity profiles of the Hydor Koralia 6"><img src="aafeature_album/appendix_2_4.jpg/image_full" alt="appendix_2_4.jpg" class="image-inline" /></a>
<p class="caption">Appendix 2.4. Velocity profiles of the Hydor Koralia 6</p>
</div>
<div class="photo-wrapper"><a class="popup" href="aafeature_album/appendix_2_5.jpg" rel="gallery" title="Appendix 2.5. Velocity profiles of the Hydor Koralia 7"><img src="aafeature_album/appendix_2_5.jpg/image_full" alt="appendix_2_5.jpg" class="image-inline" /></a>
<p class="caption">Appendix 2.5. Velocity profiles of the Hydor Koralia 7</p>
</div>
<div class="photo-wrapper"><a class="popup" href="aafeature_album/appendix_2_6.jpg" rel="gallery" title="Appendix 2.6. Velocity profiles of the Hydor Koralia 8"><img src="aafeature_album/appendix_2_6.jpg/image_full" alt="appendix_2_6.jpg" class="image-inline" /></a>
<p class="caption">Appendix 2.6. Velocity profiles of the Hydor Koralia 8</p>
</div>
<div class="photo-wrapper"><a class="popup" href="aafeature_album/appendix_2_7.jpg" rel="gallery" title="Appendix 2.7. Velocity profiles of the MaxiJet 1200"><img src="aafeature_album/appendix_2_7.jpg/image_full" alt="appendix_2_7.jpg" class="image-inline" /></a>
<p class="caption">Appendix 2.7. Velocity profiles of the MaxiJet 1200</p>
</div>
<div class="photo-wrapper"><a class="popup" href="aafeature_album/appendix_2_8.jpg" rel="gallery" title="Appendix 2.8. Velocity profiles of the Tunze 6105"><img src="aafeature_album/appendix_2_8.jpg/image_full" alt="appendix_2_8.jpg" class="image-inline" /></a>
<p class="caption">Appendix 2.8. Velocity profiles of the Tunze 6105</p>
</div>
<div class="photo-wrapper"><a class="popup" href="aafeature_album/appendix_2_9.jpg" rel="gallery" title="Appendix 2.9. Velocity profiles of the Tunze 6205"><img src="aafeature_album/appendix_2_9.jpg/image_full" alt="appendix_2_9.jpg" class="image-inline" /></a>
<p class="caption">Appendix 2.9. Velocity profiles of the Tunze 6205</p>
</div>
<div class="photo-wrapper"><a class="popup" href="aafeature_album/appendix_2_10.jpg" rel="gallery" title="Appendix 2.10. Velocity profiles of the Tunze 6305"><img src="aafeature_album/appendix_2_10.jpg/image_full" alt="appendix_2_10.jpg" class="image-inline" /></a>
<p class="caption">Appendix 2.10. Velocity profiles of the Tunze 6305</p>
</div>
<div class="photo-wrapper"><a class="popup" href="aafeature_album/appendix_2_11.jpg" rel="gallery" title="Appendix 2.11. Velocity profiles of the Ecotech Marine Vortech MP-10"><img src="aafeature_album/appendix_2_11.jpg/image_full" alt="appendix_2_11.jpg" class="image-inline" /></a>
<p class="caption">Appendix 2.11. Velocity profiles of the Ecotech Marine Vortech MP-10</p>
</div>
<div class="photo-wrapper"><a class="popup" href="aafeature_album/appendix_2_12.jpg" rel="gallery" title="Appendix 2.12. Velocity profiles of the Ecotech Marine Vortech MP-40"><img src="aafeature_album/appendix_2_12.jpg/image_full" alt="appendix_2_12.jpg" class="image-inline" /></a>
<p class="caption">Appendix 2.12. Velocity profiles of the Ecotech Marine Vortech MP-40</p>
</div>
<div class="photo-wrapper"><a class="popup" href="aafeature_album/appendix_2_13.jpg" rel="gallery" title="Appendix 2.13. Velocity profiles of the Ecotech Marine Vortech MP-60"><img src="aafeature_album/appendix_2_13.jpg/image_full" alt="appendix_2_13.jpg" class="image-inline" /></a>
<p class="caption">Appendix 2.13. Velocity profiles of the Ecotech Marine Vortech MP-60</p>
</div>
</div> <br /><br /> <script type="text/javascript"><!-- google_ad_client = "ca-pub-5170032844807535"; /* Square250x250 */ google_ad_slot = "6862474606"; google_ad_width = 250; google_ad_height = 250; //--></script><script type="text/javascript" src="http://pagead2.googlesyndication.com/pagead/show_ads.js"></script>]]></content:encoded>
    <dc:publisher>No publisher</dc:publisher>
    
    <dc:creator>Michael Sandford, William Straka, Sanjay Joshi</dc:creator>
    <dc:rights>Pomacanthus Publications, Inc.</dc:rights>
    
      <dc:subject>VorTech</dc:subject>
    
    
      <dc:subject>William Straka</dc:subject>
    
    
      <dc:subject>Sanjay Joshi Ph.D.</dc:subject>
    
    
      <dc:subject>Water Testing</dc:subject>
    
    
      <dc:subject>Water Circulation</dc:subject>
    
    
      <dc:subject>Product Review</dc:subject>
    
    
      <dc:subject>Michael Sandford</dc:subject>
    
    
      <dc:subject>Feature Article</dc:subject>
    
    <dc:date>2011-07-13T12:00:00Z</dc:date>
    <dc:type>Page</dc:type>
  </item>


  <item rdf:about="http://www.advancedaquarist.com/2011/6/review">
    <title>Product Review: Two Little Fishies' Media Reactor 150 and PhosBan Phosphate and Silica Adsorption Media</title>
    <link>http://www.advancedaquarist.com/2011/6/review</link>
    <description>TLF's 150 Reactor and PhosBan media performed as advertised. Under the conditions of this testing, both phosphate and silica concentrations fell to levels below the detection limits of 'laboratory grade' instruments. The successful application of these products in aquaria around the world is a testament to their functions. If you're battling algae outbreaks and need a quick solution, give these products a try.</description>
    <content:encoded xmlns:content="http://purl.org/rss/1.0/modules/content/"><![CDATA[<p><em><strong>Click through to see the images.</strong></em></p> <br /><div id="body">
<p class="remove"><img src="review_album/Fphosban2.jpg" alt="Fphosban2.jpg" class="image-inline" /></p>
<div class="photo-wrapper image-right"><a class="popup" href="review_album/reactor.gif" rel="gallery"><img src="review_album/reactor.gif/image_preview" alt="reactor.gif" class="image-inline" /></a></div>
<p><span class="dropcap">N</span>uisance algae are perhaps the number one challenge facing aquarists and various strategies exist to prevent their growths. Pretreatment of makeup water (including reverse osmosis filtration, deionization), additions of high pH solutions of water and calcium hydroxide (kalkwasser), protein skimming, algal scrubbing with macro-algae, use of fish foods with low phosphorus content, etc. all can help control nutrients responsible for algal outbreaks. These methods have one thing in common - they target the element phosphorus.</p>
<p>Phosphorus is an element essential for all life forms including plants and algae. Indeed, bags of lawn fertilizer are marked with numbers (such as 10-5-5) indicating the amount of nitrogen, phosphorus, and potassium ('macro-nutrients'), respectively. If we were to remove or limit one of these macro-nutrients, we would be able to control the growth of plants and algae. This concept is known as Liebig's Law of the Minimum, which states plant growth is not encouraged by the <i>total</i> amount of nutrients available but instead by the one <i>least</i> available. Hence, phosphorus is often the element targeted for removal. Biological removal is possible, but requires a certain sequence of biochemical events. More often, phosphorus is removed by chemical means and is often done on industrial levels in wastewater treatment plants. It can be done in aquaria as well.</p>
<p>Recommended phosphate levels for reef aquaria vary somewhat although most are generally low (~0.03 ppm, or mg/l - 3 parts in 100,000,000 parts - quite low indeed).</p>
<p>Silica (SiO<sub>2</sub>) is of concern to hobbyists because it is used by diatoms to create their skeletons. Outbreaks of diatoms are characterized by brown coatings or filaments. While diatoms in themselves are not harmful (useless they smother sessile invertebrates) they can be unsightly. Some artificial saltwater manufacturers will not include silica in their mix. However, drinking water can often contain significant amounts of silica (~14mg/l). Since diatoms are photosynthetic, limiting phosphorus along with silica can control their population within aquaria. Silica can also 'plate out' on hot surfaces (such as heaters or pumps allowed to run dry) and can be difficult to remove.</p>
<h2>Definitions</h2>
<dl> <dt>ppm</dt> <dd>Parts per million, essentially the same thing as milligrams per liter (mg/l)</dd> <dt>Phosphorus</dt> <dd>A non-metal element considered essential for all life forms. It has an atomic weight of 30.9738 g/mol; its symbol is P.</dd> <dt>Phosphate</dt> <dd>Phosphorus bound with oxygen, and almost always the form of phosphorus found in aquatic environments.</dd> <dt>Ortho-phosphate or reactive phosphate</dt> <dd>This form is readily 'bio-available' for plant and algal growths and is the type measured by hobbyist test kits. It may be suspended or dissolved in the water column. Often reported as PO<sub>4</sub><sup>-3</sup>, the recommended amount in a successful reef aquarium's water should be low (less than 0.05 ppm, or mg/l, if you prefer). When we consider that the phosphorus (P) portion of phosphate (PO<sub>4</sub><sup>-3</sup>) is only about 1/3 of its weight, we can easily see that the 'reactive' part is only about 0.017 ppm. However, hobbyist test kits report ortho-phosphate as PO<sub>4</sub><sup>-3</sup>; hence the recommended value is 0.05 ppm or less. To convert PO<sub>4</sub><sup>-3</sup> to P, divide by 3.066. To convert P to PO<sub>4</sub><sup>-3</sup>, multiply by 3.066.</dd> <dt>Total Phosphate</dt> <dd>the sum of ortho-phosphate (easily measured) and that phosphate converted to ortho-phosphate by a severe digestion process employing potassium persulfate and sulfuric acid. Total phosphate can be suspended, dissolved, or incorporated in animal and plant tissues and is usually less bio-available for encouraging algal growths.</dd> </dl>
<p> </p>
<h2>Two Little Fishies</h2>
<p>Two Little Fishies, Inc. (or TLF, Miami Gardens, Florida USA) has been providing products to the pet industry since 1991. They offer a variety of products ranging from fish and invertebrate foods to aquarium supplements. Two of their offerings were selected for this month's Product Review - the PhosBan Reactor (model 150) and PhosBan phosphate/silica adsorbent.</p>
<div class="photo-wrapper"><a class="popup" href="review_album/phosban.jpg" rel="gallery" title="PhosBan phosphate adsorption media."><img src="review_album/phosban.jpg/image_preview" alt="phosban.jpg" class="image-inline" /></a>
<p class="caption">PhosBan phosphate adsorption media.</p>
</div>
<p>The PhosBan reactor is a 'fluidized bed' (meaning the water to be treated flows upwards through the media and gently suspends at least some of the media particles). Treated water exits the reactor and returns to the aquarium. If all goes according to plan, the reactor's effluent will be depleted of phosphate and silica. How well do these products perform and are they worthy of your consideration? These are the recommendations made by TLF:</p>
<ul>
<li>For use on freshwater or marine aquaria, up to 150 gallon (568 liter) capacity.</li>
<li>Flow rate through reactor should be 20 - 30 gallons (76 - 114 liters) per hour - this will require a pump capacity of 100 - 200 gallons (379 - 757 liters) per hour. A Maxi-Jet 500 (a misprint in the directions - a Maxi-Jet 400 or similar pump will work just fine) is recommended, but throttling will be required using the supplied ball valve. Excessive flow rates may cause the media to crumble - the directions use the synonym 'friable').</li>
<li>Reactor capacity depends upon the media. The 150 reactor can hold up to a maximum 200 grams of PhosBan media (5 inches or 12.7cm height within the column, with a recommended minimum of 2 inches or 5cm). The column can be filled to capacity when using granular activated carbon.</li>
<li>If an amount of PhosBan required is below the minimum depth within the reactor, TLF recommends mixing PhosBan with activated carbon.</li>
</ul>
<h2>Phosphorus Removal by Granular Ferric Oxide (GFO)</h2>
<p>Iron particles possess a natural positive charge (these ions can have a valence of 2 or 3) while phosphorus possesses a negative charge. Since opposites attract, the phosphorus can be bound to iron (in this case, the ferric state, or Fe <sup>+3</sup>) thus removing it from solution and preventing it from fueling algal growths.</p>
<p>It is uncommon (and difficult) for hobbyists to distinguish between 'bio-available' phosphate (called 'reactive' or 'ortho-phosphate') and total phosphate (organically-bound) since the latter requires specific laboratory testing procedures and equipment. I wondered what impact PhosBan would have on organic phosphate concentrations and decided to test for it (see the 'Methods and Materials' section below for details). Figure 1 shows the results of testing for Total and Reactive ('ortho-') Phosphate over a period of 12 hours. Figure 2 demonstrates that, when ortho-phosphate content is subtracted from the amount of total phosphate, the level remains relatively stable, indicating removal of reactive ortho-phosphate only.</p>
<div class="photo-wrapper"><a class="popup" href="review_album/image003.png" rel="gallery" title="Figure 1. Time-course Reactive (ortho-) and Total Phosphorus removal by PhosBan. See Discussion section (below) for comments."><img src="review_album/image003.png/image_preview" alt="image003.png" class="image-inline" /></a>
<p class="caption">Figure 1. Time-course Reactive (ortho-) and Total Phosphorus removal by PhosBan. See Discussion section (below) for comments.</p>
</div>
<div class="photo-wrapper"><a class="popup" href="review_album/image005.png" rel="gallery" title="Figure 2. Total Phosphorus remained about the same during the experiment which is not surprising, as much of this element is probably found in suspended particles (algal cells, bacteria, food scraps) and not readily available to promote algae growths."><img src="review_album/image005.png/image_preview" alt="image005.png" class="image-inline" /></a>
<p class="caption">Figure 2. Total Phosphorus remained about the same during the experiment which is not surprising, as much of this element is probably found in suspended particles (algal cells, bacteria, food scraps) and not readily available to promote algae growths.</p>
</div>
<h2>Silica Removal</h2>
<p>TLF also claims that silica is removed by PhosBan as well. Figure 3 shows the results of testing 3 samples gathered over a 21-hour period after initiating treatment with PhosBan.</p>
<div class="photo-wrapper"><a class="popup" href="review_album/image007.png" rel="gallery" title="Figure 3. PhosBan quickly removes silica."><img src="review_album/image007.png/image_preview" alt="image007.png" class="image-inline" /></a>
<p class="caption">Figure 3. PhosBan quickly removes silica.</p>
</div>
<h2>Effects on pH</h2>
<p>A Hach HQ40d data logger equipped with a calibrated pH probe recorded pH values every five minutes over the course of 36 hours. pH fell slightly, but some of this drop is attributable to rising temperature (temp data not shown, and due to powerheads' operation within the aquarium). See Figure 4 and the Discussion section below for further comments.</p>
<p>The effects of PhosBan on alkalinity would be a better metric of its impact. See below.</p>
<div class="photo-wrapper"><a class="popup" href="review_album/image009.png" rel="gallery" title="Figure 4. pH of treated water fell over the course of 36 hours, but see comments in the Discussion section below."><img src="review_album/image009.png/image_preview" alt="image009.png" class="image-inline" /></a>
<p class="caption">Figure 4. pH of treated water fell over the course of 36 hours, but see comments in the Discussion section below.</p>
</div>
<h2>Effects on Alkalinity</h2>
<p>Directions for use of the PhosBan Reactor state that alkalinity will drop when 5x the recommended amount of PhosBan is used. Under the conditions of this experiment, alkalinity dropped by about 19% when PhosBan was applied at about twice the recommended amount. See Figure 5. At face value, this may seem negative until we consider that the presence of <i>both phosphorus and silica lend to alkalinity</i> (<i>Standard Methods</i>, 1998). Therefore, a portion of alkalinity drop could be attributable to their removal, and results generated by alkalinity testing in this situation could be partially attributed to removal of 'false' alkalinity and not a drop in carbonate content.</p>
<div class="photo-wrapper"><a class="popup" href="review_album/image011.png" rel="gallery" title="Figure 5. Alkalinity was negatively impacted when PhosBan was used at about twice the recommended amount (100 grams for 182 liters - 48 gallons) - but this is not necessarily a bad thing! Note that alkalinity was marginal to begin with. See text for details."><img src="review_album/image011.png/image_preview" alt="image011.png" class="image-inline" /></a>
<p class="caption">Figure 5. Alkalinity was negatively impacted when PhosBan was used at about twice the recommended amount (100 grams for 182 liters - 48 gallons) - but this is not necessarily a bad thing! Note that alkalinity was marginal to begin with. See text for details.</p>
</div>
<h2>Water Color</h2>
<p>Color of water can be estimated using a comparator or a colorimeter/spectrometer. Color is due to dissolved organic substances (called gelbstoff, German for 'yellow matter') in the water column. Generally, color due to these substances is yellowish and is reported in Platinum/Cobalt units. A few milligrams of dry PhosBan was placed in a beaker containing 100ml deionized water and allowed to sit overnight. A sample was analyzed for color (at 455nm). PhosBan did not impart color to the water.</p>
<p>On the other hand, GFO has the potential to remove organic substances causing yellow water. This was not tested.</p>
<h2>Discussion and General Impressions</h2>
<p>The PhosBan Reactor 150 is constructed entirely of plastic and acrylic materials and is safe for use in freshwater and saltwater applications. The clear acrylic material of the reactor itself appears to be about 1/16" (~1.6mm) thick and is rugged enough to withstand some abuse. The 90°elbows fitting the barbed fittings atop the reactor are made of a soft rubber-like material and are friction fits. Use cable ties to affix these 90's to the reactor if desired - avoid stainless steel worm clamps that might compress and break the barbs.</p>
<p>This reactor holds about 36 fluid ounces (1,075ml) and has a useable capacity of about 26.5 fluid ounces (~785 milliliters). Assuming PhosBan has a consistent density, the 150 reactor will hold approximately 7.3 ounces (207 grams) of this material. Using the manufacturer's recommendations for loading, the reactor will hold enough PhosBan to treat a maximum marine aquarium size of 200 gallons (757 liters; using 50 grams for 50 liters). It should be sufficient to treat a 400-gallon (~1,500 liter) freshwater aquarium. Note that these ratings are higher than TLF's recommendation of a maximum aquarium size of 150 gallons.</p>
<p>Under the conditions of these tests, TLF's 150 Reactor containing PhosBan quickly removed both phosphates and silica to levels below the detection limits of the spectrometers (for our purposes, the concentration of both silica and ortho-phosphate fell to 'zero').</p>
<p>GFO can potentially remove other chemicals including cobalt, manganese, zinc and nickel (Holmes-Farley, 2008). All (save the latter) are important micronutrients for algal growth. The effectiveness and rapidity of GFO in sequestering these is unknown to me.</p>
<p>Likes:</p>
<ul>
<li>Reactor is well made yet relatively inexpensive</li>
<li>Media is relatively inexpensive and lives up to manufacturer's claims</li>
<li>Ortho-phosphate and silica are effectively and quickly removed to levels approaching zero</li>
<li>Recommended pump (Maxi-Jet, not included) is readily available, reliable, inexpensive to purchase and operate</li>
<li>Device (ball valve) to regulate water flow through the reactor is included</li>
<li>Directions are appropriate and easy to follow</li>
<li>The reactor can be used with other media, such as activated carbon</li>
</ul>
<p>Dislikes:</p>
<ul>
<li>Effectiveness of any GFO product in removing some 'trace elements' (Mn, Zn, Co, for example) from artificial seawater is unknown</li>
<li>Instructions not available on TLF's website (I routinely misplace directions and did so for a while during the course of writing this article)</li>
</ul>
<h2>Conclusion</h2>
<p>TLF's 150 Reactor and PhosBan media performed as advertised. Under the conditions of this testing, both phosphate and silica concentrations fell to levels below the detection limits of 'laboratory grade' instruments.</p>
<p>There is some concern about depleting reactive phosphate levels too quickly and/or for extended periods of time (remember Liebig's Law of the Minimum discussed earlier). Proceed slowly with the application of <i>any</i> product in a reef aquarium and closely watch corals for negative reactions.</p>
<p>While reactive phosphate is effectively removed, the same cannot be said about the form of phosphorus (acid hydrolysable) that requires vigorous laboratory digestion processes before analysis. Information suggests that almost all of the acid-hydrolysable phosphorus is suspended - not dissolved - in the water column and this form should not be of much concern to hobbyists.</p>
<p>The media reactor is well made and should provide years of service. The adsorption material is relatively dust-free (although it should be flushed with water per the manufacturer's recommendations) and has not crumbled and added any apparent particulates or color to the aquarium water. In addition, there were apparently no significant negative impacts on water chemistry even when used at twice the recommended amount (however I would strongly advise hobbyists to follow the manufacturer's directives).</p>
<p>The successful application of these products in aquaria around the world is a testament to their functions. If you're battling algae outbreaks and need a quick solution, give these products a try.</p>
<h2>Materials and Methods</h2>
<p>A 55-gallon (208 liters) was filled with 48 gallons (182 liters) of well-aged artificial seawater from a fish-only aquarium. A PhosBan Reactor 150 was installed according to manufacturer's recommendations. Since the suggested amount of PhosBan for 48 gallons of seawater did fill the reactor to the minimum recommended level, the dosage was doubled to 100 grams of PhosBan phosphorus adsorbent to fill the reactor to the recommended depth of 2 inches (~50mm). A Maxi-Jet 400 provided flow, which was regulated to 19.6 gallons per hour (~1,240 milliliters per minute) using the supplied in-line ball.</p>
<p>Baseline water samples from the aquarium were gathered in PO<sub>4</sub><sup>-3</sup>-free bottles, and again at 0.5, 1, 2, 3, 11.5, 21, and 36 hours after starting the reactor's pump. These were analyzed for Total Phosphorus and Reactive Phosphorus using a Hach 2800 Spectrometer, DRB 200 Dry Thermostat Reactor, and reagents from Hach (potassium persulfate and sulfuric acid for digestion, and ascorbic acid method for analyses). Hach advertises the range of the ortho-phosphate analysis to be 0.02-2.50 ppm and total phosphate as 0.06-3.50 ppm (both expressed as PO<sub>4</sub><sup>-3</sup>). Alkalinity (as calcium carbonate; CaCO<sub>3;</sub>) was determined using a Hach Digital Titrator and alkalinity reagents, using a calibrated pH meter and probe to determine titration endpoints (which varied from 4.5 to 4.8, depending upon phosphate concentrations and the presence or absence of silica) . A Hach HQ40d data logger equipped with a pH probe measured and recorded pH and water temperature every 5 minutes. Silica was determined by a LaMotte Smart2 colorimeter using LaMotte silica reagents (high range - 0-75 ppm, using ammonium molybdate in an acidic state, with oxalic acid added to prevent a reaction with phosphate and molybdate).</p>
<h2></h2>
<h2>References</h2>
<ol>
<li>American Public Health Association, 1998<i>. Standard Methods for the Examination of Water and Wastewater.</i> Washington, DC.</li>
<li>Holmes-Farley, R., 2008. Reef Alchemy: Iron oxide hydroxide (GFO) phosphate binders. Reef Keeping Magazine Online.</li>
</ol></div> <br /><br /> <script type="text/javascript"><!-- google_ad_client = "ca-pub-5170032844807535"; /* Square250x250 */ google_ad_slot = "6862474606"; google_ad_width = 250; google_ad_height = 250; //--></script><script type="text/javascript" src="http://pagead2.googlesyndication.com/pagead/show_ads.js"></script>]]></content:encoded>
    <dc:publisher>No publisher</dc:publisher>
    
    <dc:creator>Dana Riddle</dc:creator>
    <dc:rights>Pomacanthus Publications, Inc.</dc:rights>
    
      <dc:subject>Product Review</dc:subject>
    
    
      <dc:subject>Dana Riddle</dc:subject>
    
    
      <dc:subject>Phosphate</dc:subject>
    
    
      <dc:subject>GFO</dc:subject>
    
    
      <dc:subject>Phosphates</dc:subject>
    
    
      <dc:subject>Granular Ferric Oxide</dc:subject>
    
    <dc:date>2011-06-15T12:00:00Z</dc:date>
    <dc:type>Page</dc:type>
  </item>


  <item rdf:about="http://www.advancedaquarist.com/2011/4/chemistry">
    <title>Aquarium Chemistry: The Nitrogen Cycle: New Developments and New Prospects</title>
    <link>http://www.advancedaquarist.com/2011/4/chemistry</link>
    <description>So far we have always thought of the nitrogen cycle as a series of linear reactions that conclude in a circle. But is it really a cycle? Important discoveries made in these recent years have drastically revolutionized this concept. In this article, I will try to discuss some of these research studies, with the intention and hope of being able to make this complex topic, understandable.</description>
    <content:encoded xmlns:content="http://purl.org/rss/1.0/modules/content/"><![CDATA[<p><em><strong>Click through to see the images.</strong></em></p> <br /><div id="body">
<p class="remove"><img src="Fnitrogen2.jpg" alt="Fnitrogen2.jpg" class="image-inline" /></p>
<p><span class="dropcap">T</span>he nitrogen cycle plays a highly important role in a closed environment like that of an aquarium. Due to its presence, it is possible keep the fish and invertebrates alive, in a small viable space, therefore it is fundamental to learn to know it, mainly in respect of the life forms that we nurture.</p>
<p>Until a few years ago, it was thought that the nitrogen cycle in its complexity, was a complete linear process. However, most recent scientific discoveries have greatly revolutionized our well-established knowledge on the nitrogen cycle and on the micro-organisms involved in such processes. As a matter of fact, the global cycle of nitrogen in the environment, particularly in that of marine, has been integrated with at least three new links which include:</p>
<ol>
<li>the oxidation of ammonium by a particular group of micro-organisms, the archaeabacteria (<strong>AOA</strong>);</li>
<li>the anaerobic reduction of nitrates into ammonium ion (<strong>DNRA</strong>);</li>
<li>the anaerobic oxidation processes of ammonium (<strong>ANAMMOX</strong>).</li>
</ol>
<p>In the first part of this article, I will try to review the essential and more predominant aspects of the nitrogen cycle: the transformation processes of the main components (atmospheric nitrogen, ammonium ion, nitrite, nitrate) and the role played by the bacterial species involved.</p>
<p>In the second part, new ways will be explored with particular reference on the role of bacteria, focusing on the implications that these new discoveries have brought in the global cycle of nitrogen.</p>
<h2>The Canonical Nitrogen Cycle</h2>
<p>Nitrogen (N) is an essential nutrient for all organisms, and it is a critical element of protein, vitamins and DNA, and is important in biochemical structures and process that define life.</p>
<p>Nitrogen exists in different states of oxidation and in many chemical forms and is quickly converted by the microorganisms both on earth and the sea.</p>
<p>In the marine environment, nitrogen is present in 5 forms:</p>
<ol>
<li>Gaseous nitrogen (N<sub>2</sub>), stable molecules that require specialized enzyme systems (present in some types of bacteria) for fixation and later use;</li>
<li>Ammonium ion (NH<sub>4</sub><sup>+</sup>), the most reduced natural specie of nitrogen, and the most biologically available in an oxygen-less environment;</li>
<li>Nitrate ion (NO<sub>3</sub><sup>-</sup>), the most oxidized form of nitrogen and mostly usable in an aerobic environment;</li>
<li>Particulate organic nitrogen (PON), organic form of nitrogen predominant in sediments;</li>
<li>Dissolved organic nitrogen (DON), a rich mixture of molecules with a wide range of composition.</li>
</ol>
<p>A complex network of reactions links these nitrogen forms in processes that as a whole, is called the nitrogen cycle (Figure 1). The greatest source of nitrogen comes in the form of inert gas N<sub>2</sub> (N ≡ N), representing 78% of the atmosphere. A small part of the atmospheric N<sub>2</sub> is fixed by particular bacteria called nitrogen-fixing (<strong>nitrogen</strong> <strong>fixation</strong>) and is reduced to ammonium ion (NH<sub>4</sub><sup>+</sup>) which can be easily usable for other organisms. In a marine environment which inhabited by particular bacteria, ammonium is quickly oxidized to nitrate in aerobic conditions (<strong>nitrification</strong>). Nitrate is then reduced again to an N<sub>2</sub> gas in anaerobic conditions (<strong>denitrification</strong>), thereby completing the cycle (Figure 1).</p>
<div class="photo-wrapper"><a class="popup" href="chemistry_album/Fig_1.jpg" rel="gallery" title="Figure 1. Diagram of the marine nitrogen cycle."><img src="chemistry_album/Fig_1.jpg/image_preview" alt="Fig_1.jpg" class="image-inline" /></a>
<p class="caption">Figure 1. Diagram of the marine nitrogen cycle.</p>
</div>
<h2>Nitrogen Fixation and Ammonification</h2>
<h3>Nitrogen fixation</h3>
<p>The biological fixation of nitrogen can be synthetically represented by the following global formula:</p>
<p>N<sub>2</sub> + 8H<sup>+</sup> + 6e<sup>-</sup> <span>→</span> 2NH<sub>4</sub><sup>+</sup></p>
<p>Which means that for each molecule of atmospheric nitrogen, 2 ammonium ions are formed with the absorption of 6 electrons and 6H+, this last process tends to increase the pH.</p>
<p>It is interesting to note that, ultimately, the ammonium ion in the water is in balance with ammonia (NH3) based on the following stoichiometry:</p>
<p>NH<sub>3</sub> + H<sub>2</sub>O ↔ NH<sub>4</sub><sup>+</sup> + OH<sup>-</sup></p>
<p>The concentration of the two chemical species relies largely on the pH, in short, the higher the alkalinity, the larger will be the quantity of ammonia; or proportion-wise, the lower the pH is (more acid), the larger will be the quantity of ammonium ion (less toxic than ammonia). As can be seen in Figure 2, in an average range of pH in the seawater, the percentage of NH4+ is higher (82-97%) compared to that of NH3 (3-18%).</p>
<p>As we have previously stated, the atmospheric nitrogen N<sub>2</sub>, before being incorporated into the biological molecules, has to be reduced to NH<sub>4</sub><sup>+</sup>, through a series of reactions called biological fixation of nitrogen. Such reactions are catalyzed by a particular enzyme, <span class="c1">nitrogenase</span>, which is present in some nitrogen-fixing bacteria belonging mainly to <i>Cyanobacteria</i> phylum. One of the peculiar characteristics of this enzyme is that it comes irreversibly inhibited by the molecular oxygen (O<sub>2</sub>); and since fixation is a process that happens in an aerobic environment, it creates an apparent paradox. In reality, cyanobacteria are able to negotiate the activities of nitrogenase, an enzyme which is essentially anaerobic, with the inevitable presence of oxygen (resulting from photosynthetic processes), through not yet well-known mechanisms. In the marine environment, the nitrogen-fixing bacteria (some of which also belong to <i>Clostridium</i> and <i>Azobacter</i> genera) can be found both in free form and in symbiosis with other organisms (ex. Sponge).</p>
<p>But what is the source of nitrogen in an aquarium? Certainly, the biological fixation of nitrogen is an extremely important process in the ocean, but it has a limited role in the tank.</p>
<div class="photo-wrapper"><a class="popup" href="chemistry_album/Fig_2.jpg" rel="gallery" title="Figure 2. pH-dependent concentration of NH4+ and NH3 in the seawater"><img src="chemistry_album/Fig_2.jpg/image_preview" alt="Fig_2.jpg" class="image-inline" /></a>
<p class="caption">Figure 2. pH-dependent concentration of NH<sub>4</sub><sup>+</sup> and NH<sub>3</sub> in the seawater</p>
</div>
<p>The main source of nitrogen is obtained from the nourishment both of the fish and invertebrates, particularly in the form of protein and single amino acids, assuming they are directly administered into the tank. Even minor vitamins and other molecules like the DNA, contain nitrogen but the quantity is decisively less than that of protein's. In proteins, nitrogen forms a part of the framework and of some single amino-acids' lateral chains, as the tryptophan, asparagin, glutamine, lysin, arginine, histidine.</p>
<p>The oxidative degradation of amino acids leads to the release of ammonia nitrogen into the tank. In what way? On one hand, the protein ingested by the fish or by the other organisms are broken down into single amino acids. In turn, amino acids can be used to build new proteins within the organism or be oxidized to supply energy. The degradation of amino acids by the animals leads to the elimination of varied by-products. For example, the fish release nitrogen as ammonia, while the majority of organisms may release it in the form of uric acid (fowls, reptiles), or urea (humans). On the other hand, in the presence of a strong organic charge, protein and amino acids in waste products, in sediments and in organic decay are decomposed in a process called <strong>ammonification</strong>, carried out by particular decomposer bacteria which release ammonium into the water by degrading the aminoacidic nitrogen.</p>
<h2>Nitrification</h2>
<p>Nitrification occurs in two distinct stages:</p>
<ol>
<li>oxidation of ammonium to nitrite (nitrosation) and</li>
<li>oxidation of nitrite to nitrate (nitration).</li>
</ol>
<p>1) Nitrosation: in the first stage, ammonium ion is oxidized to nitrite in two steps:</p>
<ol>
<li>The first step is catalyzed by the enzyme, <span class="underlined">monooxygenase</span> which forms the hydroxylamine by using O<sub>2</sub> as oxidant: <br /> 2NH<sub>4</sub><sup>+</sup> + O<sub>2</sub> → 2NH<sub>2</sub>OH + 2H<sup>+</sup></li>
<li>In the second step, hydroxylamine is oxidized to nitrite by the enzyme <span class="underlined">hydroxylamine-dehydrogenase</span>: <br /> 2NH<sub>2</sub>OH + 2O<sub>2</sub> → 2H<sup>+</sup> + 2H<sub>2</sub>O + 2NO<sub>2</sub><sup>-</sup></li>
</ol>
<p>2)   Nitration:  the oxidation of nitrite to nitrate, which occurs through the activity of the <span class="underlined">nitrite oxidase enzyme</span>, completes the process of nitrification:</p>
<p>2NO<sub>2</sub><sup>-</sup> + O<sub>2</sub> → 2NO<sub>3</sub><sup>-</sup></p>
<p>The conventional view of nitrification occurs in the presence of oxygen and anticipates the oxidation of ammonium to nitrate based on the following global synthetic formula (see Figure 1):</p>
<p>2NH<sub>4</sub><sup>+</sup> + 4O<sub>2</sub> → 4H<sup>+</sup> + 2H<sub>2</sub>O + 2NO<sub>3</sub><sup>-</sup></p>
<p>But who directs the music? The metabolic work of nitrification is entrusted to two groups of nitrifying bacteria:</p>
<ol>
<li>bacteria which oxidize ammonium (ammonia-oxidizing bacteria or AOB), also called nitrous bacteria. They belong chiefly to the <i>Nitrosococcus</i> and <i>Nitrosomonas</i> species;</li>
<li>bacteria which oxidize nitrite (Nitrite-oxidizing bacteria or NOB) also called nitric bacteria. They form a part of the <i>Nitrobacter</i>, <i>Nitrococcus</i> and <i>Nitrospina</i> species.</li>
</ol>
<p>The nitrifying bacteria are generally <strong>obliged aerobes</strong> and obliged chemoautorophs because they directly use CO<sub>2</sub> as a source of carbon, while organic substances can be toxic.</p>
<h2>Denitrification</h2>
<p>Here I describe the four stages of denitrification process in detail. The oxidation state of nitrogen is indicated by the enclosing parentheses, after the names of chemical species.</p>
<ol>
<li>Reduction of nitrate (+5) to nitrite (+3). This reaction is catalyzed by <span class="underlined">nitrate reductase</span> (NAR) which exists in the (internal) cytoplasmic part of bacterial membrane. Nitrate is carried within the bacterial cell by a specialized carrier (AP in Figure 3), defined as antiport because it exchange ion nitrate upon entry with the nitrite which is produced in the reaction and must be carried to the (external) periplasmatic space for the subsequent reaction. <br /> 2NO<sub>3</sub><sup>-</sup> + 4H<sup>+</sup> + 4e<sup>-</sup> → 2NO<sub>2</sub><sup>-</sup> + 2H<sub>2</sub>O</li>
<li>Reduction of nitrite (+3) to nitric oxide (+2). The nitrite which is now at the periplasmatic space is reduced by <span class="underlined">nitrite reductase</span> (NIR), releasing nitric oxide (NO). NO is a remarkably important molecule, from the bacteria to humans (but this is another story). <br /> 2NO<sub>2</sub><sup>-</sup> + 4H<sup>+</sup> + 2e<sup>-</sup> → 2NO + 2H<sub>2</sub>O</li>
<li>Reduction of nitric oxide (+2) to nitrous oxide (+1). NO is reduced by <span class="underlined">nitric oxide reductase</span> (NOR) to nitrous oxide (also called nitrogen protoxide otherwise known as the laughing gas). Both oxides represent a strong stimulus to the reductase synthesis in the presence of nitrates and under anaerobic conditions. <br /> 2NO + 2H<sup>+</sup> + 2e<sup>-</sup> → N<sub>2</sub>O + H<sub>2</sub>O</li>
<li>Reduction of nitrous oxide (+1) to gaseous nitrogen (0). The last reaction in the denitrification process is the reduction of nitrous oxide to molecular nitrogen in gaseous form by the <span class="underlined">nitrous oxide reductase</span>. This reaction should complete the denitrification process and conclude the nitrogen cycle. <br /> N<sub>2</sub>O + 2H<sup>+</sup> + 2e<sup>-</sup> → N<sub>2</sub> + H<sub>2</sub>O</li>
</ol>
<p>Denitrification is one of the key processes within the nitrogen cycle and anticipates the reduction of nitrates to gaseous nitrogen, passing through nitrite, nitric oxide (nitrogen monoxide) and nitrous oxide (nitrogen protoxide).</p>
<p>The global reaction of denitrification (without considering the organic molecular degradation eventually associated) can be synthesized with the following formula (for details see Figure 1):</p>
<p>2NO<sub>3</sub><sup>-</sup> + 12H<sup>+</sup> + 10e<sup>-</sup> → N<sub>2</sub> + 6H<sub>2</sub>O</p>
<p>Denitrification is mainly a heterotrophic option and occurs in <strong>anaerobic conditions</strong>. A wide range of bacteria called precisely denitrifying bacteria are able to carry out the entire sequence of reactions, being equipped with a complete enzyme apparatus.</p>
<p>The denitrifying bacteria are able to accomplish the anaerobic respiration of nitrates by using the nitrate in place of oxygen, as acceptor of the electrons released during the respiratory process. These bacteria possess special enzymes (Figure 3), as the <span class="c1">nitrate reductase</span> (NAR) and <span class="c1">nitrite reductase</span> (NIR), which allows the electrons to flow towards nitrate or nitrite, in the absence of oxygen. They are flexible enzymes which form in the cellular membrane only under anaerobic conditions: as a matter of fact, a part of NAR, the reductase synthesis is inhibited in the presence of oxygen.</p>
<p>Some bacterial species of the <i>Pseudomonas</i>, <i>Thiobacillus</i>, <i>Paracoccus</i> and <i>Naisseria</i> classes, are considered denitrifying.</p>
<div class="photo-wrapper"><a class="popup" href="chemistry_album/Fig_3.jpg" rel="gallery" title="Figure 3. Denitrification process on the bacterial membrane."><img src="chemistry_album/Fig_3.jpg/image_preview" alt="Fig_3.jpg" class="image-inline" /></a>
<p class="caption">Figure 3. Denitrification process on the bacterial membrane.</p>
</div>
<h2>New Developments and New Prospects</h2>
<p>The previous description represents a well-known scenario for a long time. In the course of the recent years however, our references concerning the nitrogen cycle have drastically changed to the extent that the principle of closed linear cycle itself is being questioned. This is because new reactions have been discovered and consequently new microorganisms that make the entire nitrogen cycle even more complex and twisted (Figure 4). In the second part of this article, I will try to clarify some important ways which will be inserted within the canonical nitrogen cycle:</p>
<ol>
<li>Ammonium oxidation by a particular group of microorganisms, the archaeabacteria (AOA)</li>
<li>The anaerobic reduction of nitrates to ammonium (DNRA):</li>
<li>The anaerobic oxidation processes of ammonium (ANAMMOX)</li>
</ol>
<h3>AOA: Ammonium Oxidizing Archaeabacteria</h3>
<p>Recently, new important components of nitrogen cycle, which form the part of the richer and diffused group of micro-organisms in the planet, the <strong>archaeabacteria</strong>, have been identified. In spite of the group's evolutive line being unclear, the archaeabacteria (Archaea or Archeobacteria) combined with the eukaryotes and with eubacteria, are some of the fundamental domains of the living beings.</p>
<p>The archaeabacteria, like the bacteria, consist of single cells without nucleus and in the past they were classified as prokaryotes together with the bacteria. Based on the DNA analysis, the archaeabacteria were re-grouped into three phyla: <i>Crenarchaeota</i>, <i>Euryarchaeota</i> and <i>Korarchaeota</i>. The Euryarchaeota bacteria are the most prominent and they include methane producers and holophiles. The Crenarchaeota bacteria include thermophilic microorganisms, while the Korarchaeota bacteria are less known because only their DNA is recognized but no microorganism has so far been isolated. Originally, it was thought that the archaeabacteria were just inhabitants of a harsh and most hostile environment on the face of the earth. The thermophiles can grow at a temperature higher than 100°C, the psychrophiles are those which grow at temperatures lower than -10°C, while the acidophilus and the alkaliphiles grow in extremely acidic or alkaline environments, respectively. Finally, the halophiles prefer the highly saline environment. Today, we know that archaeabacteria are present in all habitats: for example the Crenarchaeota bacteria are considered ubiquitous components of zooplankton.</p>
<p>In 2004, a particular gene called the ammonium mono-oxygenase (amoA) was discovered in marine Crenarchaeota, indicating the capacity to oxidize ammonium. The definite and convincing link between this new gene and the ammonium oxidation in archaeabacteria has been recently established in Crenarchaeota, the <i>Nitrosopumilus maritimus</i>, which was isolated from the water of aquarium. <i>N. maritim</i>us is chemoautrophic: as a matter of fact it grows with bicarbonate as the only source of carbon (organic carbon inhibits its growth) and converts NH<sub>4</sub><sup>+</sup> in NO<sub>2</sub><sup>-</sup> (<strong>green line</strong> in Figure 4 and Figure 7). Other archaeabacteria have been successively identified with this property and have been named as <strong>Ammonium oxidizing archaeabacteria (AOA)</strong>. An accurate analysis of the AmoA gene in many archaeabacteria has revealed diverse isoforms of this gene, each one is associated to a microorganism which is present in different habitats (with little overlapping, for example, between sediment and water column). Symbiont archaeabacteria have also been identified, like for example the <i>Cenarchaeum symbosiosum</i>, a symbiont Crenarchaeota with a sponge. Surprisingly, it was observed that this archaeabacteria is not able to produce hydroxylamine as intermediate reaction (see the Nitrosation process in the BOX 2) indicating that ammonium oxidization occurs with a mechanism which is different from that of the classic nitrification. Finally, the most recent studies conclude that the majority of Crenarchaeota are AOA's and AOA's are microorganisms whose presence is numerically predominant in the ocean.</p>
<div class="photo-wrapper"><a class="popup" href="chemistry_album/Fig_4.jpg" rel="gallery" title="Figure 4.Nitrogen cycle integrated with recently discovered reactions. Nitrogen oxidation states are pointed out."><img src="chemistry_album/Fig_4.jpg/image_preview" alt="Fig_4.jpg" class="image-inline" /></a>
<p class="caption">Figure 4.Nitrogen cycle integrated with recently discovered reactions. Nitrogen oxidation states are pointed out.</p>
</div>
<div class="photo-wrapper"><a class="popup" href="chemistry_album/Fig_5.jpg" rel="gallery" title="Figure 5. The life tree. Evolving lines of the main domains."><img src="chemistry_album/Fig_5.jpg/image_preview" alt="Fig_5.jpg" class="image-inline" /></a>
<p class="caption">Figure 5. The life tree. Evolving lines of the main domains.</p>
</div>
<h2>DNRA</h2>
<p>During the recent years, the anaerobic reduction of nitrates/nitrite or, <strong>DNRA</strong> (acronym for <strong>D</strong>issimilatory <strong>N</strong>itrate/nitrite <strong>R</strong>eduction to <strong>A</strong>mmonium) has stirred up a certain interest as a relevant reaction both in the terrestrial and marine eco-systems. The reaction has been described in anoxic sediments and in the presence of bacteria of the <i>Thioploca</i> and <i>Thiomargarita</i> species. Both types of bacteria are able to concentrate nitrates within their own cells for the subsequent oxidation of sulphur-containing compounds in reduced form. In this way, they are able to reduce nitrate to ammonium passing through nitrite as an intermediary compound (<strong>blue line</strong> in Figure 4 and Figure 7). This reaction, although still needing clarification, would potentially supply nitrite and ammonium to the ANAMMOX reaction (see subsequent paragraph) in anoxic sediments.</p>
<h2>ANAMMOX: anaerobic ammonium oxidation</h2>
<p>As we have previously seen in the description of AOA and nitrification stages, ammonium oxidation is a strictly aerobic process. In reality, we have also seen that ammonium can be generated in hypoxic and anoxic environment (for example in sediments) through the re-mineralization of organic nitrogen process (ammonification), and/or the anaerobic nitrite reduction (DNRA). For many years, it has been thought that ammonium is inert in anaerobic conditions, which is to say, useless for living things. The problem, however, is that no bacteria that are able to metabolize ammonium without oxygen have been identified, especially due to the technical difficulty of cultivating in the laboratory bacterial strains with these characteristics. In 2008, many of these difficulties have been overcome and some laboratories were able to identify, cultivate and characterize some types of ANAMMOX bacteria (Acronym for <strong>AN</strong>aerobic <strong>AMM</strong>onium <strong>OX</strong>idation) which are capable of oxidizing ammonium to gaseous nitrogen (N<sub>2</sub>) (<strong>red line</strong> in Figure 4 and Figure 7) by using nitrite as electron acceptor, instead of oxygen.</p>
<p>The first bacteria that are isolated in a marine environment belongs to the <i>Scalindua</i> species (<i>Sc. sorokinii</i>) although a probe regarding the presence of other species like <i>Brocadia</i> and <i>Kuenenia</i>, is being conducted. The common characteristic of these bacteria, unique in its class, is the presence of a specialized organelle called <strong>anammoxosoma</strong> which is surrounded by a particular lipid (fat) that contains <span class="c1">hydrazine oxide reductase</span>, an exclusive enzyme which is able to combine nitrite and ammonium is a single step (Figure 6). These bacteria use a rather complex mechanism that involves hydrazine as an intermediary. However, the following reaction, which is incomplete and stoichiometrically unprecise, can suggest the idea of an ANAMMOX process.</p>
<p>NH<sub>4</sub><sup>+</sup> + NO<sub>2</sub><sup>-</sup> → N<sub>2</sub> + 2H<sub>2</sub>O</p>
<p>This reaction has been described for the first time in sediment samples taken from particular marine ecosystems (the Black Sea, for example). It has been observed that in those experimental conditions, the ANAMMOX process was responsible for the loss of 30-50% of inorganic nitrogen from the sea (in the form of N<sub>2</sub>), significantly making it of the same level as the classic denitrification. But to analyze it closely, if we associate the above-mentioned DNRA process with ANAMMOX, we have a real and actual anaerobic denitrification, clearly not canonical. Indeed, DNRA supplies nitrite (as a reaction intermediary beginning from nitrate) and ammonium (the latter having been obtained also through organic nitrogen ammonification), and ANAMMOX transforms everything into gaseous nitrogen. A lovely and good denitrification, clearly with different mechanisms and bacterial strains, but nevertheless, a denitrification.</p>
<div class="photo-wrapper"><a class="popup" href="chemistry_album/Fig_6.jpg" rel="gallery" title="Figure 6. ANAMMOX Bacterium"><img src="chemistry_album/Fig_6.jpg/image_preview" alt="Fig_6.jpg" class="image-inline" /></a>
<p class="caption">Figure 6. ANAMMOX Bacterium</p>
</div>
<p>The question now is: under analogous conditions, can ANAMMOX occur in an aquarium? Obviously we are not able to establish that but we can make some considerations. A driven DSB can reproduce optimum conditions for this process. In fact, nitrogen bubbles are visible in the depths of the sediment. In line with this, it has been experimentally observed (but not in an aquarium) that the higher the layer of sediment, the more pushed the anoxic condition (oxygen inhibits the reaction) and the faster is the reaction. Therefore the high efficiency of a DSB in removing nitrates can be also due to a non-canonical denitrification, besides the classic anaerobic denitrification; obviously, the eventual presence of qualified bacterial strains has yet to be defined. Figure 7 illustrates the schematic diagram of integrated nitrogen cycle with the new reactions and the areas in which they occur.</p>
<div class="photo-wrapper"><a class="popup" href="chemistry_album/Fig_7.jpg" rel="gallery" title="Figure 7. Nitrogen cycle as revised and integrated. Areas where reactions occur are made evident."><img src="chemistry_album/Fig_7.jpg/image_preview" alt="Fig_7.jpg" class="image-inline" /></a>
<p class="caption">Figure 7. Nitrogen cycle as revised and integrated. Areas where reactions occur are made evident.</p>
</div>
<p>In conclusion, these constant discoveries clarify many obscure points of the nitrogen cycle but at the same time they open up new horizons and paradigms that make these processes even more complex and fascinating. On the other hand, I hope not to have further complicated the well-established ideas on nitrogen cycle, with this article. I also wish that over time, these new discoveries can be applied and integrated with the aquarium, in spite of the scarce scientific researches in this area. However, even if just theoretical, this knowledge allows us to better understand that which can occur in our tanks and nurture our passion for aquarium.</p>
<h2>References</h2>
<ol>
<li>Arrigo K. R. (2005) Marine microorganisms and global nutrient cycles. Nature 437: 349-355.</li>
<li>Berman-Frank I., Lundgren P., &amp; Falkowski P. (2003) Nitrogen fixation and photosynthetic oxygen evolution in cyanobacteria. Res.Microbiol. 154: 157-164.</li>
<li>Brandes J. A., Devol A. H., &amp; Deutsch C. (2007) New developments in the marine nitrogen cycle. Chem.Rev. 107: 577-589.</li>
<li>Francis C. A., Beman J. M., &amp; Kuypers M. M. (2007) New processes and players in the nitrogen cycle: the microbial ecology of anaerobic and archaeal ammonia oxidation. ISME.J. 1: 19-27.</li>
<li>Jetten M. S. (2008) The microbial nitrogen cycle. Environ.Microbiol. 10: 2903-2909.</li>
</ol>
<h2>Acknowledgements</h2>
<p>Marco Colasanti aka marcola62 (moderator of <a href="http://www.reefitalia.net/">Reefitalia</a> forum). A special thanks is owed to the staff of ReefItalia community for their support.</p>
<h2>About the Author</h2>
<p>MARCO COLASANTI, born in Rome, Italy, September 15, 1962, has a degree in biology and holds a Ph.D. in Neuroscience. He is currently a Full Professor in Cell Biology at the Department of Biology, Faculty of Sciences of the University of Rome, ITALY. Entrusted with holding courses of Cellular Biology and Laboratory of Cellular Biotechnology for the University Degree of Biology. He entered the aquarium hobby with freshwater tanks (1982) and set up his first saltwater tank in 1995. He is currently a Staff Member as a Moderator of ReefItalia, an Italian reef community. Over the last fifteen years, active in the scientific research on Nitric Oxide (NO) pathway in different models and systems, including fish and invertebrates. Co-author of more than 70 publications in international peer-reviewed ISI journals or books.</p>
</div> <br /><br /> <script type="text/javascript"><!-- google_ad_client = "ca-pub-5170032844807535"; /* Square250x250 */ google_ad_slot = "6862474606"; google_ad_width = 250; google_ad_height = 250; //--></script><script type="text/javascript" src="http://pagead2.googlesyndication.com/pagead/show_ads.js"></script>]]></content:encoded>
    <dc:publisher>No publisher</dc:publisher>
    
    <dc:creator>Marco Colasanti</dc:creator>
    <dc:rights>Pomacanthus Publications, Inc.</dc:rights>
    
      <dc:subject>Marco Colasanti</dc:subject>
    
    
      <dc:subject>Aquarium Chemistry</dc:subject>
    
    
      <dc:subject>Nitrates</dc:subject>
    
    <dc:date>2011-04-19T12:00:00Z</dc:date>
    <dc:type>Page</dc:type>
  </item>


  <item rdf:about="http://www.advancedaquarist.com/2011/3/aafeature">
    <title>Feature Article: Bacterial Counts in Reef Aquarium Water: Baseline Values and Modulation by Carbon Dosing, Protein Skimming, and Granular Activated Carbon Filtration</title>
    <link>http://www.advancedaquarist.com/2011/3/aafeature</link>
    <description>What are the bacteria populations in the water column of reef tanks, and how does that value compare with bacterial counts in authentic reef water? Does carbon dosing indeed increase water column bacteria populations (i.e., is growth carbon limited)? Does mechanical filtration (protein skimming and/or GAC filtration) actually remove bacteria from the water column, and if so, how much? Ken, Allison, Sanjay, and Gary's in-depth article puts these questions to the test.</description>
    <content:encoded xmlns:content="http://purl.org/rss/1.0/modules/content/"><![CDATA[<p><em><strong>Click through to see the images.</strong></em></p> <br /><div id="body">
<p><i>Departments of Chemistry (Ken S. Feldman, Allison A. Place) and Industrial and Manufacturing Engineering (Sanjay Joshi), The Pennsylvania State University, University Park, Pennsylvania 16802, and Route 66 Marine, Gardena, California (Gary White)</i></p>
<h2>1. Introduction</h2>
<p><span class="dropcap">B</span>acteria are ubiquitous in the marine environment and they play absolutely decisive roles in every conceivable ecological niche. Numerous studies have documented the impact of bacterial action on life processes and energy transduction in natural reefs, as detailed below. However, a corresponding influx of information about bacteria biology in our captive marine aquaria has been lacking. For example, the inextricable connection between Total Organic Carbon (TOC) in the natural marine environment and one it its major consumers, bacterioplankton, constitutes the most fundamental level of the marine food web (Johannes, 1967; Ducklow, 1979; Eppley, 1980; Ducklow, 1983; Gottfried, 1983; Moriarity, 1985). Thus, bacterial grazing on this carbon-rich food source is an absolutely obligatory first step in the incorporation of this central nutrient into the food chain. In addition to a carbon source, bacteria require nitrogen and phosphorus compounds in significant quantities along with trace amounts of many other elements, perhaps the most critical of which is iron. Deficiencies of any of these macro- or micronutrients can, in principle, serve as a limiter of growth (details below).</p>
<p>On the other hand, much less is known about bacterial nutrient needs in the captive environment of a reef aquarium, and in fact there have not been any studies that document bacterial growth responses to any specific nutrient in a reef tank. Nevertheless, one of the more recent aquarium nutrient export methodologies is based upon the hypothesis that bacteria growth in reef aquaria is carbon limited. This methodology has been dubbed "Carbon Dosing" (Walton, 2008; Michael, 2008), and it has three basic premises:</p>
<ol>
<li>Bacterial growth in reef aquaria is carbon source limited.</li>
<li>Adding a digestible carbon source therefore will spur bacteria population growth, and with that growth, other necessary nutrients, like nitrogen- and phosphorus-containing compounds, will be scavenged from the water column.</li>
<li>Mechanical filtration via protein skimming (and possibly Granular Activated Carbon (GAC)) will remove bacteria from the aquarium water column, and with them their C/N/P nutrient load.</li>
</ol>
<p>Thus, according to this approach, the export of undesired nutrients (nitrogen and phosphorus compounds) will be achieved upon carbon dosing. Much variation in carbon sources, including vodka (EtOH), sucrose (table sugar), vinegar (acetic acid), and solid biopellets (biodegradable polyesters), have been promoted. In addition, media that are alleged to facilitate bacterial biofilm formation, like Zeolites, have been incorporated into this emerging technology. Of course, bacteria export by skimming requires that the bacteria actually reside in the water column and not as a film on a solid support, and so mechanical mechanisms to dislodge the biofilms from these media have been engineered into the process, such as agitation of the (Zeolitic) media on a frequent basis. Finally, several commercial proponents of this methodology offer pre-packaged bacterial mixes and bacteria foods as starter kits. However, despite the proselytizing of its advocates, this approach to nutrient export rests entirely on the untested hypotheses that are listed above. Does it really work as advertised?</p>
<p>Our earlier research on the topic of carbon nutrient levels in marine aquaria (Feldman, 2008; Feldman, 2009; Feldman, 2010) has provided experimental documentation for four conclusions that impact on TOC management in our reef tanks:</p>
<ol>
<li>Reef aquaria utilizing active filtration (GAC, skimming) maintain equilibrium TOC levels within the range found on healthy tropical reefs.</li>
<li>Protein skimming (i.e., bubbles) is not very effective at removing TOC from aquarium water, depleting typical reef tank water of only ~ 20 - 35% of the post-feeding TOC present.</li>
<li>GAC filtration is quite effective at stripping reef tank water of its TOC load, removing 60 - 85% of the TOC present.</li>
<li>And, quite intriguingly, the natural biological filtration, which starts with bacteria and other microbes, is remarkable in its capacity to remediate reef tank water of TOC, easily removing 50% or more of the post-feeding TOC increase in tank water.</li>
</ol>
<p>Conclusions (2) and (3) describe the consequences of mechanical filtration on TOC levels, but the 4th conclusion emphasizes the importance of the "hidden" part of the remediation equation, bacterial predation, for gaining an understanding of the dynamics of carbon commerce in our aquaria. In fact, this observation, coupled with the advent of Carbon Dosing strategies for nutrient export, led to a new series of questions regarding the perhaps pivotal role of bacteria, or at least skimmable water column bacteria, in successful reef aquarium husbandry.</p>
<h3><b>1.1 The goal of our study - testing the validity of the Carbon Dosing hypothesis</b></h3>
<p><i>With this information as preamble, we set out to explore the following questions:</i></p>
<ol>
<li><i>What are the bacteria populations in the water column of reef tanks, and how does that value compare with bacterial counts in authentic reef water?</i></li>
<li><i>Does carbon dosing indeed increase water column bacteria populations (i.e., is growth carbon limited)?</i></li>
<li><i>Does mechanical filtration (protein skimming and/or GAC filtration) actually remove bacteria from the water column, and if so, how much?</i></li>
</ol>
<h3><b>1.2 Bacteria: A general introduction</b></h3>
<p>Bacteria are found everywhere on the Earth's surface where water is at least temporarily available. Their ubiquity, along with their sheer numbers and fast growth rates, means that they are extremely important geochemical agents. By facilitating aqueous oxidation-reduction processes, concentrating metal cations and anions, creating stored chemical energy, decomposing organic material, and mediating mineral precipitation and dissolution, they drive the Earth's biogeochemical cycles. Similarly, bacteria are essential agents for the biogeochemical processes that take place in marine aquaria. These biogeochemical processes include decomposition of organic matter, nitrification, denitrification, nutrient and element assimilation, sequestration and release ("cycling"), and chelation and the formation of complexes with a wide variety of ions and compounds.</p>
<p>As recently as the mid-1960's, the scientific community was not entirely convinced that "marine bacteria" existed as a distinct group. It turned out that marine bacteria have special requirements for inorganic ions to supply their needs for growth and metabolism, as well as for maintaining the integrity of their cells. They have a highly specific need for sodium, a need for higher concentrations of potassium, calcium and magnesium than are typically available in either freshwater or terrestrial environments, and exhibit a tolerance to halide ions that many other groups of bacteria lack. Many strains of marine bacteria have a preference for amino acids as sources of carbon, nitrogen, and energy, and require vitamins and other growth factors (MacLeod 1965). It is because of differences in cell wall composition, ionic requirements, and tolerances of inorganic ions that the majority of bacteria associated with freshwater aquaria cannot survive a direct transition to marine aquaria.</p>
<h4>Bacterial Physiology</h4>
<p>Bacteria are the most physiologically diverse group of organisms in a marine aquarium. They are unicellular (they do not differentiate into multicellular forms) prokaryotic (they have no nuclear membrane, and their DNA is not organized into chromosomes) and they reproduce by cell division. A typical bacterial cell is about 1 micrometer (uM) in diameter or width, compared with most eukaryotic cells that vary from 10 to 100 uM in diameter. Bacteria demonstrate three general shapes: rods ("bacilli"), spheres ("cocci"), and helical shapes ("spirilla" or "vibrio"). When individual cells grow end on end, they form what are known as filaments. They have five characteristic structural components: Unbound DNA ("nucleoid"), ribosomes (protein-making "factories"), a plasma membrane, a cell wall, and a surface layer which may or may not be an inherent part of the cell wall. These structures are arranged into three architectural regions: (1) a cytoplasmic region that is typically over 70% water and near pH neutrality. This region contains the cell's genetic material, ribosomes, gas vacuoles that confer buoyancy to the cell, and various "inclusions" and granules that serve as specific storage sites. The soluble portion ("cytosol") contains a variety of small organic molecules and dissolved inorganic ions; (2) a rigidifying cell wall on top of a plasma membrane that provides support for the cell, protection from external physical stresses, and governs the cell's shape ("morphogenesis"). This region also acts as a filter by controlling the passage of dissolved molecules into the cell. The cell wall also may display attached appendages including flagella (filamentous protein structures to generate movement in motile strains), and fimbriae &amp; pilli (hair-like proteins, which exhibit a wide diversity of form and arrangement, involved in the attachment of cells to surfaces, substrates, and other cells); and (3) a surface layer. The three major types of surface layers are extracellular polymers ("capsules"), sheaths, and S-layers. This region's functions include (a) protection from environmental and pH extremes, (b) attachment &amp; adherence to surfaces, (c) stabilizing biofilm communities, (d) storage of carbon and energy reserves, (e) binding of metals, (f) formation of minerals that can serve as chemical buffers at the cell's periphery, (g) alteration of light dispersal patterns, and (h) the masking of the electrochemical charge characteristics of the cell wall, thereby mediating physiochemical reactions between the cell and the ions &amp; solids of the external environment (Konhauser, 2007).</p>
<h4>Bacterial Surface Charge and Protein Skimming</h4>
<p>Extending from the cell wall and surface layer regions are organic "functional groups". Functional groups are specific collections of atoms bound together into well-defined structures; these structures typically confer one distinct chemical reactivity pattern to the collection of atoms. Many of these organic functional groups can either bind hydrogen ions ("protonation") or release hydrogen ions ("deprotonation"), depending upon the pH of the bacteria cell's immediate environment. The combined protonation and deprotonation states of the functional groups on the cell wall largely determine the hydrophobic and hydrophilic characteristics of a bacterial cell at any given pH. Functional groups may also act as ligands that can bind with other ions or compounds to form larger molecular complexes. For example, it has been estimated that as much as 99% of the dissolved iron in ocean surface waters is bound to organic ligands (Granger, 1999). Such complexes also may impart a charge to the cell wall, thereby affecting the cell's hydrophobic-hydrophilic characteristics. Functional groups may be specialized to act as chelating agents for the capture and transport of specific ions ("siderophores"). The resultant complex may also affect surface charge.</p>
<p>A bacterial cell's surface charge affects its hydrophobic/hydrophilic characteristics and therefore that cell's potential to be removed from solution by foam fractionation ("protein skimming"). Bubble-based removal of particles like bacteria, as well as dissolved organic carbon (DOC), is largely dependent upon the hydrophobic character of the particle/molecule; the more hydrophobic patches, the greater the binding energy to the bubble's surface, and hence the greater likelihood for bubble-based removal (Feldman, 2010, and references cited therein). The addition of inorganic salts to a solution containing bacteria has been demonstrated to increase the rate of removal of bacterial cells from that solution (Gaudin, 1960 &amp; 1962). Magnesium chloride and calcium chloride have been demonstrated to increase the concentration of bacterial cells in the foam generated by protein skimming (Bretz, 1966). Differences between the types of functional groups present on the bacterial cell walls, bacterial cell surface charge, response to ambient pH, and the concentration of inorganic salts all influence the degree to which a bacterial cell is available for export via protein skimming. This influence occurs independently of the physical operating characteristics of a given protein skimmer.</p>
<h3><b>1.3 Bacterial life processes</b></h3>
<h4>Bacterial Metabolism</h4>
<p>Bacterial metabolism describes the set of chemical processes that allows bacteria to grow, reproduce, maintain structures, and interact with their environment. The physical and genetic characteristics of bacteria profoundly influence their metabolism. The small size of bacteria allows them to acquire external energy and nutrients at the cell's periphery and to optimize transport processes into/out of the cell. These transport processes include passive &amp; facilitated diffusion, active transport, and engulfing materials with their cell membrane (endocytosis). Bacteria synthesize proteins to regulate every phase of their metabolic behavior. The types of proteins that a bacterium can synthesize are determined by its genetic characteristics.</p>
<h4>Bacterial Growth</h4>
<p>Bacterial populations in marine aquaria may complete their life cycles entirely as isolated, or semi-isolated, strains within the system's water column ("free-living"), or attached to surfaces in a colony consisting of multiple strains ("biofilms" or "mats"). Bacteria populations demonstrate a growth cycle with four stages: (1) a "lag" phase, which is the initial period of time within which cells adjust to their new surroundings and synthesize proteins in response to that environment; (2) an "exponential growth" phase during which the population demonstrates a rapid increase in biomass; (3) a "stationary" phase during which there is no net increase or decrease in overall cell number, and groups within the population may be either metabolically active or inactive; (4) a "death" phase during which the number of viable cells decreases. As a population enters death phase, members of the population may compensate by budding and by the formation of protective structures such as exospores, endospores and cysts. Such protective structures have proven to be an extraordinarily successful evolutionary adaptation; for example, <i>Bacillus</i> spores have been resuscitated after preservation in amber for 25 million years (Cano, 1995). Factors characteristic to a bacteria's environment can also regulate bacterial growth patterns. These factors include nutrient availability, temperature, substrate supply, predation, and viral mortality.</p>
<h4>Bacterial Nutrients</h4>
<p>Marine bacteria utilize a vast group of elements and compounds to meet their energy and nutrient requirements. Marine bacteria have a special need for sodium. Other major elements required for marine bacteria growth and reproduction include carbon, nitrogen, phosphorous, oxygen, hydrogen, sulfur, potassium, magnesium, calcium, and iron. Common trace element requirements consist of manganese, cobalt, zinc, copper, and molybdenum. Chemical groups fulfilling energy and nutrient needs span an even broader range; inorganic carbon compounds, organic carbon compounds (generally, but not limited to, sugars and amino acids), inorganic &amp; organic nitrogen compounds, organic sulfur compounds, inorganic phosphate compounds, and potassium, magnesium, calcium, and iron salts. Marine bacteria can sequester elements, such as potassium, within their cells at concentrations far in excess of the concentration of the element in their environment (Thompson &amp; MacLeod, 1974). Such sequestration presents the possibility of some degree of elemental depletion in a marine aquarium by bacterial export via protein skimming.</p>
<h4>Manipulating Bacterial Growth</h4>
<p>A "limiting nutrient" is a nutrient that has the ability, though its presence or absence, to restrict the utilization of other nutrients. Bacterial growth rates, bacterial carbon production, and bacterial growth efficiency all increase with the addition of organic carbon supplements in certain groups of marine bacteria (Carlson, 1996). The presence of a readily assimilated carbon source has been demonstrated to increase the uptake of ammonium in certain groups of marine bacteria (Goldman, 2000). The availability of a particular nutrient can not only affect a bacterial population's growth rate, but also the metabolic functioning of the population. The availability of organic carbon has been shown to not only limit the growth rate of denitrifying bacteria, but also to limit the rate at which denitrification takes place (Brettar, 1992). Chemical entities other than organic carbon, such as inorganic phosphate, also can function as limiting nutrients (Rivkin, 1997). Indeed, given the rapid and dynamic shifts in marine bacteria metabolic behavior over time in response to changing nutrient availability, it may be inappropriate to describe marine bacteria as being limited by a single nutrient.</p>
<p>The frequency with which nutrient enrichments are supplemented has the potential to exert a significant effect on bacteria populations. Nutrient regimes of different periodicities have been shown to result in mixed heterotrophic bacterial communities with distinct physiological properties. It also was observed that the interplay between various bacterial strains and other participants within the microbial community may be equally as important as the selective forces of the environment in structuring microbial communities. Perhaps most interestingly, when replicate bacterial cultures were subjected to identical nutrient supplementation, the microbial community functionality was conserved despite the fact that community compositions were significantly different (Carrero-Colon, 2006). Thus, there appears to be a great deal of bacteria community plasticity in response to environmental changes, one of the hallmarks of bacteria as a successful species over evolutionary time.</p>
<h4>The Coral Holobiont</h4>
<p>A coral's holobiont is comprised of close associations between the coral animal itself, its symbiotic zooxanthellae, and a diversity of associated microbes including bacteria, archaea, algae, and fungi. These associations can take place in the coral's immediate environment, on its surface, within its tissues, and within its skeleton (if present). This paradigm emphasizes the potential contributions of each component to the overall function and health of the coral (Rypien, 2010). The dynamic nature of these relationships can be seen in a comparison between freshly collected corals from the Red Sea region that were then placed into marine aquaria. A microbial community shift in the bacteria inhabiting the surface mucus layer was documented for collected corals when placed into the captive marine aquarium. The differences that emerged between corals from natural and captive environments suggested an adaptation of the mucus bacterial communities to the different conditions (Kooperman, 2007).</p>
<p>Disruptions within a coral's holobiont have the potential to negatively impact the coral's health. Altered bacterial community structures have been linked to both coral disease and bleaching (Kvennefors, 2010). Coral bleaching occurs if the endosymbiosis between corals and their symbiots disintegrates during stress (Ainsworth, 2008). Even so, shifts in the holobiont's bacterial community component may not be a direct cause of coral bleaching. While bacterial communities play important roles in coral stasis and health, environmental stressors appear to be the primary triggers for coral bleaching, and bacterial involvement in patterns of bleaching appear to be the result of opportunistic colonization (Ainsworth, 2008).</p>
<h4>"Probiotic" Application of Bacteria</h4>
<p>A "probiotic" can be defined as a live microbial adjunct that offers a benefit to animals, algae, plants, corals, or the ambient microbial community. This benefit can be assessed in terms of an improved use of food (i.e., enhanced nutritional value), enhanced disease resistance, or by improving the quality of the ambient environment (Verschuere et al., 2000). The introduction of live bacteria cultures into a marine aquarium may be viewed as a "probiotic" husbandry technique.</p>
<p>Deterministic (non-random) factors influencing the survivability of bacteria that are deliberately introduced into a marine aquarium include salinity, temperature, oxygen concentration, and the quality and quantity of available nutrients. The development of a microbial community within a marine aquarium is also influenced by stochastic (random) phenomena: chance favors organisms that happen to be in the right place at the right time to enter the system and to proliferate if suitable conditions exist. It is this stochastic aspect that explains why different marine aquaria may evolve distinctly different microbial communities despite the appearance of nearly identical conditions. The idea that both environmental conditions and random chance influence the emergence of microbial communities provides the context for the concept of probiotics as biological conditioning and control agents. During a time period in which a stable microbial community in a marine aquarium is still emerging, a single addition of a live bacterial culture may suffice to achieve colonization and persistence in the ambient environment, provided that the strains being added are well adapted to the prevailing environmental conditions. When the environment already carries a relatively stable microbial community, it is more likely that a live bacterial culture will have to be added on a regular basis in order to achieve an artificially stable presence in the microbial community (Verschuere et al 2000).</p>
<h3><b>1.4 Counting bacteria in the water column</b></h3>
<p>Probing all of the issues of bacterial commerce in the reef aquarium as listed in <b>1.1</b> above requires access to one specific experimental methodology; the capability to count bacteria in marine water. Enumeration (counting) bacteria in marine water samples proved to be a pivotal early technology in developing an understanding of the ecological significance of bacterial populations in various environmental niches (Robertson, 1989; Button, 1989; Troussellier, 1995; Marie, 1997). Early (and later) attempts to quantify marine bacteria by first culturing them in growth media mimicked the similar successful approaches of medical microbiologists in growing pathogenic bacteria with specific growth media that crudely reproduced the body's environment. Unfortunately, a lack of appreciation of appropriate growth media for "environmental" marine bacteria, as opposed to "human" bacteria, has resulted in culture efficiencies of no better than the 1-10% range (Porter, 2004). This limitation still holds true today. Consequently, alternative counting methodologies, which did not require independent culturing, were explored.</p>
<p>One early and quite successful approach utilized direct counting via <span>epifluorescence microscopy</span> (Hobbie, 1977). This technique involves nothing more conceptually complicated than "manually" counting bacteria made visible via a microscope's optics. To implement this counting methodology, a water sample is filtered through a special polycarbonate filter with 0.2 um pores, and the bacteria laden filter pad is then examined under a special type of microscope. The bacteria that do not pass through the filter then can be counted using any one of several image analysis software packages. The bacteria must be stained in order to visualize them. It is a "direct" technique that provides an absolute count of bacteria present for a given volume of sample. It has the advantages of being relatively fast and technically easy, and it can account for bacterial "clumping" as is sometimes seen. In practice, it suffers from some limitations that can compromise its effectiveness. For example, one problem that arises is the limited lifetime of the "stain" - the light emitted from the microscope will photobleach the staining compound, rendering the bacteria invisible, on a time scale similar to that needed to complete the measurement. In addition, the entire surface of the membrane filter is too large to be examined, and so only selected areas are chosen and counted. Then, various assumptions are made about homogeneity of the sample, and mathematical algorithms are applied to the raw data set to permit extrapolation from the counted regions to the entire filter disk in order to estimate an overall count. Thus, there is a significant level of subjectivity that attends epifluorescence microscopy measurements ("Is that dim spot a bacterium whose stain has faded, or is it junk?" "Did the filtration process lead to a homogeneous distribution of bacteria on the filter, or was there wicking towards the outer rim of the circular disk?"). Nevertheless, an experienced operator can generate a self-consistent bacterial count rather rapidly. As an example, Fig. 1 illustrates the results of a bacteria staining/counting experiment with water from the author's 175-gallon reef aquarium. The bacteria are stained with a dye called SYBR1-Green (more on this dye below), and this photograph represents one "field" of the microscope's view. The entire 25 mm-diameter filter disk is composed of approximately 10,000 such fields. Note that there is significant variation in the size, and in the color intensity, of the green "dots"; which are bacteria?</p>
<div class="photo-wrapper"><a class="popup" href="aafeature_album/fig_01.jpg" rel="gallery" title="Figure 1. A photograph, taken with an Olympus BX61 epifluorescence microscope, of SYBR1-Green stained bacteria collected on a 0.2 um filter disk. The water sample originated from a 175-gallon reef aquarium."><img src="aafeature_album/fig_01.jpg/image_preview" alt="fig_01.jpg" class="image-inline" /></a>
<p class="caption"><b>Figure 1</b>. A photograph, taken with an Olympus BX61 epifluorescence microscope, of SYBR1-Green stained bacteria collected on a 0.2 um filter disk. The water sample originated from a 175-gallon reef aquarium.</p>
</div>
<p>A second independent technique for marine water bacteria enumeration has emerged recently, once again from the medical microbiology community, as an alternative to epifluorescence microscopy; this newer methodology is called <span class="c3">flow cytometry</span> (Robertson, 1989). Flow cytometry, like epifluorescence microscopy, is a direct counting technique that requires initial bacteria staining. SYBR1-Green has emerged as the dye (stain) of choice for a variety of reasons, not the least of which are (1) its relative resistance to photobleaching, and (2) the fact that it turns "on", or glows green, only when it is embedded ("intercalated" is the correct term) into double-stranded DNA, see Fig. 2 (Marie, 1997; Noble, 1998; Lebaron, 1998). Thus, the stain used for these experiments only registers at the detector if it is intercalated in double-stranded DNA as would be found in biological specimens like bacteria, but not in random small particles of junk.</p>
<p>One major advantage of flow cytometry over epifluorescence microscopy stems from the fact that crude water samples can be used without filtration, thus removing the possibility of inadvertent sample sorting and loss of some bacteria. In addition, incorporation of size-specific calibration beads in the sample allows for a crude determination of size, and so it is possible to discriminate between "objects" and exclude those outside of a given (bacterial) size range. Flow cytometry uses a sophisticated fluid transfer system that exploits hydrodynamic focusing in order to pass a bacteria-containing water sample that includes a known quantity of the added calibration beads through an aperture so that particles (bacteria, calibration beads, detritus, etc.) pass through a laser beam single file, Fig. 2. High-end optics collect and then focus the scattered light from each particle. Sensitive photodetectors then discriminate between the scatter and fluorescence from individual particles. The residence time of the stained bacterium in the laser beam is short enough that photobleaching is not a problem. Perhaps more importantly, <i>all</i> of the bacteria in a given sample volume can be counted both rapidly (~ 5 min for a 1 mL sample) and objectively by applying standard counting parameters that do not vary from sample-to-sample, operator-to-operator, or from day-to-day.</p>
<p>A cytometer operator does have to decide which particle-based fluorescence intensities to include or exclude. Bacteria that have lost DNA possibly due to environmental conditions would exhibit very weak intensities and therefore might be missed. However, once the decision is made about what constitutes a baseline for intensities to include in the count, that baseline value remains constant for subsequent samples and experiments. Thus, this consistency, along with the size discrimination capability, adds another level of confidence that the objects counted as bacteria are actually bacteria. Flow cytometry does have some liabilities that are not shared by epifluorescence microscopy; the complicated fluidics can get clogged by detritus in the water column, and bacterial clumps, which are characteristic of some types of bacteria, can be missed. Finally, since cytometry is both a light scattering technique and a fluorescence measuring technique, the minimum size of the particle that can be detected is dependent on the wavelength of the light used and the aperture of the collection optics; in our experiments, wavelengths in the 0.4 - 0.6 um range impose a practical lower limit for distinguishing particle sizes of about 0.5 um, which is towards the lower end of bacteria sizes. Epifluorescence microscopy suffers from this drawback as well; detection limits in microscopy also are limited by wavelength and the quality of the microscope optics. Overall, the speed, convenience, and objective and unbiased counting protocol recommend flow cytometry as a useful technique for marine water bacteria enumeration. More recently, a third direct approach for estimating (not counting) bacteria in marine water samples has been described (Wegley, 2006).</p>
<div class="photo-wrapper"><a class="popup" href="aafeature_album/fig_02.jpg" rel="gallery" title="Figure 2. A schematic of a flow cytometry experiment (the final picture is used with permission from Sysmex Corp.)"><img src="aafeature_album/fig_02.jpg/image_preview" alt="fig_02.jpg" class="image-inline" /></a>
<p class="caption"><b>Figure 2.</b> A schematic of a flow cytometry experiment (the final picture is used with permission from Sysmex Corp.)</p>
</div>
<p>Several reports that compare the results of epifluorescence microscopy-based bacteria counting to flow cytometry-based bacteria counting have confirmed that there are only negligible differences between the measured populations of bacteria in both marine and non-marine water samples (Robertson, 1989; Monfort, 1992). In the experiments that follow, the flow cytometry technique is used exclusively to count bacteria in aquarium (and other) water samples.</p>
<h2><b>2. Experimental Approach</b></h2>
<p>We adapted for our studies procedures reported to be successful for bacteria enumeration in marine water samples (Marie, 1999; Grégori, 2001). The protocol involves collecting a water sample in a sterile vessel, preserving it with formaldehyde solution, adding a precise quantity of 6 <i>u</i>m diameter counting beads and SYBR1-Green dye to a measured portion of the sample, and running it on a Coulter XL cytometer (see Fig. 3). Dedicated data analysis software then provides a direct count of both the beads and the "bacteria" in a given volume of water sample. In these experiments, the counted "bacteria" include any particle that meets the following criteria: (1) it is between ~0.5 and 6 um in diameter, (2) it contains double-stranded DNA, and (3) it does not fall into a region of the data plot where control experiments indicate that only debris and/or chlorophyll-containing organisms (i.e., phytoplankton), and not bacteria, show up (more details below). The "countable" size range of ~ 0.5 - 6 um was chosen to overlap with the typical size ranges of bacteria from marine environments; some phytoplankton likely will "leak through" and be counted as well. We did not view including some phytoplankton in the overall bacteria count as a problem, since both of these water column microorganisms have TOC removing capabilities, and also both are likely to serve as food for filter feeders and other predators as well. Larger organisms (diatoms, ciliated protozoa, copepods, etc.) will not be counted by this method, nor will smaller organisms (viruses).</p>
<div class="photo-wrapper"><a class="popup" href="aafeature_album/fig_03.jpg" rel="gallery" title="Figure 3. The Coulter XL cytometer, run by Alison Place (Pennsylvania State University)."><img src="aafeature_album/fig_03.jpg/image_preview" alt="fig_03.jpg" class="image-inline" /></a>
<p class="caption"><b>Figure 3.</b> The Coulter XL cytometer, run by Alison Place (Pennsylvania State University).</p>
</div>
<h3><b>2.1 General experimental</b></h3>
<p>A 25.0 mL water sample was collected in a sterile VWR brand centrifuge tube and immediately 0.5 mL of a 37% aqueous formaldehyde solution as a preservative was added. The tube was capped, shaken vigorously, and placed in a -4<sup>o</sup>C freezer pending analysis. If this sample was drawn from an aquarium, an effort was made to avoid surface water. The tube was immersed upside down about 4" - 6" below the water surface, rapidly inverted, and then removed from the aquarium and drained until the volume was 25.0 mL. Other water samples either were collected on site (Florida Keys mangrove estuary) by this procedure, or the sample tube was simply filled to the 25.0 mL mark with the appropriate water specimen (Aquafina, RO/DI/0.2 um filtered, tap water, etc.) prior to formaldehyde addition. The samples were rapidly thawed by immersion in warm water just prior to analysis. After vigorous agitation via a Vortex mixer, three independent 960 uL samples were removed from each tube and placed in sterile 2 mL centrifuge tubes. Into each tube was placed 20.0 uL of a diluted (see below) SYBR1 Green solution and then 20.0 - 60.0 uL of a 3.3 x10<sup>7</sup> bead/mL solution in 3 mM aqueous NaN<sub>3</sub> (as a bactericidal agent) (volume depended upon the anticipated bacteria count). The SYBR1 Green stock solution was freshly prepared just prior to each run as follows: 20 uL of a commercially available solution of SYBR1 Green in DMSO (Invitrogen; the exact concentration is proprietary information, but the dilution that we used follows their suggested cytometry protocols) was added to 380 uL of an aqueous DMSO solution that was made from 40 uL of DMSO + 360 uL of RO/DI/0.2 um filtered water. This solution was vigorously mixed with a Vortex mixer, passed through two successive 0.2 um filters, and used immediately. The bead solution was prepared by adding 10 uL of a 3.3 x 10<sup>8</sup> bead/mL stock solution (Polysciences) to 90 uL of 3 mM aqueous NaN<sub>3</sub>. This solution was vigorously mixed with a Vortex mixer and used immediately. The 1000 - 1040 uL sample (water sample + beads + SYBR1 Green) was inserted into the Coulter XL inlet and the enumeration run was initiated and monitored by the dedicated software. Note that each water sample was run in triplicate.</p>
<h3><b>2.2 Control experiments and bacterial contamination</b></h3>
<p>Several of the procedures described above were tested for the possibility that contaminating bacteria were introduced, by running appropriate controls. For example, the formaldehyde solution was pre-filtered through a 0.2 um filter prior to use, although we observed that ± this filtration treatment did not lead to any significant difference in bacteria counts for the same water sample. Testing for bacterial introduction via contaminated reagents, or through contamination in the XL cytometer itself, was conducted along with every run. A "blank" composed of pure RO/DI/0.2 um filtered water, either treated with formaldehyde or not, was used for this test. In all cases, the blank bacteria counts were &lt; 10000/mL, and in most experiments &lt; 2000/mL. In comparison, actual bacteria counts in marine water were on the order of 10<sup>5</sup> - 10<sup>6</sup> bacteria/mL. The effect of freezing the samples on bacteria counts was tested by splitting a sample between fresh and frozen, and running both samples on different days. No significant differences between fresh and frozen bacteria counts were observed. On the other hand, leaving a formaldehyde-treated sample at <span class="c3">room temperature</span> for several days before analysis led to an approximately 10-20% decrease in the bacteria count compared to a freshly run sample.</p>
<h3><b>2.3 Data workup</b></h3>
<p>The Coulter XL Flow Cytometer has sophisticated internal electronics that aid in one of the primary functions of the instrument in addition to strictly counting; "gating", or discriminating among the particles in the sample in order to analyze the specific species of interest, in this case bacteria and other microbes of related size. Because flow cytometry counts particles irrespective of sample volume, beads with known concentrations are counted in the same volume as the bacteria, thus permitting the determination of the sample volume holding a certain count of bacteria (=&gt; bacteria "concentration"). The use of the fluorescent indicator SYBR1-Green provides the means to identify and then count "objects" that correspond to bacteria. In addition, the added 6.0 um diameter calibration beads, which are chosen to have physical characteristics that allow them to be easily distinguished from bacteria, are identified and counted. The emission spectrum of SYBR1-Green bound to double stranded DNA is illustrated in Fig. 4 below. In order to discriminate between actual bacteria and similarly sized detritus and phytoplankton (to a degree), we measure and plot the intensity of the green fluorescence (530 nm, the top of the large peak of the green line) vs. the red fluorescence (the signal at 610 nm). Note that for SYBR1-Green, the green/red signal strength ratio is a constant, ~ 7:1. Thus, any increase in green fluorescence intensity (530 nm), such as might accompany, for example, multiple and independent binding of several SYBR1-Green molecules to the double stranded DNA of a single bacterium, should be matched by a proportional increase in the red (610 nm) signal; that is, plotting green vs. red fluorescence intensity should produce a straight line. In actuality, it produces an elliptical region on the red/green plot illustrated in the representative cytogram shown in Fig. 5c below. Note that damaged or stressed bacteria might have less highly coiled DNA, which could alter the green/red ratio as well.</p>
<div class="photo-wrapper"><a class="popup" href="aafeature_album/fig_04.jpg" rel="gallery" title="Figure 4. Absorption and emission spectra of SYBR1-Green bound to double stranded DNA (from Wikipedia)."><img src="aafeature_album/fig_04.jpg/image_preview" alt="fig_04.jpg" class="image-inline" /></a>
<p class="caption"><b>Figure 4.</b> Absorption and emission spectra of SYBR1-Green bound to double stranded DNA (from Wikipedia).</p>
</div>
<p>The drawn perimeter in this Green/Red plot (Fig. 5c) contains the counted responses. All other detector responses outside of this region are ignored. What is the basis of ignoring these other responses? In actuality, there are two factors that contribute to the choice of the region to count. (1) Plankton-derived contaminants, in particular chlorophyll-containing detritus, have a natural red autofluorescence (Marie, 1999). Thus, signals that have "too much red", i.e., are off the counted ellipse toward the higher red end, are likely to reflect contamination by phytoplankton/chlorophyll (or possibly other red autofluorescing detritus). These particles are less likely to be examples of the bacteria of interest, <span>which lack chlorophyll</span>, and so they are omitted. (2) Pure water blanks that lack any substantial bacteria are run to establish a baseline detritus region on the red/green plot. These bacteria-independent signals tend to congregate at low green fluorescence intensity and towards the higher red end (lower right of the Fig. 5b red/green plot). They can be easily avoided when determining the bacteria count (= the L-gate) by excluding them from the counted region, as illustrated with Fig. 5c. As a practical matter, we can count these "excluded" signals as well by using data within the FS/SS graph (= entire population of counted signals; FS = forward scatter, SS = side scatter), and typically the excluded signals ( bacteria) in the red/green graph constitute about 10 - 40 % of the entire population of counted signals. So, most of the particles that meet the "bacteria" size criteria are counted in any event. For example, in Fig. 5c, 10000 out of a possible 13647 signals are counted as bacteria.</p>
<p>By this analysis, it is apparent that, much like with epifluorescence microscope visual inspection, the instrument operator must make a decision about which data points correspond to valid bacteria counts, and which do not. Both techniques use a dye (SYBR1-Green) that only lights up when attached to objects containing double-stranded DNA, so that requirement eliminates most similar-sized but non-bacterial detritus. However, with cytometry, there is one additional and valuable input criterion that can be used to distinguish bacteria; red/green intensity plots. Thus, a second check on non-bacterial detritus/phytoplankton can be accomplished.</p>
<div class="photo-wrapper"><a class="popup" href="aafeature_album/fig_05a.jpg" rel="gallery" title="Figure 5a. Representative cytograms. FS/SS plots of precisely sized polystyrene calibration beads, indicating the region in the FS/SS plot where bacteria-sized particles might be found. "><img src="aafeature_album/fig_05a.jpg/image_preview" alt="fig_05a.jpg" class="image-inline" /></a>
<p class="caption">Figure 5a. Representative cytograms. FS/SS plots of precisely sized polystyrene calibration beads, indicating the region in the FS/SS plot where bacteria-sized particles might be found.</p>
</div>
<div class="photo-wrapper"><a class="popup" href="aafeature_album/fig_05b.jpg" rel="gallery" title="Figure 5b. Representative cytograms. A RO/DI/0.2 um-filtered " bacteria-free="bacteria-free"><img src="aafeature_album/fig_05b.jpg/image_preview" alt="fig_05b.jpg" class="image-inline" /></a>
<p class="caption">Figure 5b. Representative cytograms. A RO/DI/0.2 um-filtered "bacteria-free" water blank, illustrating the region of the red/green cytogram where non-bacterial signals are found.</p>
</div>
<div class="photo-wrapper"><a class="popup" href="aafeature_album/fig_05c.jpg" rel="gallery" title="Figure 5c. Representative cytograms. A typical (unskimmed) aquarium water sample; both FS/SS and red/green plots are illustrated. The bacteria count corresponds to the L-gate region of the red/green graph."><img src="aafeature_album/fig_05c.jpg/image_preview" alt="fig_05c.jpg" class="image-inline" /></a>
<p class="caption">Figure 5c. Representative cytograms. A typical (unskimmed) aquarium water sample; both FS/SS and red/green plots are illustrated. The bacteria count corresponds to the L-gate region of the red/green graph.</p>
</div>
<p>The counts from two gates illustrated on the cytogram in Fig. 5c are relevant to the bacteria enumeration question; the L gate, which displays the count of bacteria, and the E gate, which displays the bead count. The instrument is set up to stop counting when the bacteria count reaches 10000 or after 300 seconds have elapsed, whichever occurs first. The former criterion is almost always reached in authentic marine water, reflecting the relatively large (compared to blank controls) number of bacteria present. In water blanks, considerably less bacteria are counted and the 300-second limit is usually reached. The real number of value, then, is the bead count from the E gate. Since we know the concentration of beads in the sample, and the cytogram gives us the ratio of beads counted to bacteria counted for a given volume of sample (the amount that passes until the bacteria count reaches 10000), we can use a simple ratio to get the bacteria population in a known volume of the sample. An illustration of the calculation for the data in Fig. 5c is given below:</p>
<p>Bead population: 3.29 x 10<sup>7</sup> beads/mL starting stock solution concentration x 0.060 mL = 2.0 x 10<sup>5</sup> beads added to the sample. The sample volume = 0.960 mL + 0.060 mL (bead solution) + 0.020 mL (SYBR solution) = 1.040 mL total volume, so the final bead concentration = 2.0 x 10<sup>5</sup> beads/1.040 mL = 1.9 x 10<sup>5</sup> beads/mL.</p>
<p>So, bacteria/mL = bacteria (L-gate)/beads (E-gate) x 1.9 x 10<sup>5</sup> beads/mL</p>
<p>However, we have not yet accounted for either (a) the initial dilution of the 25.0 mL sample by addition of 0.5 mL of formaldehyde, or (b) the dilution of this water/formaldehyde solution upon addition of the bead solution and the SYBR1-Green solution. So, we have to multiply the above quantity by both (a) 25.5 mL total volume/25 mL sample volume (= 1.02) and (b) 1.040 mL total volume/0.960 mL sample volume (= 1.08):</p>
<p>(1) Bacteria/mL = L-gate(bacteria #)/E-gate(bead #) x 1.9 x 10<sup>5</sup> beads/mL x 1.02 x 1.08</p>
<p>Eq. (1) is the formula that allows us to arrive at a bacteria population in a water sample from the raw cytometer data. In the specific case illustrated in Fig. 5c,</p>
<p>bacteria/mL = 10000/2049 x 1.9x10<sup>5</sup> x 1.02 x 1.08 ~ 1,021,149 bacteria/mL. Significant figure restrictions ("0.060 mL" of bead solution is only reported to 2 significant figures) would require that this value be reported as 1,000,000 bacteria/mL.</p>
<p>Each water sample was run in triplicate, and the averaged values with standard deviation (although not technically applicable to a three sample data set) are reported in the Results section below.</p>
<h2><b>3. Results and Discussion</b></h2>
<h3><b>3.1 Baseline bacteria counts</b></h3>
<p>The initial experimental foray in reef tank water bacteria enumeration was focused on establishing baselines for bacteria populations under different husbandry regimes. Later, these baselines will be used as comparison points in experiments where the system is perturbed, either by carbon dosing or by mechanical filtration (skimming, GAC). Much prior effort in the area of bacteria counting from authentic reef water has led to an expansive body of work. A few representative examples are documented in Table 1, where bacterial counts from reef water in Hawaii, Micronesia, Key Largo, and the Northern Line Islands all converge on a span of bacteria populations in the 500K - 1500K/mL range or so. The counts from the Northern Line Islands, Ponape Island, and Key Largo were derived from epifluorescence microscopy measurements, whereas the Kaneohe Bay data were acquired via flow cytometry. In addition, we sampled water from a mangrove estuary in the Florida Keys, and not surprisingly, this highly sedimented shoreline water exhibited a bacterial population (3300-4400K/mL) much higher than those observed in the more pristine reef waters. These values serve as standards for comparison to aquarium water, and they will help address the question, "Are our reef tanks similar to, or different than, an authentic reef with respect to water column bacterial populations?"</p>
<p>A second series of bacterial counts focused on control water samples of various origins. These data represent low-end standards that delineate the limits of our counting technique. For example, every experimental run was accompanied by an RO/DI/0.2 um filtered water blank to ensure that the flow cytometry instrument itself was not a source of bacterial contamination. It did not seem to matter whether these samples were treated with formaldehyde preservative or not; similar counts were obtained in both cases. Overall, these "sterile" water blanks typically displayed counts in the 1000 - 5000 bacteria/mL range; occasionally, values as high as 10000 bacteria/mL were observed. Since bacteria counts of authentic aquarium or marine water samples were 1-2 orders-of-magnitude greater than these blank values, we concluded that instrument contamination was not likely to increase the measured bacteria counts in any significant way. Both Aquafina bottled water and the RO/DI water produced in the 175-gallon aquarium make-up water system were almost sterile: <span>&lt;</span> 1500 bacteria/mL. State College Pennsylvania tap water, on the other hand, did carry a modest bacterial load; 27K/mL.</p>
<p>The surveyed reef aquariums divided into two distinct sets of husbandry protocols; aggressive and passive (see Fig. 6 for pictures of these aquariums). The aggressive husbandry practices included protein skimming, GAC filtration, and regular water changes in an active effort to scrub the water of nutrients. The passive approach did not involve any of these procedures. Interestingly, the aquaria subjected to passive husbandry exhibited bacterial counts that fell within the range seen on authentic reefs; 200 - 1000K/mL. On the other hand, the tanks that "benefited" from careful attention to nutrient removal protocols displayed bacteria/mL counts that fell far short of these numbers; only 90-140K/mL. In addition to monitoring water column bacteria counts, the TOC (Total Organic Carbon, see Feldman, 2008) levels were examined as well. Not surprisingly, the tanks with "unpurified" water exhibited TOC levels greater than those seen with the skimmed/GAC-filtered tanks. The "purified" aquaria's TOC levels fall within the typical TOC range seen on authentic, healthy reefs (Feldman, 2008); the passively husbandry tanks were 2-3x higher.</p>
<p>The observation that, at least among this small set of aquaria examined, the water within the skimmed/filtered tanks had only ~ 1/10th of the population of bacteria that the unskimmed/unfiltered tanks had was a real surprise. It speaks to one aspect of aquarium husbandry in which a perhaps important parameter (?), water column bacteria counts from authentic and healthy reefs, is not reproduced at all effectively in these home aquaria. Sensitive corals, like <i>Acropora</i>, do not thrive in the high-bacteria-count/high-TOC-level tanks examined, although soft corals do well (see pictures). On the other hand, SPS corals do well in the low-bacteria-count/low-TOC-level tanks (Fig. 6). These observations raise a number of questions, chief among them perhaps are, (1) "Do water column bacteria counts have any relevance to the short-term or long-term prospects for maintaining SPS in captive aquaria?", and (2) "What is the relationship between TOC and water column bacteria population?" The former question, whereas perhaps more interesting, remains unanswered. The latter question (TOC vs. bacteria population), which bears on the topic of carbon dosing, will be addressed below.</p>
<table class="listing nosort" id="table1">
<caption>Table 1. Bacterial counts from authentic marine water, various control samples, and several reef tanks.</caption> <thead> 
<tr>
<th>Sample</th> <th>Water volume (gal)</th> <th>skimmer</th> <th>GAC</th> <th>GFO</th> <th>Water change</th> <th>TOC ppm</th> <th>Sandbed</th> <th>Bacteria/mL</th>
</tr>
</thead> <tfoot> 
<tr>
<td colspan="9"><sup>a</sup>Monger, 1993 <sup>b</sup>Dinsdale, 2008 <sup>c</sup>Yoshinaga, 1991 <sup>d</sup>Paul, 1993 <sup>e</sup>This work</td>
</tr>
</tfoot> 
<tbody>
<tr>
<td>Kaneohe Bay, Hawaii<sup>a</sup></td>
<td></td>
<td></td>
<td></td>
<td></td>
<td></td>
<td></td>
<td></td>
<td>800-1500K</td>
</tr>
<tr>
<td>Northern Line Islands<sup>b</sup></td>
<td></td>
<td></td>
<td></td>
<td></td>
<td></td>
<td></td>
<td></td>
<td>50 - 800K</td>
</tr>
<tr>
<td>Ponape Island, Micronesia<sup>c</sup></td>
<td></td>
<td></td>
<td></td>
<td></td>
<td></td>
<td></td>
<td></td>
<td>800-1600K</td>
</tr>
<tr>
<td>Key Largo, Florida<sup>d</sup></td>
<td></td>
<td></td>
<td></td>
<td></td>
<td></td>
<td></td>
<td></td>
<td>300-1000K</td>
</tr>
<tr>
<td>Mangrove estuary, Fl. Keys<sup>e</sup></td>
<td></td>
<td></td>
<td></td>
<td></td>
<td></td>
<td></td>
<td></td>
<td>3300-4400K</td>
</tr>
<tr>
<td>RO/DI/0.2 uM filtered H<sub>2</sub>O</td>
<td></td>
<td></td>
<td></td>
<td></td>
<td></td>
<td></td>
<td></td>
<td>1-10K</td>
</tr>
<tr>
<td>KSF RO/DI</td>
<td></td>
<td></td>
<td></td>
<td></td>
<td></td>
<td></td>
<td></td>
<td>1.1±0.3K</td>
</tr>
<tr>
<td>Aquafina</td>
<td></td>
<td></td>
<td></td>
<td></td>
<td></td>
<td></td>
<td></td>
<td>1.5±0.5K</td>
</tr>
<tr>
<td>State College PA tap water</td>
<td></td>
<td></td>
<td></td>
<td></td>
<td></td>
<td></td>
<td></td>
<td>27±6K</td>
</tr>
<tr>
<td>Sanjay 55</td>
<td>55</td>
<td>no</td>
<td>no</td>
<td>no</td>
<td>rarely</td>
<td>2.72</td>
<td>no</td>
<td>590±70K</td>
</tr>
<tr>
<td>Sanjay 29</td>
<td>29</td>
<td>no</td>
<td>no</td>
<td>no</td>
<td>rarely</td>
<td>1.69</td>
<td>no</td>
<td>1000±80K</td>
</tr>
<tr>
<td>Sanjay 28</td>
<td>28</td>
<td>no</td>
<td>no</td>
<td>no</td>
<td>rarely</td>
<td>2.14</td>
<td>yes</td>
<td>220±10K</td>
</tr>
<tr>
<td>KSF 175</td>
<td>168</td>
<td>yes</td>
<td>yes</td>
<td>yes</td>
<td>17%/wk</td>
<td>0.50</td>
<td>yes</td>
<td>105±10K</td>
</tr>
<tr>
<td>PSU HUB 500</td>
<td>500</td>
<td>yes</td>
<td>yes</td>
<td>yes</td>
<td>10%/wk</td>
<td>1.0</td>
<td>yes</td>
<td>91±13K</td>
</tr>
<tr>
<td>Sanjay 500 Zeovit</td>
<td>500</td>
<td>yes</td>
<td>yes</td>
<td>yes</td>
<td>14%/2-3 wks</td>
<td>0.90</td>
<td>yes</td>
<td>140±10K</td>
</tr>
</tbody>
</table>
<p>The reef aquariums that were monitored for their bacterial populations:</p>
<div class="photo-wrapper"><a class="popup" href="aafeature_album/fig_6a_ksf175.jpg" rel="gallery" title="Figure 6a. KSF 175 gallon reef tank"><img src="aafeature_album/fig_6a_ksf175.jpg/image_preview" alt="fig_6a_ksf175.jpg" class="image-inline" /></a>
<p class="caption"><b>Figure 6a.</b> KSF 175 gallon reef tank</p>
</div>
<div class="photo-wrapper"><a class="popup" href="aafeature_album/fig_06b_sj500.jpg" rel="gallery" title="Figure 6b. SJ 500 gallon reef tank"><img src="aafeature_album/fig_06b_sj500.jpg/image_preview" alt="fig_06b_sj500.jpg" class="image-inline" /></a>
<p class="caption"><b>Figure 6b.</b> SJ 500 gallon reef tank</p>
</div>
<div class="photo-wrapper"><a class="popup" href="aafeature_album/fig_06c_sj55g.jpg" rel="gallery" title="Figure 6c. SJ 55 gallon reef tank"><img src="aafeature_album/fig_06c_sj55g.jpg/image_preview" alt="fig_06c_sj55g.jpg" class="image-inline" /></a>
<p class="caption"><b>Figure 6c.</b> SJ 55 gallon reef tank</p>
</div>
<div class="photo-wrapper"><a class="popup" href="aafeature_album/fig_06d_sj29g.jpg" rel="gallery" title="Figure 6d. SJ 29 gallon reef tank"><img src="aafeature_album/fig_06d_sj29g.jpg/image_preview" alt="fig_06d_sj29g.jpg" class="image-inline" /></a>
<p class="caption"><b>Figure 6d.</b> SJ 29 gallon reef tank</p>
</div>
<p>The bacteria/mL counts for the aquaria described in Table 1 reflect single-time-point measurements, and it is possible that hourly, daily, or other fluctuations in bacterial populations have been missed. These modulations in bacterial populations might result from the light on/off cycle, food additions, pH swings, etc. In order to probe this point, a few week-in-the-life longitudinal studies were conducted on both the 175-gallon reef tank and the 55-gallon reef tank. The first experiment covered 5 days of typical aquarium life, with the skimmer deliberately off for the first three days, the UV sterilizer on, and the GAC and GFO filters on, Fig. 7. Over the course of this experiment, the water column bacteria population fluctuated between ~ 95K and 115K bacteria/mL, a ~ 20% spread in values. The skimmer was turned off at t = 0, and the count rose steeply over the next 12 hours, and then declined to the starting point at the 2-day mark. At that point, a gradual rise to the maximum recorded value, 115K/mL occurred. Turning the skimmer back on at the 3.5-day mark may have slowed the rate of this increase slightly, but the data are not compelling on this point.</p>
<p>It is temping to attribute the initial steep rise to a presumed corresponding increase in the carbon source TOC, since the TOC-removing skimmer was turned off at t = 0. During this growth phase, nitrogen and phosphorus nutrients as well as C would be stripped from the water column also. In this interpretation, the subsequent decline in bacteria population at the 12-hour mark might reflect a depletion of these N and P nutrients required for bacteria population growth; that is, perhaps the initial growth spurt might reflect an increase in C concentration (skimmer off) in a C-limiting bacterial growth regime, and the subsequent decline at 12 hours might indicate a switch over to a N and/or P limited growth regime. This hypothesis dovetails nicely with the Carbon Dosing ideas described earlier. However, it is important to appreciate that simply observing the expected result of a hypothesis does not validate that hypothesis - the strongest conclusion that legitimately can be offered is simply that the data is consistent with the predictions of the hypothesis. Other interpretations of the bacteria population data in Fig. 7 cannot be excluded at this point. Furthermore, the "rebound" in bacterial growth after 2 days is more difficult to interpret without some further knowledge about commensurate C, N, and P levels in the tank. A more controlled experimental plan to monitor bacteria population change contemporaneously with C and N concentration measurements might settle this issue; this experiment will be discussed shortly.</p>
<div class="photo-wrapper"><a class="popup" href="aafeature_album/fig_07.jpg" rel="gallery" title="Figure 7. Bacteria/mL counts from a 175-gallon reef tank (See Fig. 6) over the course of 5 days. The tank was fed 3-4 times/day (PE mysis shrimp, Hikari mysis shrimp, flake food, and pellet food) during the "><img src="aafeature_album/fig_07.jpg/image_preview" alt="fig_07.jpg" class="image-inline" /></a>
<p class="caption"><b>Figure 7.</b> Bacteria/mL counts from a 175-gallon reef tank (See Fig. 6) over the course of 5 days. The tank was fed 3-4 times/day (PE mysis shrimp, Hikari mysis shrimp, flake food, and pellet food) during the "on" part of the daily lighting cycle.</p>
</div>
<p>One concerning point in the experiment described in Fig. 7 involves the role that the UV sterilizer might play in influencing bacterial levels; Are we killing significant numbers of bacteria by UV treatment, thus suppressing population growth? The UV sterilizer in use is a 57W flow-through model from Aqua Ultraviolet. In order to probe this question, we re-ran the "week-in-the-life" experiment with the UV sterilizer off, but the skimmer on continuously, Fig. 8. The observed bacteria/mL values over the course of 5 days fluctuated between 60K and 90K (~ 50% change) for this particular time period. Thus, there did not appear to be any significant bacteria population increase in the water column when the UV sterilizer was off, and it is probably safe to conclude that the UV sterilizer does not have a significant effect on the bacteria population levels in the tank's water column.</p>
<div class="photo-wrapper"><a class="popup" href="aafeature_album/fig_08.jpg" rel="gallery" title="Figure 8. Testing the influence of UV sterilization on bacterial populations in the water of a 175-gallon reef tank. The feeding regimen described with Fig. 7 was used in this experiment as well."><img src="aafeature_album/fig_08.jpg/image_preview" alt="fig_08.jpg" class="image-inline" /></a>
<p class="caption"><b>Figure 8</b>. Testing the influence of UV sterilization on bacterial populations in the water of a 175-gallon reef tank. The feeding regimen described with Fig. 7 was used in this experiment as well.</p>
</div>
<p>A final "week-in-the-life" experiment was conducted on the 55-gallon tank lacking any active filtration, Fig. 9. In addition, this tank had been treated daily with vodka as a carbon source for 6 months prior to water removal. This vodka addition started after the original bacteria population reading reported in Table 1 was taken. Since there was no active bacteria removal mechanism (i.e., skimming), it was not clear, a priori, how the bacteria population might change compared to the pre-vodka value of 590±70 K/mL. In fact, the bacteria population clearly had risen to a significantly higher level than observed in the pre-vodka time period, and now it hovered around 1500-2500K/mL. Once again, significant (~ 60% !) fluctuations in bacteria/mL counts over time appear to be the norm, at least for the two aquaria examined.</p>
<div class="photo-wrapper"><a class="popup" href="aafeature_album/fig_09.jpg" rel="gallery" title="Figure 9. Bacteria/mL counts from a 55-gallon reef tank (See Fig. 6) over the course of 5 days. No protein skimming or GAC filtration was employed on this tank. The tank was fed frozen mysis shrimp daily. In addition, a vodka dosing regime of 4 mL of 80 proof/day (= 3 ppm of C/day) was in place for 6 months."><img src="aafeature_album/fig_09.jpg/image_preview" alt="fig_09.jpg" class="image-inline" /></a>
<p class="caption"><b>Figure 9.</b> Bacteria/mL counts from a 55-gallon reef tank (See Fig. 6) over the course of 5 days. No protein skimming or GAC filtration was employed on this tank. The tank was fed frozen mysis shrimp daily. In addition, a vodka dosing regime of 4 mL of 80 proof/day (= 3 ppm of C/day) was in place for 6 months.</p>
</div>
<p><i>Overall, the major conclusions from these preliminary studies on baseline bacteria counts are</i></p>
<ol>
<li><i>Actively purified aquaria have water column bacteria populations that are approximately 1/10<sup>th</sup> those of authentic healthy reefs.</i></li>
<li><i>Unpurified aquaria have water column bacteria populations that are approximately the same as those of authentic healthy reefs.</i></li>
<li><i>UV sterilization does not significantly influence aquarium water column bacteria populations.</i></li>
<li><i>There is substantial fluctuation (20-50%) in the measured water column bacteria populations over a several-day time scale in aquaria.</i></li>
</ol>
<h3><b>3.2 Carbon dosing (planned and inadvertent) - How does it affect water column bacteria levels?</b></h3>
<p>The data from section <b>3.1</b> established that skimmed/GAC filtered aquaria exhibited baseline bacteria/mL counts in the 70-140K/mL range, whereas unskimmed/GAC-less tanks had approximately 10x that amount. Furthermore, the bacteria level fluctuated on a daily basis as much as 20 - 50%. Now it was time to examine how these baseline bacteria/mL levels responded to deliberate carbon addition. If bacteria population growth is carbon-limited, we might anticipate a significant increase. If it is not, the bacteria population numbers shouldn't scale with carbon dose. In the first trial, we removed 30 gallons of water from the KSF aquarium approximately 17 hours after the last feeding, and about 1 hour after the lights came on. This water sample was placed in an uncovered Rubbermaid tub with continuous powerhead mixing. The fact that the tub was left uncovered might lead to some bacterial introduction via airborne sources; we felt that this configuration best approximated how an aquarist might actually run their aquarium/water change apparatus. Ethanol (EtOH) was dosed as a rate of 0.29 mL/day (= 1 ppm of C/day). Water samples were removed just before each EtOH dose over the course of 5 days. In addition, TOC levels were measured over this time period, and beginning and ending [NO<sub>3</sub>] values were recoded with a Salifert kit. The [PO<sub>4</sub>] level was unmeasurable via the Merck kit (&lt; 0.024 ppm). The results are displayed in Fig. 10.</p>
<p>The initial bacteria/mL population increased from 80K/mL prior to the first EtOH dose up to about 1200K/mL (~ 15x increase) over the course of a day, and maximized at 3900K/mL (~ 50x increase) after 2 days. The bacteria level then receded to about 1500K/mL (~ 19x increase) at the 5-day mark. The TOC level changes started predictably; the initial level = 0.61 ppm, and just after addition (3.5 h mark) of 0.29 mL of EtOH (~ 1 ppm of C), the recorded TOC level elevated to 1.58 ppm. Thus, the addition of EtOH did, in fact, raise the TOC level the expected amount- an internal check on the measurement methodology. The curious and potentially revealing observation came after the 1-day mark; continued additions of EtOH did not lead to increases in the TOC level at day 2 and day 3, and only slight increases (~ 33%) at day 5. The [NO<sub>3</sub>] value decreased from 2.5-5 ppm at the beginning of the experiment to 1-2.5 ppm at day 5. The uncertainty in reading the results of the Salifert kit make drawing any definitive conclusions about nitrate reduction over this experimental time course difficult.</p>
<div class="photo-wrapper"><a class="popup" href="aafeature_album/fig_10.jpg" rel="gallery" title="Figure 10. Changes in bacteria/mL count and TOC levels in a 30-gallon volume of KSF reef tank water (see Fig. 6) upon daily EtOH dosing at a rate of 0.29 mL/day (= 1 ppm of C/day). This water was contained in an uncovered Rubbermaid tub equipped with two powerheads and exposed to fluorescent room lighting."><img src="aafeature_album/fig_10.jpg/image_preview" alt="fig_10.jpg" class="image-inline" /></a>
<p class="caption"><b>Figure 10</b>. Changes in bacteria/mL count and TOC levels in a 30-gallon volume of KSF reef tank water (see Fig. 6) upon daily EtOH dosing at a rate of 0.29 mL/day (= 1 ppm of C/day). This water was contained in an uncovered Rubbermaid tub equipped with two powerheads and exposed to fluorescent room lighting.</p>
</div>
<p>These observations can be interpreted within the context of the carbon dosing hypothesis described earlier, specifically the initial premise that addition of a metabolizable carbon source will lead to an increase in the bacteria population (i.e., bacteria growth is C-limited in aquarium water). Over the first 2 days, bacteria growth does respond as predicted by this hypothesis. In addition, the TOC behavior can be rationalized in light of this hypothesis as well; the initial and subsequent day 2 additions of EtOH (= TOC) are consumed by bacteria, both fueling growth and depleting, or at least stabilizing, the TOC pool. Although the TOC load within intact bacteria will be picked up by the TOC analyzer, it is likely that normal bacterial metabolism will convert a lot of this TOC into CO<sub>2</sub>, which will not be detected by the TOC analysis. However, at the approximately 2-day mark, the dynamic situation in this water volume changes; the bacteria population declines, and the TOC level begins to rise. Perhaps at this time point, the growth in bacteria population is no longer carbon limited, and so further carbon addition doesn't fuel growth. Continuing on in this speculative vein, perhaps in the presence of now surplus carbon, bacterial growth is now limited by the availability of some other nutrient (N or P). In this interpretation, the growth in bacteria population over days 1 and 2 would have depleted enough N and/or P from the water that one (or both) of these nutrients is now deficient from the bacterium's perspective. Of course, from the aquarist's perspective, this depletion of N and/or P in the water column is desirable and in fact is the whole point of the carbon dosing procedure.</p>
<p>We sought to repeat this experiment, given our caveat from above ("observing the expected result of a hypothesis does not validate that hypothesis - the strongest conclusion that legitimately can be offered is simply that the data is consistent with the predictions of the hypothesis"). However, in this second trial, we included a control experiment for testing the importance of the EtOH addition itself to bacteria growth. Specifically, we ran the 30-gallon water sample experiment exactly as described for Trial 1, and the data are reported as the aqua (bacteria/mL) and blue (TOC) lines of Fig. 11. These data follow closely those from Trial 1; an initial rapid bacteria population rise (~ 30x the initial level) over the first day, followed by a slight decline over the next few days. The TOC level's response was consistent with Trial 1 as well; an initial ~ 1 ppm (0.64 ppm to 1.89 ppm) jump upon the first EtOH addition followed by a decline as bacterial growth peaked, and then a slight rise as (perhaps) the bacterial population entered a non-C-limited growth phase.</p>
<p>The real surprise is the red line of Fig. 11; it documents the substantial increase in bacteria/mL for a control water sample that was not treated with EtOH. We simply removed about ½ gallon of water from the tub at the beginning of the experiment, and placed it in an open Tupperware container under fluorescent room lighting. This control portion of tank water was sampled for bacteria content daily just like the EtOH-treated larger tub water sample. Remarkably enough, the bacteria population in this control sample experienced a slower but still significant rise, increasing to a maximum of ~ 27x the original level after 3 days. What is fueling this bacterial growth? Since we have already determined that the bacteria population in this aquarium water sample is carbon limited, it seems reasonable to hypothesize that the Tupperware vessel itself is providing a metabolizable source of carbon! This vessel had been used in various water transfers previously, and it was rinsed with tap water and dried between uses. Could organic residue or bacterial films coat the plastic? Is the plastic itself "digestible" to the water column bacteria? These questions are not answerable at present, but the overall observation that the plastic container itself (or residue on its surface), and not necessarily the EtOH addition, can contribute to a significant increase in water column bacteria population raises some concerns about the interpretation of the results in Fig 10 (remember the caveat).</p>
<div class="photo-wrapper"><a class="popup" href="aafeature_album/fig_11.jpg" rel="gallery" title="Figure 11. A second trial recording changes in bacteria/mL count and TOC levels in a 30-gallon volume of KSF reef tank water (see Fig. 6) upon daily EtOH dosing at a rate of 0.29 mL/day (= 1 ppm of C/day). This water was contained in an uncovered Rubbermaid tub equipped with two powerheads and exposed to fluorescent room lighting. In this experiment, a control water sample was removed and held to the side in a plastic vessel with no EtOH addition."><img src="aafeature_album/fig_11.jpg/image_preview" alt="fig_11.jpg" class="image-inline" /></a>
<p class="caption"><b>Figure 11</b>. A second trial recording changes in bacteria/mL count and TOC levels in a 30-gallon volume of KSF reef tank water (see Fig. 6) upon daily EtOH dosing at a rate of 0.29 mL/day (= 1 ppm of C/day). This water was contained in an uncovered Rubbermaid tub equipped with two powerheads and exposed to fluorescent room lighting. In this experiment, a control water sample was removed and held to the side in a plastic vessel with no EtOH addition.</p>
</div>
<p>These observations prompted a more direct examination of the actual Rubbermaid tub's capacity to contribute to bacterial growth - maybe the Tupperware vessel was unusually contaminated with organics. In this experiment, we removed a 30-gallon water sample from the KSF aquarium and transferred it to the uncovered Rubbermaid tub, as described previously. Water circulation was provided by powerheads but otherwise the system remained undisturbed. Water samples were withdrawn daily for 5 days, and the bacteria/mL counts are displayed in Fig. 12. Clearly, the tub itself (or organic material coating it) is providing a suitable carbon source for bacterial growth. The bacterial population rises some 26x over the initial value over 2.3 days, before declining slightly; a rationale for the burst in bacteria population at day 5 cannot be offered at present.</p>
<p>Do these control experiments negate the carbon dosing hypothesis? No. These results merely suggest that ANY metabolizable carbon source, whether it is unknown organic "stuff" from the surface of a Rubbermaid tub or deliberately added EtOH, will fuel bacterial growth in a C-limited environment such as, apparently, aquarium water. The Rubbermaid tub was cleaned out with tap water and then distilled water between uses. Any solid buildup was removed by rinsing with 1 M HCl followed by distilled water. So, this protocol, which might reflect the typical procedures used by an aquarist for their make-up water or saltwater holding containers, clearly contributes to an organic-rich environment that promotes bacterial growth. This observation may hold some interest to aquarists who believe that they need to seed their tanks with bacteria ("probiotics") as part of a carbon dosing scheme to lower nutrients, and therefore are contemplating purchasing a bacterial "elixir" to accomplish this seeding.</p>
<div class="photo-wrapper"><a class="popup" href="aafeature_album/fig_12.jpg" rel="gallery" title="Figure 12. Bacteria/mL count in a control experiment wherein 30 gallons of KSF tank water was removed and placed in the Rubbermaid tub. A Bubble King mini 160 protein skimmer and two powerheads were included, although the skimmer was not turned on. No EtOH was added; the water sample was exposed to air and fluorescent room lighting."><img src="aafeature_album/fig_12.jpg/image_preview" alt="fig_12.jpg" class="image-inline" /></a>
<p class="caption"><b>Figure 12</b>. Bacteria/mL count in a control experiment wherein 30 gallons of KSF tank water was removed and placed in the Rubbermaid tub. A Bubble King mini 160 protein skimmer and two powerheads were included, although the skimmer was not turned on. No EtOH was added; the water sample was exposed to air and fluorescent room lighting.</p>
</div>
<p>The observation that a plastic container, which is re-used in the course of normal aquarium husbandry, can contribute carbon nutrients to fuel bacterial growth opened up a new line of inquiry; what role might standard water changes that use such containers play in modulating (increasing) bacterial levels in reef tank water? Specifically, can water-change water introduce significant bacteria populations into the aquarium? This question was probed by simply monitoring the bacteria/mL count within a 30-gallon saltwater sample made to 35 ppt salinity by mixing Instant Ocean Reef Crystals salt mix with 30 gallons of distilled water in a loosely sealed Rubbermaid garbage can (different than the tub used for the previous experiments). This container had been used for weekly water changes for the preceding 6 years. Following each water transfer, the container was washed with distilled water and wiped dry prior to mixing the next batch of saltwater. Furthermore, it was periodically cleaned with 1M HCl to remove solid deposits, but in general it carried with it some solid residue on the plastic surface. <span>The data (Fig. 13) unequivocally illustrate that indeed this freshly mixed saltwater is a major source of bacteria introduction into the KSF reef tank</span>. The initial distilled water exhibited negligible bacteria population (~ 10K/mL), but that value increased dramatically to over 900K/mL in just one day after IORC addition. The bacteria/mL value decreased and leveled off at ~ 500K - 600K/mL by day 2. Thus, preparing IORC saltwater under typical aquarium husbandry conditions does lead to a remarkable bacteria load, fueled by some as yet unidentified carbon source, although it should be noted that IORC does include "extra vitamins" that could serve as an organic carbon fuel source. The bacteria population peaked in this experiment at about the 1-day mark, suggesting that addition of this saltwater to an aquarium after one day of mixing, as part of a routine water change, could serve as a inexpensive, simple and functionally useful way to introduce bacteria. This premise was tested next.</p>
<div class="photo-wrapper"><a class="popup" href="aafeature_album/fig_13.jpg" rel="gallery" title="Figure 13. Bacteria/mL count of 30 gallons of saltwater (salinity = 35 ppt) mixed in a 35-gallon Rubbermaid garbage can; the saltwater was prepared from Instant Ocean Reef Crystals (IORC) and distilled water. The container was loosely covered; the water was continuously mixed with a powerhead and heated to 75 oF with a heater."><img src="aafeature_album/fig_13.jpg/image_preview" alt="fig_13.jpg" class="image-inline" /></a>
<p class="caption"><b>Figure 13</b>. Bacteria/mL count of 30 gallons of saltwater (salinity = 35 ppt) mixed in a 35-gallon Rubbermaid garbage can; the saltwater was prepared from Instant Ocean Reef Crystals (IORC) and distilled water. The container was loosely covered; the water was continuously mixed with a powerhead and heated to 75 <sup>o</sup>F with a heater.</p>
</div>
<p>Does adding bacteria-rich saltwater to a reef aquarium increase its bacterial load? This question was probed by the experiment described in Fig. 14. As part of routine weekly tank maintenance, 30 gallons of water was removed from the KSF aquarium, and immediately 30 gallons of IORC saltwater (bacteria count = 280K/mL in this instance) was added. The KSF tank bacteria/mL count was monitored daily over the course of a week; midway through this experiment, a second smaller water change with Instant Ocean saltwater (bacteria count not measured) was conducted. The active filtration (skimmer/GAC/UV) was on throughout the week-long time course. As illustrated in Fig. 14, the tank's bacteria population did experience a sharp increase upon addition of the bacteria-rich water-change saltwater; after 2 hours post IORC saltwater addition, the count increased by 1.7x. Likewise, by 1 day post IO saltwater addition, the count had enlarged again, also by 1.7x. So, addition of bacteria-rich saltwater does indeed lead to an observable and significant increase in the tank's bacteria population. In fact the dilution math works out perfectly and serves as an internal check of the counting methodology, much like it did with the TOC analysis of Figs. 10 and 11. Specifically, the entire tank water volume is 168 gallons. Adding 30 gallons of 280K bacteria/mL to 138 gallons of tank water (total volume - amount remove during water change) of 61K bacteria/mL should lead to a predicted final 168 gallon volume at 100K bacteria/mL - at 2 hours after the water change, the bacteria/mL was measured at 101±5K/mL.</p>
<div class="photo-wrapper"><a class="popup" href="aafeature_album/fig_14.jpg" rel="gallery" title="Figure 14. Bacteria/mL count of KSF's reef tank after water changes of 17% (Instant Ocean Reef Crystals) and then 7% (Instant Ocean)."><img src="aafeature_album/fig_14.jpg/image_preview" alt="fig_14.jpg" class="image-inline" /></a>
<p class="caption"><b>Figure 14</b>. Bacteria/mL count of KSF's reef tank after water changes of 17% (Instant Ocean Reef Crystals) and then 7% (Instant Ocean).</p>
</div>
<p>The more interesting observation is what happens <span>after</span> the bolus of bacteria is added with the water change. After both water changes, the ~ 1.7x increase in bacteria count diminished back to a "baseline" value for the KSF aquarium of ~ 60-70K/mL within one day. The bacterial population at any instant will be determined by the interplay of population-increasing events (direct addition of bacteria and growth, if appropriate and sufficient nutrients are present) and population-decreasing events, such as death and predation by higher organisms in the food chain. The fact that a rapid increase in bacteria is equally rapidly "absorbed" so that an equilibrium level is maintained speaks to the dynamic nature of these events. The larger microfauna and sessile filter feeders seem to be likely candidates for bacteria removal culprits that in concert balance out any induced spike in population. The level of bacteria addition that might overwhelm this balance is not known, but the fact that a biological "mechanism" appears to be in place in order to return population swings to an equilibrium level poses an interesting problem for the carbon dosing hypothesis; perhaps higher bacteria levels cannot be sustained in an authentic reef tank even upon carbon dosing, if the bacteria consumption mechanisms increase in kind. In this scenario, nutrient "export" would occur, at least in part, via bacteria consumption by endogenous organisms and not just by physical removal from the water via protein skimming; that is, some of the nutrients would stay in the system, albeit in new trophic levels. This issue of water column bacteria population increase via carbon dosing in an authentic, thriving reef tank can be probed directly, and the results of that experiment are described below. First, however, there is one more question on the topic of (inadvertent) bacteria addition via water changes that should be addressed; do the bacteria come from the salt mix itself, or are they introduced via the (non-sterile) mixing vessel?</p>
<p>This question was examined by removing the container as a source of bacterial contamination and/or food. Specifically, saltwater mixes (to 35 ppt salinity) were prepared from RO/DI/0.2 uM-filtered water in sterile plastic Erlenmeyer flasks (Nalgene 500 mL sterile disposable PETG flask). Six salt mixes were examined: Instant Ocean Reef Crystals (IORC), Instant Ocean (IO), Tropic Marin, Oceanic, Red Sea, and Kent, and the bacteria population in each flask was monitored over 5 days. The flasks were all sealed and covered with aluminum foil to avoid exposure to standard fluorescent room lighting. A control flask containing only RO/DI/0.2 uM-filtered water was included, and the results are depicted in Fig. 15.</p>
<div class="photo-wrapper"><a class="popup" href="aafeature_album/fig_15.jpg" rel="gallery" title="Figure 15. Bacteria/mL count of six different brands of salt mix made up to 35 ppt salinity using RO/DI/0.2 uM filtered water in capped and foil-wrapped sterile flasks."><img src="aafeature_album/fig_15.jpg/image_preview" alt="fig_15.jpg" class="image-inline" /></a>
<p class="caption"><b>Figure 15</b>. Bacteria/mL count of six different brands of salt mix made up to 35 ppt salinity using RO/DI/0.2 uM filtered water in capped and foil-wrapped sterile flasks.</p>
</div>
<p>Five of the six salt mixes (Red Sea excepted) displayed little bacterial contamination beyond the pure water control, and the bacteria populations fluctuated but did not consistently rise over time as might be expected if sufficient nutrients were available (cf. Fig. 13). Thus, there is no reason to suspect that any of these five salt mixes themselves contribute to the high levels of bacteria in the make-up saltwater of Fig. 13. Red Sea salt, on the other hand, does appear to bring with it a not insignificant bacterial load. Once again, there was little increase over 5 days, indicating that sufficient nutrients for growth were not available under these "sterile" conditions. What is so special about Red Sea salt? This salt, uniquely among the six mixes tested, is made, at least partially, by drying authentic seawater. Thus, it appears to retain some viable bacteria from the drying process. The other five salt mixes are prepared from mixing strictly chemical sources of the components. Overall, it appears justified to conclude that the significant populations of bacteria in mixed saltwater are a result of container contamination and not salt mix introduction per se.</p>
<p>The final question of merit in testing the "carbon addition" part of the carbon dosing hypothesis was alluded to earlier; what happens in authentic reef tank water over time upon deliberate addition of a carbon source? Will the natural bacterial population control mechanisms handle the induced population growth so that the normal equilibrium level of bacteria is maintained? Or, will these mechanisms be overwhelmed and therefore will the bacteria population rise? To probe this key point, we adopted the carbon dosing protocol described by Walton and Bjornson (Walton, 2008). Specifically, we added pure EtOH to the KSF 175 gallon reef tank at the following schedule:</p>
<p>Day 1-4: 0.28 mL (~ 0.l7 ppm of C in the tank volume of the KSF aquarium)</p>
<p>Day 5-8: 0.58 mL (~ 0.35 ppm of C)</p>
<p>Day 9-15: 0.78 mL (~ 0.47 ppm of C)</p>
<p>Day 16-21: 0.98 mL (~ 0.60 ppm of C)</p>
<p>Day 22-27: 1.18 mL (~ 0.71 ppm of C)</p>
<p>Day 28-30: 1.38 mL (~ 0.84 ppm of C)</p>
<p>The EtOH was adding in the early morning, prior to lights on, and approximately 17 hours after the last tank feeding. Water samples for bacteria count analysis were removed just prior to the EtOH addition. Periodic measurements of [NO<sub>3</sub>] via the Salifert kit were conducted also. During this month-long experiment, the tank was maintained under its normal husbandry conditions; a weekly 30 gallon (17%) water change with IORC saltwater (standing for 1 week prior to use), biweekly change of GAC and GFO, continuous protein skimming (H&amp;S 200-1260), UV sterilization, light cycle of 8 hours on/16 hours off. The results of this experiment are illustrated in Fig. 16.</p>
<div class="photo-wrapper"><a class="popup" href="aafeature_album/fig_16.jpg" rel="gallery" title="Figure 16. Bacteria/mL count and [NO3] in the KSF reef tank over 30 days with incrementally increasing EtOH dosing."><img src="aafeature_album/fig_16.jpg/image_preview" alt="fig_16.jpg" class="image-inline" /></a>
<p class="caption"><b>Figure 16</b>. Bacteria/mL count and [NO<sub>3</sub>] in the KSF reef tank over 30 days with incrementally increasing EtOH dosing.</p>
</div>
<p>The interpretation of this experiment is clouded somewhat by a complicated backstory. This experiment as described above was planned to proceed over 30 days. Unfortunately, at the 20-day time point, the Coulter XL cytometer broke, and it took several weeks for the instrument to be repaired. The data for the three weeks of samples were compromised, and the entire experiment had to be re-run. The KSF 175 gallon aquarium was maintained as described above for 2 more months without EtOH addition before the dosing experiment was restarted, following the protocol described above, and the data displayed in Fig. 16 came from the second complete run.</p>
<p>However, between approximately the 2<sup>nd</sup> week of the initial EtOH addition experiment and the start of the second EtOH experiment about 9 weeks later, two significant changes in the KSF aquarium were observed. Cyanobacteria made an unwelcome appearance after vanishing from the KSF aquarium as a result of a Chemiclean treatment 6 months prior. The cyanobacteria built up to a significant coating on the sand bed and rockwork by the time the second EtOH addition experiment ended at the 30-day mark. In addition, four larger and relatively old <i>Acropora</i> coral colonies developed white "dead" spots near their bases that gradually spread upward, eventually consuming the corals. It is not possible to establish whether causality or coincidence is at work here. However, the bacteria level at the t = 0 starting point for the second EtOH dosing regimen, ~ 190K bacteria/mL, is significantly higher that the steady-state bacteria populations in the KSF tank measured over the preceding 9 months (~ 70 - 100k bacteria/mL). Water blank controls and examination of a water sample from the PSU HUB tank (see Table 1) ascertained that the now repaired Coulter XL cytometer was still giving reliable readings. It is possible that the now higher bacteria/mL starting point reflects the presence of lots of cyanobacteria in the water column, absent in all of the earlier readings. After the 30-day EtOH dosing experiment of Fig. 16 ended, the KSF tank was treated with Chemiclean as per label directions to remove the cyanobacteria, and then a 90% water replacement (five 60-gallon (34%) water changes conducted over 48 hrs) was performed. Ten days after the completion of this water replacement, the bacteria count of the KSF tank registered at 97000 ± 3000 bacteria/mL, just about where it was prior to the EtOH dosing campaign. The affected corals, unfortunately, did not recover, but frags clipped from the living branches subsequently did thrive.</p>
<p>Nevertheless, even given the elevated starting bacteria count, it is clear that the measurable bacteria population in the water column of the KSF 175 gallon aquarium did not undergo the rapid increase upon EtOH dosing that was observed with the removed 30-gallon water samples, Figs. 10 and 11. In addition, there was no detectable trend in [NO<sub>3</sub>] levels; the value hovered around the 2-5 ppm level throughput. The bacteria population observation is a reminder that the detected bacteria/mL count really reflects a dynamic equilibrium between bacteria introduction (primarily via growth) and bacteria removal by death/predation. In the case of the 30-gallon water samples removed from the tank and placed in a Rubbermaid tub, it seems reasonable to posit that since the sedentary filter feeders (= direct bacteria consumers, or consumers of organisms that consume bacteria; i.e., the "predators") were no longer present, the observed bacteria population increased dramatically upon addition of a fuel source. With the 175 gallon reef tank of Fig. 16, however, the bacteria consumers are still present, and in fact may respond to an EtOH-fueled bacteria population increase by increasing their own numbers as well. The most immediate bacteria consumers, the larger microfauna in the water column, may therefore experience an increase in population also, although our water examination method would not have picked up this increase. Eventually, this carbon fuel (= EtOH) may work its way up the food chain until sedentary filter feeders in the tank (corals, sponges, fan worms, etc) consume it, thereby removing it from the water column (but not from the tank!). Thus, we speculate that the bacteria population may not show evidence of an increase upon EtOH dosing, as any increase is counterbalanced by a corresponding increase in removal via predation. Some of these larger water column microfauna will be removed via skimming*, and so the overall plan of nutrient export will be realized. However, some of the introduced carbon nutrient is likely to be retained within the sedentary filter feeding livestock, and hence it will remain within the overall tank ecosystem. Presumably, as long as these end-consumers live and grow as a result of the added carbon nutrients, they pose no immediate risk for contributing to the waste nutrient level of the aquarium.</p>
<p>* In unpublished results, examination of skimmate from the KSF 175 gallon aquarium, removed by the H&amp;S 200 skimmer, via high-resolution optical microscopy revealed the presence of many examples of microfauna of the diatom and foraminifera families. It is likely that members of these families, at least within the foraminifera, do account for some bacterial predation. We thank Jamie Kunkle of the Pennsylvania State University Materials Research Lab for providing these photographs.</p>
<p><i>Overall, the major conclusions from these carbon dosing experiments are</i></p>
<ol>
<li><i>Addition of a carbon source (EtOH or uncharacterized organic "gunk") to reef tank water removed from a reef environment leads to dramatic increases in the water column bacteria load.</i></li>
<li><i>Addition of a carbon source (EtOH) to an active reef tank via a recommended schedule does not lead to any measurable increase in water column bacteria load.</i></li>
<li><i>Fresh 1-day old saltwater prepared in a non-sterile environment has a bacteria load approximately 10x that of skimmed reef tank water.</i></li>
</ol>
<h3><b>3.3 Bacteria removal via mechanical filtration - how effective?</b></h3>
<p>The third and final research topic under the general heading of modulating bacteria populations in aquarium water focuses on the question of mechanical bacteria export, a necessary requirement for the overarching goal of carbon dosing-based nutrient depletion. We have already seen circumstantial evidence for bacteria removal from the water column by predation, but that process does not remove the bacterium's nutrient content from the closed aquarium system. For that function, some type of mechanical filtration that specifically targets bacteria for removal is required. The carbon dosing hypothesis cites protein skimming as the mechanism for physical removal of bacteria, with their nutrient load, from the aquarium water. Note that skimming, or any type of mechanical filtration, can only remove bacteria that are in the water column; bacterial biofilms on surfaces can only be cleared if they are dislodged and enter the water column. Therefore, we set out to examine the capability of a protein skimmer, in our case the Bubble King mini 160, to scrub authentic aquarium water of its bacterial load. There are reports in the literature (Brambilla, 2008; Suzuki, 2008) that document the ability of foam fractionation (= protein skimming) to clear bacteria from both coastal seawater and also a closed circulation fish rearing system. In the former case (Suzuki, 2008), a coastal seawater sample from a fishing port near Miyazaki Japan was continuously skimmed with a DYI protein skimmer, and the removal of different types of water column bacteria, reported as efficiency of removal (100% = complete removal of bacteria) follows: <i>Enterococci</i>, <i>Vibrio</i> and <i>Salmonella</i>, 55-60%; Fecal coliform, 5%. Thus, it appears that not all types of bacteria respond identically to bubble-based extraction. The latter experiment (Brambilla, 2008) documented that in a closed, recirculating, fish-only system, water column bacteria populations could be reduced from 32-88% by skimming, depending upon the experimental details. We interpreted these two independent sets of results as providing strong precedent for the expectation that we would observe similar behavior when skimming aquarium water. In addition to protein skimming, many aquarists utilize Granular Activated Carbon (GAC) as an active filtration medium to clear TOC from aquarium water, and so we wondered if GAC might also contribute to the mechanical removal of bacteria from aquarium water as well.</p>
<p>The question of GAC-based bacterial water remediation was studied by removing 5 gallons of KSF tank water that had been prepared as follows; the KSF tank's H&amp;S 200 skimmer was turned off for 42 hours before water removal, a 17% (30 gallon) water change with IORC saltwater was conducted 24 hours before water removal, and the tank was fed 3.5 hours before water removal. This 5 gallon water sample was placed in a plastic container and, mindful of the rapid growth of the bacteria population in non-sterile plastic containers, this sample was immediately recirculated through a Phosban reactor containing 150 gm of HC2 GAC. Prior to starting the Phosban reactor pump, five 25 mL water samples were removed from the 5-gallon bucket and placed in sterile centrifuge tubes, capped, and set aside. These five tubes serve as a control for bacteria growth; at 30-minute time intervals during the GAC run, 0.5 mL of 37% formaldehyde solution was added to each tube in succession, and these control tubes were immediately frozen pending later analysis. These tubes are not a perfect control, because they do not account for plastic-container-induced bacteria growth, but they do serve as a check against overall contamination. Samples (25 mL, worked up with formaldehyde as described in the General Experimental) were removed periodically from the 5 gallon volume during the course of the GAC run. An entire experimental time period of 120 minutes was chosen to minimize the opportunity for plastic container-fueled bacteria growth, which might mask detection of any GAC-induced depletion.</p>
<p>The data are displayed in Fig. 17. Clearly, there is no evidence that supports the notion that GAC filtration can serve as an effective method for bacteria removal from the water column. Rather than going down, the bacteria levels in the water sample rise slightly (~ 1.4x compared to the starting point) and then decline. This behavior is no different from what might be expected if the container's surface organic load fueled some bacteria growth, at least until the carbon source was consumed. The control samples also rose a little (1.3x) over the same 2-hour time period, a reminder that some small bacterial growth is almost unavoidable in standing water samples. Thus, GAC does not seem to be an effect method for removing bacteria from the water column of reef tanks.</p>
<div class="photo-wrapper"><a class="popup" href="aafeature_album/fig_17.jpg" rel="gallery" title="Figure 17. Bacteria/mL count within a 5 gallon KSF tank water sample that was subjected to filtration with 150 gm of HC2 Granular Activated Carbon in a Phosban reactor. The water sample was removed from the KSF tank 48 hours after the KSF tank skimmer was turned off, 24 hours after a 17% water change, and 3.5 hours after feeding the tank."><img src="aafeature_album/fig_17.jpg/image_preview" alt="fig_17.jpg" class="image-inline" /></a>
<p class="caption"><b>Figure 17</b>. Bacteria/mL count within a 5 gallon KSF tank water sample that was subjected to filtration with 150 gm of HC2 Granular Activated Carbon in a Phosban reactor. The water sample was removed from the KSF tank 48 hours after the KSF tank skimmer was turned off, 24 hours after a 17% water change, and 3.5 hours after feeding the tank.</p>
</div>
<p>We next turned our focus to the larger question of skimmer-based bacteria depletion of reef tank water. As in the GAC experiment, we first "prepared" the KSF tank water sample by (a) turning off the tank skimmer and GAC filter for 42 hours prior to water removal, and (b) feeding the tank 3.5 hours prior to water removal. In this instance, the usual 30 gallon water sample was removed from the KSF tank and placed in the Rubbermaid tub containing the Bubble King mini 160 protein skimmer; water circulation was provided by two powerheads. Immediately, five 25 mL control water samples were removed and set aside; these control tubes were dosed in sequence with 0.5 mL of 37% formaldehyde solution at 30-minute time intervals during the skimmer run and frozen for later analysis, as described above. The skimmer was turned on, and the riser tube was adjusted in order to keep the foam height within the boundaries recommended by the manufacturer. 25 mL water samples were removed periodically over 120 minutes and worked up as described above. The data resulting from this study are displayed in Fig. 18.</p>
<div class="photo-wrapper"><a class="popup" href="aafeature_album/fig_18.jpg" rel="gallery" title="Figure 18. Bacteria/mL count within a 30 gallon water sample removed from the KSF tank and subjected to immediate skimming with a Bubble King mini 160 protein skimmer. The water sample was removed from the KSF aquarium ~ 3.5 hours after feeding the tank; the KSF tank's H&S 200 skimmer and GAC filter were off for 42 hours prior to water removal. The Rubbermaid tub was loosely covered with aluminum foil throughout the experiment."><img src="aafeature_album/fig_18.jpg/image_preview" alt="fig_18.jpg" class="image-inline" /></a>
<p class="caption"><b>Figure 18</b>. Bacteria/mL count within a 30 gallon water sample removed from the KSF tank and subjected to immediate skimming with a Bubble King mini 160 protein skimmer. The water sample was removed from the KSF aquarium ~ 3.5 hours after feeding the tank; the KSF tank's H&amp;S 200 skimmer and GAC filter were off for 42 hours prior to water removal. The Rubbermaid tub was loosely covered with aluminum foil throughout the experiment.</p>
</div>
<p>Inspection of these data reveal that, like the GAC experiment, there is no evidence which suggests that this skimmer was able to remove bacteria from this water sample over the 2-hour time period of the experiment. Both the skimmed water samples (pink) and the control samples (aqua) fluctuate in their bacteria/mL values over a fairly narrow range (75 - 90K/mL) without any meaningful trend emerging. Since the skimmed water sample exhibited the same behavior as the unskimmed control water samples, it is not possible to draw any further conclusions from this experiment. These results were quite unsettling; why wasn't the skimmer stripping the aquarium water of at least some of its bacterial load? Is the problem with the skimmer, or is the problem with the bacteria?</p>
<p>One approach to probing this puzzling point is to use aquarium water that had been "artificially" spiked with bacteria; perhaps with a much greater bacterial load, the skimmer will function as desired. Towards this end, we took advantage of the previous observation that allowing aquarium water to sit in a plastic container of several days leads to a dramatic increase in the water's bacteria population. We removed a 30 gallon sample of KSF tank water, prepared as described previously, and placed it in the uncovered Rubbermaid tub with the skimmer present but off, and the two powerheads on for circulation. After 5 days, the tub was covered with foil, the skimmer was turned on, and the skimmer experiment was run for 120 minutes. In addition, the usual control samples were removed at the beginning of the skimmer run. In this instance, the water's bacteria population had built up to approximately 7000K/mL, much higher than the 75K/mL starting point of the experiment described in Fig. 18. The results of this "doped" water run are given in Fig. 19.</p>
<div class="photo-wrapper"><a class="popup" href="aafeature_album/fig_19.jpg" rel="gallery" title="Figure 19. Bacteria/mL count within a 30 gallon water sample removed from the KSF tank and held in a Rubbermaid tub for five days prior to being subjected to skimming with a Bubble King mini 160 protein skimmer. The water sample was removed from the KSF aquarium ~ 3.5 hours after feeding the tank; the KSF tank's H&S 200 skimmer and GAC filter were off for 42 hours prior to water removal. The water sample in the Rubbermaid tub was exposed to fluorescent room lighting for the 5-day settling period, but loosely covered with aluminum foil throughout the skimmer run."><img src="aafeature_album/fig_19.jpg/image_preview" alt="fig_19.jpg" class="image-inline" /></a>
<p class="caption"><b>Figure 19</b>. Bacteria/mL count within a 30 gallon water sample removed from the KSF tank and held in a Rubbermaid tub for five days prior to being subjected to skimming with a Bubble King mini 160 protein skimmer. The water sample was removed from the KSF aquarium ~ 3.5 hours after feeding the tank; the KSF tank's H&amp;S 200 skimmer and GAC filter were off for 42 hours prior to water removal. The water sample in the Rubbermaid tub was exposed to fluorescent room lighting for the 5-day settling period, but loosely covered with aluminum foil throughout the skimmer run.</p>
</div>
<p>This experiment does demonstrate that the Bubble King mini 160 skimmer is effective at removing bacteria from the modified aquarium water sample, at least to the extent of approximately 39% over 2 hours. The control water samples remained fairly constant in comparison. Thus, for the first time, we can conclude that skimming does clear some bacteria from the water column of a reef tank. However, the artificial nature of this experiment, with its induced high bacteria population, raises the important question of its relevance to bacteria removal from an untreated reef tank water sample. Nevertheless, the bubble-based mechanism of protein skimming itself is demonstrated to be capable of bacteria export, and so that component of the Fig. 18 puzzle is exonerated.</p>
<p>How can we design an experiment that probes the question of skimmer-based bacterial export in a more realistic reef tank-like setting? One possibility is to rely on our EtOH dosing regimen to provide the necessary "bacteria-rich" but otherwise realistic aquarium water sample. This idea was pursued by removing a 30 gallon water sample from the KSF tank, prepared as described above, and placing it in the Rubbermaid tub with circulation provided by two powerheads. The Bubble King skimmer was in the water, but not running. EtOH (0.29 mL, ~ 1 ppm of C) was added daily for three days. At the 3-day mark, the skimmer was activated, and water samples were removed and worked up as described previously. In addition, the TOC levels of this water sample were monitored during the 120-minute skimming run. The results are presented in Fig. 20.</p>
<div class="photo-wrapper"><a class="popup" href="aafeature_album/fig_20.jpg" rel="gallery" title="Figure 20. Bacteria/mL count and TOC levels within a 30 gallon water sample removed from the KSF tank, held in a Rubbermaid tub for three days with daily dosing of 0.29 mL EtOH (~ 1 ppm of C) and then subjected to skimming with a Bubble King mini 160 protein skimmer. The water sample was removed from the KSF aquarium ~ 3.5 hours after feeding the tank; the KSF tank's H&S 200 skimmer and GAC filter were off for 42 hours prior to water removal. The water sample in the Rubbermaid tub was exposed to fluorescent room lighting for the 3-day EtOH dosing period, but loosely covered with aluminum foil throughout the skimmer run."><img src="aafeature_album/fig_20.jpg/image_preview" alt="fig_20.jpg" class="image-inline" /></a>
<p class="caption"><b>Figure 20</b>. Bacteria/mL count and TOC levels within a 30 gallon water sample removed from the KSF tank, held in a Rubbermaid tub for three days with daily dosing of 0.29 mL EtOH (~ 1 ppm of C) and then subjected to skimming with a Bubble King mini 160 protein skimmer. The water sample was removed from the KSF aquarium ~ 3.5 hours after feeding the tank; the KSF tank's H&amp;S 200 skimmer and GAC filter were off for 42 hours prior to water removal. The water sample in the Rubbermaid tub was exposed to fluorescent room lighting for the 3-day EtOH dosing period, but loosely covered with aluminum foil throughout the skimmer run.</p>
</div>
<p>The starting bacteria population in this instance, ~ 2300K/mL, was lower than that generated by simply using the tub itself (or its organic surface coating) as a source of bacterial growth nutrients (cf. Fig. 19). The reason for this difference is not clear. Nevertheless, the bacteria depletion profile generated in this experiment (pink line in Fig. 20) is quite similar to that one observed in the experiment of Fig. 19, although the overall % decrease in bacteria population is a little less (28%, vs. 39% in Fig. 19). The non-skimmed control water sample remained relatively constant in its bacteria population over the 2-hour course of this experiment. The TOC level in the water sample is depleted by skimming as well, dropping from about 2.5 ppm down to about 2.0 ppm (~ 25% decrease) over the 2-hour skimmer run. Both the bacteria population and the TOC level appear to have reached their "floors"; no further removal of each was detected over the last third of the run. Once again, we have confirmed that if the aquarium water sample is "spiked" with bacteria, skimmer-based removal is observed. However, the results of both of these experiments (Figs. 19 and 20) <span>indicate that only a component of the entire water column bacteria cohort appears to be susceptible to skimmer-based removal</span>.</p>
<p>One last attempt to detect skimmer-based removal of bacteria from KSF aquarium water that is not too perturbed was pursued, Fig. 21. The observation (Fig. 14) that IORC water-change water introduces some bacteria into the aquarium served as the catalyst for this last skimmer run. In this instance, the H&amp;S skimmer and GAC filter were turned off 48 hours prior to water removal. Then, two 30-gallon water changes were conducted on two successive days just before the experimental water sample was removed. Thus, the aquarium water's bacteria population should have been elevated relative to its equilibrium (and unskimmable) levels, but not to an artificially high value like those that attended either the EtOH dosing run (Fig. 20) or the tub contamination run (Fig. 19). This water sample was skimmed immediately upon transfer into the Rubbermaid tub. As it turned out, the initial bacteria population level was not particularly high, around 90K/mL. Over the first 10 minutes of skimmer operation, this value increased to about 100K/mL, presumably as a consequence of added bacteria from the tub/skimmer/powerhead setup. Despite this initial surprising data point, the remaining data set taken over the next 110 minutes followed the expected course, and the bacteria level depleted overall by about 29%. The unskimmed control water sample did not show any notable fluctuations in its bacteria content over the course of the experiment. For the first time, we have obtained evidence that protein skimming will deplete some bacteria from authentic aquarium water that has bacteria/mL levels not so far out of line from an unperturbed system (cf. Table 1). Nevertheless, one message comes through clearly from all of these experiments, regardless of the starting bacteria/mL level; <span>only a minor fraction (~ 28 - 39%) of the bacteria present are susceptible to extraction by bubbles.</span></p>
<div class="photo-wrapper"><a class="popup" href="aafeature_album/fig_21.jpg" rel="gallery" title="Figure 21. Bacteria/mL count within a 30 gallon water sample removed from the KSF tank and subjected to skimming with a Bubble King mini 160 protein skimmer. The KSF tank was subjected to two 30-gallon water changes using IORC saltwater (6-days sitting in the water container and 1-day sitting in the water container) on the two successive days prior to water sample removal. The water sample was removed from the KSF aquarium ~ 3.5 hours after feeding the tank; the KSF tank's H&S 200 skimmer and GAC filter were off for 48 hours prior to water removal. The water sample in the Rubbermaid tub was loosely covered with aluminum foil throughout the skimmer run."><img src="aafeature_album/fig_21.jpg/image_preview" alt="fig_21.jpg" class="image-inline" /></a>
<p class="caption"><b>Figure 21</b>. Bacteria/mL count within a 30 gallon water sample removed from the KSF tank and subjected to skimming with a Bubble King mini 160 protein skimmer. The KSF tank was subjected to two 30-gallon water changes using IORC saltwater (6-days sitting in the water container and 1-day sitting in the water container) on the two successive days prior to water sample removal. The water sample was removed from the KSF aquarium ~ 3.5 hours after feeding the tank; the KSF tank's H&amp;S 200 skimmer and GAC filter were off for 48 hours prior to water removal. The water sample in the Rubbermaid tub was loosely covered with aluminum foil throughout the skimmer run.</p>
</div>
<p>Finally, we wondered how the skimming results with these "captured" water samples, i.e., samples removed from an authentic reef setting and thus lacking all of the dynamic bacteria growth/removal mechanisms present in a reef tank, might compare to the results obtained upon skimming an actual functioning reef tank. Of course, such a tank cannot be pre-skimmed or we will be back to where we started with Fig. 18. The SJ 55 gallon tank fits this requirement (see Fig. 6); it has a healthy, thriving population of fish, soft corals, invertebrates, etc., but this tank has not been skimmed or treated with GAC filtration for approximately six months. It has, however, been subjected to daily vodka additions as described in the discussion of Table 1 and Fig. 9. The Bubble King mini 160 protein skimmer was placed in the sump of this aquarium system, turned on, and adjusted as described above. Water samples (25 mL) were removed periodically over 24 hours, dosed with 0.5 mL of 37% formaldehyde, and frozen for later analysis. No control samples were utilized in this experiment. The results are depicted in Fig 22.</p>
<div class="photo-wrapper"><a class="popup" href="aafeature_album/fig_22.jpg" rel="gallery" title="Figure 22. Bacteria/mL count within the water column of a 55 gallon thriving reef tank upon skimming with a Bubble King mini 160 protein skimmer. This tank has been treated with EtOH daily for 6 months but it does not employ either a skimmer or a GAC filter."><img src="aafeature_album/fig_22.jpg/image_preview" alt="fig_22.jpg" class="image-inline" /></a>
<p class="caption"><b>Figure 22.</b> Bacteria/mL count within the water column of a 55 gallon thriving reef tank upon skimming with a Bubble King mini 160 protein skimmer. This tank has been treated with EtOH daily for 6 months but it does not employ either a skimmer or a GAC filter.</p>
</div>
<p>Clearly, the Bubble King skimmer has performed effectively in dropping the bacteria load of this naturally bacteria-rich tank water by approximately 37%. In fact, this decrease was recorded by the 8-hour mark, and even after 2 hours (the time period of the KSF tank water skimming experiments), the bacteria population decrease was significant; ~ 22%. It should be noted that no late rise in the bacteria population was seen; the skimmer was effective at keeping the level at some baseline value (~ 1500K/mL) for this tank. Interestingly, even thought the bacteria population starting points in the KSF tank water skimming experiments (Figs. 19, 20, and 21) and the SJ 55 skimming experiment were very different, in all cases, only about 28-39% of the original bacteria were removed before the data "flatlined".</p>
<p>It is likely a significant observation that there is a floor in aquarium water bacteria populations that skimming will not breach. Perhaps in both water sources, the SJ 55 naïve tank water and the KSF modified (or not) tank water, there appears to be two functionally distinct populations of bacteria; one that is susceptible to bubble-based removal, and one that is not. What is this functional difference, as far as the skimmer is concerned? An earlier publication describes the limitations of bubble-based mechanisms in scrubbing TOC from aquarium water (Feldman, 2009). The argument forwarded in that case may very well apply here as well, Fig. 23. It is plausible that the requirement for hydrophobic patches on particles (i.e., bacteria, TOC molecules or clusters; refer to Bacterial Surface Charge and Protein Skimming, Section <b>1.2</b> above) that must be met for successful bubble-based extraction may only apply to some but not all of the aquarium water column bacteria (approximately 28-39%, by our studies). Thus, there may be some discrimination by the skimmer based upon bacteria surface properties. In addition, some but not all bacteria form multicellular clumps (flocs) that may be susceptible to foam-based extraction based upon simple buoyancy and not bubble-surface chemistry; once again, this physical process constitutes a basis for selecting between different bacteria types. So, the bottom line appears to be that <i>some but not all bacteria can be removed by protein skimming</i>.</p>
<div class="photo-wrapper"><a class="popup" href="aafeature_album/fig_23.jpg" rel="gallery" title="Figure 23. Speculation on why only some but not all of the bacteria present in reef aquaria water is removed by protein skimming (adapted form Feldman, 2009)."><img src="aafeature_album/fig_23.jpg/image_preview" alt="fig_23.jpg" class="image-inline" /></a>
<p class="caption"><b>Figure 23.</b> Speculation on why only some but not all of the bacteria present in reef aquaria water is removed by protein skimming (adapted from Feldman, 2009).</p>
</div>
<p><i>Overall, the major conclusions from these water column bacteria removal experiments are</i></p>
<ol>
<li><i>GAC (Granular Activated Carbon) filtration does not remove bacteria from the water column.</i></li>
<li><i>Protein skimming (bubbles) removes approximately 30 - 40% of the bacteria in the water column of carbon-treated or organic rich water, but the remainder is not susceptible to bubble-based removal.</i></li>
<li><i>Steady state bacteria populations in skimmed reef tank water are not subject to further skimmer-based bacteria removal - there is a baseline value that the skimmer will not go below.</i></li>
</ol>
<h2><b>4.</b> <b>Conclusions</b></h2>
<p>The preliminary studies described herein document, for the first time, the modulation of water column bacteria population in reef tank water as a consequence of either (a) carbon source addition or (b) mechanical filtration (GAC, skimming). This information bears on the Carbon Dosing hypothesis for nutrient removal in marine aquaria.</p>
<p>Aquaria subjected to active filtration via skimming present water column bacteria populations that are approximately 1/10 of those observed on natural reefs. The consequences of this disparity on the long-term health of the tank's livestock are not known. How do reef tank organisms adapt to such a bacteria-deficient environment? Is the whole food web in an aquarium perturbed, or are there compensatory mechanisms that maintain an appropriate energy transduction through all of the trophic levels? Is "old tank syndrome" related to possible nutritional deficiencies stemming from this bacteria "gap"? Alternatively, could "old tank syndrome" be symptomatic of a gradual decrease of bacterial diversity as a consequence of selective skimmer-based removal of only bubble-susceptible bacteria? At present, it is not possible to go beyond speculation on these points - further research is needed.</p>
<p>On the other hand, our studies have shown that bacterial growth appears to be carbon limited in reef aquarium water. However, there is a demonstrable difference between reef tank water in an active reef tank, and reef tank water removed from the tank. In the latter case, bacteria consumers are largely absent, and so fueling bacteria growth via carbon addition translates to rapid and large increases in bacteria population. In an active reef tank, however, this population increase is not manifest, presumably because active predation keeps the overall level in check. Thus, the highly dynamic nature of bacteria populations in the water column of reef aquaria is highlighted by these studies. From a different perspective, the bacteria population in a reef tank seems to act as a buffer to help dissipate the otherwise potentially serious negative consequences of (inadvertent?) tank pollution via rapid carbon addition, at least perhaps up to a saturation point.</p>
<p>Finally, mechanical filtration in the form of skimming but not GAC does provide an effective means of bacteria export, at least up to a point. It appears likely that some types of bacteria are indeed "skimmable", but others are not. Thus, skimming inadvertently provides severe (?) evolutionary pressure to skew the tank's resident water column bacteria population to favor the "non-skimmable" cohort.</p>
<p>The bottom line with respect to the carbon dosing hypothesis is clear; the basic tenets of this theory appear to hold up to experimental scrutiny; carbon dosing does increase water column bacteria populations, and skimming does remove some bacteria with their attendant nutrient loads. Thus, the underlying science behind this approach to nutrient export appears valid.</p>
<h2><b>5. Acknowledgments</b></h2>
<p>We thank the Eberly College of Science at the Pennsylvania State University and E. I DuPont de Nemours and Co. for financial support. The expertise and assistance of Dr. Elaine Kunze, Susan Magaree, and Nicole Zembower of the Flow Cytometry laboratory within the Huck Institutes of the Life Sciences at Penn State is gratefully acknowledged. Furthermore, we thank Mr. David Jones of the Pennsylvania State University Department of Civil and Environmental Engineering for assistance with the Shimadzu 5000 TOC Analyzer.</p>
<h2><b>6. References</b></h2>
<ol>
<li>Ainsworth, T.D.; Fine, M.; Roff, G.; Hoegh-Guldberg, O. 2008. "Bacteria are Not the Primary Cause of Bleaching in the Mediterranean Coral <i>Oculina patagonia</i>." ISME J. (Multidisciplinary Journal of Microbial Ecology), 2, 67-73.</li>
<li>Azam, F.; Malfatti, F. 2007. "Microbial Structuring of Marine Ecosystems." Nature Rev. Microbiol., 5, 782-791.</li>
<li>Bergey, D.H. 1994. <i>Bergey's Manual of Determinative Bacteriology, 9th ed.</i> (Edited by John G. Holt et al.) Baltimore: Williams &amp; Wilkins.</li>
<li>Brambilla, F.; Antonini, M.; Ceccuzzi, P.; Terova, G.; Saroglia, M. 2008. "Foam Fractionation Efficiency in Particulate Matter and Heterotrophic Bacteria Removal from a Recirculating Seabass (<i>Dicentrarchus labrax</i>) System." Aquacultural Engineering, 39, 37-42.</li>
<li>Brettar, I.; Rheinheimer, G. 1992. "Influence of Carbon Availability on Denitrification in the Central Baltic Sea." Limnol. Oceanogr., 37, 1146-1163.</li>
<li>Bretz, H.W.; Wang S.L.; Grieves, R.B. 1966. "Variables Affecting the Foam Separation of <i>Escherichia coli.</i>" Appl. Microbiol., 14, 778-783.</li>
<li>Button, D. K.; Robertson, B. R. 1989. "Kinetics of Bacterial Process in Natural Aquatic Systems Based on Biomass as Determined by High-Resolution Flow Cytometry." Cytometry, 10, 558-563.</li>
<li>Cano, R.J.; Borucki, M., 1995. "Revival and Identification of Bacterial Spores in 25 to 40 million year old Dominican Amber." Science, 268, 1060-1064.</li>
<li>Carlson, C.A.; Ducklow, H.W. 1996. "Growth of Bacterioplankton and Consumption of Dissolved Organic Carbon in the Sargasso Sea." Aq. Microbial Ecol., 10, 69-85.</li>
<li>Carrero-Colon, M.; Nakatsu, C.H.; Konopka, A. 2006. "Effect of Nutrient Periodicity on Microbial Community Dynamics." Appl. Environ. Microbiol. 72, 3175-3185.</li>
<li>Dinsdale, E. A.; Pantos, O.; Smriga, S.; Edwards, R. A.; Angly, F.; Wegley, L.; Hatay, M.; Hall, D.; Brown, E.; Haynes, M.; Krause, L.; Sala, E.; Sandin, S. A.; Thurber, R. V.; Willis, B. L.; Azam, F.; Knowlton, N.; Rohwer, F. 2008. "Microbial Ecology of Four Coral Atolls in the Northern Line Islands." PLoS One, 3, e1584, 1-17.</li>
<li>Ducklow, H. W.; Mitchell, R. 1979. "Bacterial Populations and Adaptations in the Mucus Layers on Living Corals." Limnol. Oceanogr., 24, 715-725.</li>
<li>Ducklow, H. W. 1983. "Production and Fate of Bacteria in the Oceans." BioScience, 33, 494-501.</li>
<li>Eppley, R. W. 1980. "Estimating Phytoplankton Growth Rates in the Central Oligotrophic Oceans." Brookhaven Symp. Biol., 31, 231-242.</li>
<li>Feldman, K. S.; Maers, K. M. 2008. "Total Organic Carbon (TOC) and the Reef Aquarium: an Initial Survey. Part 2." <i>Advanced Aquarist</i>, <a href="http://www.advancedaquarist.com/2008/9/aafeature2/">http://www.advancedaquarist.com/2008/9/aafeature2/</a></li>
<li>Feldman, K. S.; Maers, K. M. 2008. "Total Organic Carbon (TOC) and the Reef Aquarium: an Initial Survey. Part 1." <i>Advanced Aquarist</i>, <a href="http://www.advancedaquarist.com/2008/8/aafeature3/">http://www.advancedaquarist.com/2008/8/aafeature3/</a></li>
<li>Feldman, K. S.; Maers, K. M.; Vernese, L. F.; Huber, E. A.; Test, M. R. 2009. "The Development of a Method for the Quantitative Evaluation of Protein Skimmer Performance." <i>Advanced Aquarist</i>. <a href="http://www.advancedaquarist.com/2009/1/aafeature2/">http://www.advancedaquarist.com/2009/1/aafeature2/</a></li>
<li>Feldman, K. S.; Maers, K. M. 2010. Further Studies on Protein Skimmer Performance." <i>Advanced Aquarist</i>. <a href="http://www.advancedaquarist.com/2010/1/aafeature">http://www.advancedaquarist.com/2010/1/aafeature</a></li>
<li>Gaudin, A.M.; Mular, A.L.; O'Connor R.F. 1960. "Separation of Microorganisms by Flotation. I. Development and Evaluation of Assay Procedures." Appl. Microbiol. 8, 84-90.</li>
<li>Gaudin, A.M.; Mular, A.L.; O'Connor R.F. 1960. "Separation of Microorganisms by Flotation. II. Flotation of Spores of <i>Bacillus subtilis var. niger</i>." Appl. Microbiol. 8, 91-97.</li>
<li>Gaudin, A.M.; Davis, N.S.; Bangs, S.E. 1962. "Flotation of <i>Escherichia coli</i> with Sodium Chloride." Biotech. Bioeng. 4, 211-222.</li>
<li>Goldman, J.C.; Dennett, M.R. 2000. "Growth of Marine Bacteria in Batch and Continuous Culture under Carbon and Nitrogen Limitation." Limnol. Oceanogr., 45, 789 - 800.</li>
<li>Gottfried, M.; Roman, M. R. 1983. "Ingestion and Incorporation of Coral Mucus Detritus by Reef Zooplankton." Mar. Biol., 72, 211-218.</li>
<li>Granger, J.; Price, N.M. 1999. "The Importance of Siderophores in Iron Nutrition of Heterotrophic Marine Bacteria." Limnol. Oceanogr., 44, 541-555.</li>
<li>Grégori, G.; Citterio, S,; Ghiani, A.; Labra, M.; Sgorbati, S.; Brown, S.; Denis, M. 2001. "Resolution of Viable and Membrane-Compromised Bacteria in Freshwater and Marine Waters Based on Analytical Flow Cytometry and Nucleic Acid Double Staining." Appl. Environ. Microbiol., 67, 4662-4670.</li>
<li>Gruber, D.F.; Simjouw, J.-P.; Seitzinger, S. P.; Taghon, G.L., 2006. "Dynamics and Characterization of Refractory Dissolved Organic Matter Produced by a Pure Bacterial Culture in an Experimental Predator-Prey System." Appl. Environ. Microbiol. 72, 4184-4191.</li>
<li>Hobbie, J.E.; Daley, R. J.; Jasper, S. 1977. "Use of Nucleopore Filters for Counting Bacteria by Epifluorescence Microscopy. Appl. Environ. Microbiol. 33, 1225-1228.</li>
<li>Johannes, R. E. 1967. "Ecology of Organic Aggregates in the Vicinity of a Coral Reef." Limnol. Oceanogr., 12, 189-195.</li>
<li>Lebaron, P.; Parthuisot, N.; Catala, P. 1998. <br /> "Comparison of Blue Nucleic Acid Dyes for Flow Cytometric Enumeration of Bacteria in Aquatic Systems." Appl. Environ. Microbiol., 64, 1725-1730.</li>
<li>Kirchman, D.L. 1994. "The Uptake of Inorganic Nutrients by Heterotrophic Bacteria." Microbial Ecology, 28, 255-271.</li>
<li>Konhauser, K. 2007. <i>Introduction to Geomicrobiology.</i> Massachusetts: Blackwell Publishing.</li>
<li>Kooperman, N.; Ben-Dov, E.; Kramarsky-Winter, E.; Barak, Z.; Kushmaro, A. 2007. "Coral mucus-associated bacterial communities from natural and aquarium environments." FEMS Microbiol Lett, 276, 106-113.</li>
<li>Kvennefors, E.C.E.; Sampayo, E.; Ridgway, T.; Barnes, A.C.; Hoegh-Guldberg, O. 2010. "Bacterial Communities of Two Ubiquitous Great Barrier Reef Corals Reveals both Site- and Species-Specificity of Common Bacterial Associates." PLoS One, 5, e10401.</li>
<li>MacLeod, R.A. 1965. "The Question of the Existence of Specific Marine Bacteria." Bacteriol. Rev., 29, 9-23.</li>
<li>Marie, D.; Partensky, F.; Jacquet, S.; Vaulot, D. 1997. "Enumeration and Cell Cycle Analysis of Natural Populations of Marine Picoplankton by Flow Cytometry Using the Nucleic Acid Stain SYBR Green 1." Appl. Environ. Microbiol., 63, 186-193.</li>
<li>Marie, D.; Partensky, F.; Vaulot, D.; Brussaard, C. 1999. "Enumeration of Phytoplankton, Bacteria, and Viruses in Marine Samples." Curr. Prot. Cytometry, 11.11.1-11.11.15.</li>
<li>Michael, E. 2008. http://glassbox-design.com/2008/achieved-through-observation-and-experimentation/.</li>
<li>Monfort, P.; Baleux, B. 1992. "Comparison of Flow Cytometry and Epifluorescence Microscopy for Counting Bacteria in Aquatic Ecosystems." Cytometry, 13, 188-192.</li>
<li>Monger, B. C.; Landry, M. R. 1993. "Flow Cytometric Analysis of Marine Bacteria with Hoechst 33342." Appl. Environ. Microbiol., 59, 905-911.</li>
<li>Moriarty, D. J. W.; Pollard, P. C.; Hunt, W. G. 1985. "Temporal and Spatial Variation in Bacterial Production in the Water Column over a Coral Reef." Mar. Biol., 85, 285-292.</li>
<li>Noble, R. T.; Fuhrman, J. A. 1998. Use of SYBR Green 1 for Rapid Epifluorescence Counts of Marine Viruses and Bacteria." Aquat. Microb. Ecol., 14, 113-118.</li>
<li>Paul, J. H.; Rose, J. B.; Jiang, S. C.; Kellogg, C. A.; Dickson, L. 1993. "Distribution of Viral Abundance in the Reef Environment of Key Largo, Florida." Environ. Microbiol., 59, 718-724.</li>
<li>Porter, J. 2004. "Flow Cytometry and Environmental Microbiology." Curr. Protocols Cytometry, 11.2.1-11.2.13.</li>
<li>Rivkin, R.B.; Anderson, M.R. 1997. "Inorganic Nutrient Limitation of Oceanic Bacterioplankton." Limnol. Oceanogr., 42, 730-740.</li>
<li>Robertson, B. R.; Button, D. K. 1989. "Characterizing Aquatic Bacteria According to Population, Cell Size, and Apparent DNA Content by Flow Cytometry." Cytometry, 10, 70-76.</li>
<li>Rypien, K.L.; Ward, J.R.; Azam, F., 2010. "Antagonistic Interactions Among Coral-Associated Bacteria." Environ Microbial., 12, 28-39.</li>
<li>Suzuki, Y.; Hanagasaki, N.; Furukawa, T.; Yoshida, T. 2008. "Removal of Bacteria from Coastal Seawater by Foam Separation Using Dispersed Bubbles and Surface-Active Substances." J. Biosci. Bioeng., 105, 383-388.</li>
<li>Thompson, J.; MacLeod, R.A. 1974. "Potassium Transport and the Relationship between Intracellular Potassium Concentration and Amino Acid Uptake by Cells of a Marine Pseudomonad." J. Bacteriology, 120, 598-603.</li>
<li>Todar, K. 2008. Todar's Online Textbook of Bacteriology. <a href="http://www.textbookofbacteriology.net/index.html">http://www.textbookofbacteriology.net/index.html</a> .</li>
<li>Troussellier, M.; Courties, C.; Vaquer, A. 1993. "Recent Applications of Flow Cytometry in Aquatic Microbial Ecology." Biol. Cell, 78, 111-121.</li>
<li>Troussellier, M.; Courties, C.; Zettelmaier, S. 1995. "Flow Cytometric Analysis of Coastal Lagoon Bacterioplankton and Picoplankton: Fixation and Storage Effects." Estuar. Coast. Shelf Sci., 40, 621-633.</li>
<li>Verschuere, L.; Rombaut, G.; Sorgeloos, P.; Verstraete, W. 2000. "Probiotic Bacteria as Biological Control Agents in Aquaculture." Microbiol. Molec. Biol. Rev., 64, 655-671.</li>
<li>Walton, N. A.; Bjornson, M. 2008. "Vodka Dosing…Distilled! A Powerful Method for the Reduction of Nitrates and Phosphates within the Reef Aquaria." ReefKeeping, 8. <a href="http://reefkeeping.com/issues/2008-08/nftt/index.php">http://reefkeeping.com/issues/2008-08/nftt/index.php</a></li>
<li>Wegley, L.; Mosier-Boss, P.; Lieberman, S.; Andrews, J.; Graff-Baker, A.; Rohwer, F. 2006. Environ. Microbiol., 8, 1775-1782.</li>
<li>Yoshinaga, I.; Fukami, K.; Ishida, Y. 1991. "Comparison of DNA and Protein Synthesis Rates of Bacterial Assemblages Between Coral Reef Waters and Pelagic Waters in Tropical Ocean." Marine Ecol. Prog. Ser., 76, 167-174.</li>
</ol></div> <br /><br /> <script type="text/javascript"><!-- google_ad_client = "ca-pub-5170032844807535"; /* Square250x250 */ google_ad_slot = "6862474606"; google_ad_width = 250; google_ad_height = 250; //--></script><script type="text/javascript" src="http://pagead2.googlesyndication.com/pagead/show_ads.js"></script>]]></content:encoded>
    <dc:publisher>No publisher</dc:publisher>
    
    <dc:creator>Ken S. Feldman</dc:creator>
    <dc:creator>Allison A. Place</dc:creator>
    <dc:creator>Sanjay Joshi</dc:creator>
    <dc:creator>Gary White</dc:creator>
    <dc:rights>Pomacanthus Publications, Inc.</dc:rights>
    
      <dc:subject>Filtration</dc:subject>
    
    
      <dc:subject>Gary White</dc:subject>
    
    
      <dc:subject>Granular Activated Carbon</dc:subject>
    
    
      <dc:subject>Ken S. Feldman</dc:subject>
    
    
      <dc:subject>Carbon Dosing</dc:subject>
    
    
      <dc:subject>Sanjay Joshi</dc:subject>
    
    
      <dc:subject>Water Testing</dc:subject>
    
    
      <dc:subject>Allison A. Place</dc:subject>
    
    
      <dc:subject>Aquarium Chemistry</dc:subject>
    
    
      <dc:subject>Skimmers</dc:subject>
    
    
      <dc:subject>Carbon</dc:subject>
    
    
      <dc:subject>Water Quality</dc:subject>
    
    
      <dc:subject>Chemistry</dc:subject>
    
    
      <dc:subject>Bacteria</dc:subject>
    
    
      <dc:subject>Feature Article</dc:subject>
    
    <dc:date>2011-03-03T01:00:00Z</dc:date>
    <dc:type>Page</dc:type>
  </item>


  <item rdf:about="http://www.advancedaquarist.com/2010/10/chemistry">
    <title>Aquarium Chemistry: Regeneration of Granular Ferric Oxide Media with Sodium Hydroxide</title>
    <link>http://www.advancedaquarist.com/2010/10/chemistry</link>
    <description>For aquarists who keep non-photosynthetic corals that require massive feeding, have large tanks, or a dense fish population the costs of regular GFO replacement can be significant. With a few simple tools and techniques we can easily regenerate GFO so that it can be reused several times over.</description>
    <content:encoded xmlns:content="http://purl.org/rss/1.0/modules/content/"><![CDATA[<p><em><strong>Click through to see the images.</strong></em></p> <br /><div id="body">
<p><span class="dropcap">I</span>f you're reading this article beyond the title it's likely you're already familiar with the importance of phosphate in reef tanks and how granular ferric oxide (GFO) media can be used to control it, but here's a refresher anyway. Phosphate is an algal nutrient and can limit the ability of calcifying organisms to form a calcium carbonate skeleton (Farley, 2006). The general consensus is to limit reef aquaria to lower than 0.05 ppm phosphate (as PO<sub>4</sub><sup>3-</sup>). This can be achieved in a variety of ways, but using GFO to adsorb phosphate may be necessary for some aquarists and is a safe and effective tool for managing phosphate in reef aquariums (Farley, 2004). The downside to GFO is that it's rather expensive. For aquarists who keep non-photosynthetic corals that require massive feeding, have large tanks, or a dense fish population the costs of regular GFO replacement can be significant. With a few simple tools and techniques we can easily regenerate GFO so that it can be reused several times over. Below we describe a procedure that has worked for us to regenerate GFO effectively. Before going out and buying any of the materials required, please carefully read the safety instructions at the bottom of this article.</p>
<ol>
<li>Rinsing with a dilute acid (this step is likely optional for many people, see below): For every 500mL of GFO, add 8L of fresh water mixed with 6.4mL of full strength muriatic acid. Rinse for 4-6 hours and then drain.</li>
<li>Regeneration of GFO with sodium hydroxide: For every 500mL of GFO, add 8L of fresh water mixed with 320g of sodium hydroxide. Rinse for 72-96 hours and then drain.</li>
<li>Fresh water rinse with deionized water (The effectiveness of this step depends on the method you use to rinse the GFO--see the section on rinsing below for more details): For every 500mL of GFO, rinse with at least 20-25L fresh water.</li>
</ol>
<h2>Rinsing with a dilute acid</h2>
<p>This step is intended to remove any deposits of calcium carbonate on the GFO and may be unnecessary for some people. Under certain conditions calcium carbonate will abiotically precipitate onto GFO surfaces (Farley, 2004), which will limit the amount of available surface area of the GFO particles. How do you know if you need to do this step or not? Expose your GFO to some white vinegar, or diluted muriatic acid as described above, and watch for small bubbles to form. Bubbling indicates the presence of calcium carbonate. Exposure to a dilute acid for a few hours should remove these deposits. If you don't see any bubbles forming, you can safely skip this step. We have not found it necessary to perform this step on the GFO from 3 different reef systems, but your mileage may vary. This step alone will NOT regenerate the GFO, but it may be an important step for those who have significant scale coating on the granules. Increasing the concentration of the acid or lengthening the rinse time may lead to significant dissolution of the GFO surface and may reduce the number of times you can repeat the regeneration process in the future (more on this later).</p>
<p>Some people have used anywhere from 1:1 to 10:1 dilutions of white vinegar for this step instead of muriatic acid. This may work fine, but we have not tested it so cannot comment on its efficacy or its effect on the GFO. For users who are regenerating a lot of GFO frequently, muriatic acid is significantly cheaper than using vinegar. A gallon of full strength (38% by volume) muriatic acid can be purchased at many home improvement, hardware, or pool supply stores for under $10, and this should last an average reefkeeper for years. It also can be used in a 1:10 dilution for cleaning scale deposits off of pump impellers and heaters. The downside to having full strength muriatic acid around is that it is very potent stuff--as you can see from the recipe it takes a little more than a teaspoon in one gallon of water to dissolve away scale. This presents safety concerns for you, your kids, and your pets. Please see the important safety information at the end of this article before using it. The diluted solution described in step 1) above is so dilute (0.03%) that it's rather harmless so long as you don't ingest it or get it in your eyes.</p>
<h2>Regeneration of GFO with sodium hydroxide</h2>
<p>Phosphate is believed to bind to GFO via an ionic bond that displaces two hydroxide ions into solution (Farley, 2004). The simplest way to think of regeneration is the reversal of that process. By flooding the GFO with a very high concentration of hydroxide ions we are swapping the phosphate ions out and putting them into solution, and replacing them with hydroxide ions. As a result the regeneration solution becomes flooded with phosphate ions-we have measured it as high as 270 ppm PO<sub>4</sub><sup>-</sup> that we will later rinse away from the GFO.</p>
<div class="photo-wrapper"><a class="popup" href="chemistry_album/image001.jpg" rel="gallery" title="This is day 4 of 500mL of GFO being regenerated. 320g of sodium hydroxide in 8L of water solution makes a 1M solution. The yellow color is from dissolved iron."><img src="chemistry_album/image001.jpg/image_preview" alt="image001.jpg" class="image-inline" /></a>
<p class="caption">This is day 4 of 500mL of GFO being regenerated. 320g of sodium hydroxide in 8L of water solution makes a 1M solution. The yellow color is from dissolved iron.</p>
</div>
<p>The sodium hydroxide solution described in step 2) above is 16 bed volumes (the volume of regeneration solution compared to the volume of GFO being recharged) and 1.0M in concentration. We have rinsed GFO in lower concentrations (0.1M and 0.5M) at 16 bed volumes and this requires repeated regeneration cycles to remove all the phosphate from the GFO. Is the solution described above the only version that will work? Probably not, but we haven't tested other versions so can't comment on their effectiveness. Would allowing the solution to rinse longer than 96 hours pull out more phosphate? Probably not. All the testing we've done so far indicate that regeneration solutions from 0.1 - 1.0M pull out all the phosphate they can after about 72 hours. Longer rinse times may actually be problematic, because the sodium hydroxide solution will start to dissolve away some of the GFO surface. Can you double the concentration (2.0M) and lower the volume (8 volumes) or vice versa (0.5M, 32 bed volumes) and achieve the same results? We wouldn't be surprised if alternate versions of the regeneration solution would work fine as well, but further testing would be required to determine that. In our experience the combination above has worked to remove all bound phosphate from several batches of GFO used on different reef systems. If you have a good phosphate test kit at home you can play around with the concentration and volume of the regeneration solution to determine when you have "bottomed out" and removed all the bound phosphate. Most phosphate test kits work within a specific pH range, so the regeneration solution would need to be neutralized with an acid before testing. The concentration of phosphate in the solution will be much higher than most phosphate test kits can measure, so you will need to carefully dilute the sample by 100 or 200 times to get a reading that's not "off the charts".</p>
<h2>Sources of sodium hydroxide</h2>
<p>So where does one easily obtain sodium hydroxide? Many chemical supply houses will sell high grades of sodium hydroxide or potassium hydroxide but these are generally quite expensive. Sufficiently pure sodium hydroxide for GFO regeneration is a white powdery crystal sold by the common names "lye" or "caustic soda", and is used in soap making, biodiesel production, drain clearing, curing certain food products like olives, and even used in the manufacture of certain illegal synthetic drugs that might rhyme with the word "bethamphetamine". Rumor has it that it's used by mafia hitmen for disposing of certain "problems" as well. One of the quickest and easiest places to find small amounts of lye is in drain opening products at hardware stores. Most OSH, Lowe's, Home Depot, and True Value and Ace Hardware stores currently carry a product called "100% Lye Drain Opener" made by Rooto or a product called "Crystal Drain Opener" made by Roebic. Both of these products are suitable for regeneration of GFO. Will other products work? If the label says that they are made of 100% lye it's likely they will work fine, but we have never tried any drain opening product besides these two brands. There are other drain opening products that will certainly NOT work including some that may "contain lye" but may also contain gelling agents, strong acids, or bleach that may dissolve away your GFO or worse, wreak havoc in your aquarium if they are not thoroughly diluted during the rinsing process. As with muriatic acid, the use of sodium hydroxide presents important safety concerns for you, your kids, and your pets. Please see the safety disclaimers at the end of this article for more information.</p>
<div class="multi-photo-wrapper centered"><a class="popup" href="chemistry_album/image005.jpg" rel="gallery" title="" rooto="Rooto" drain="Drain" opener="Opener"><img src="chemistry_album/image005.jpg/image_mini" alt="image005.jpg" class="image-left" /></a><a class="popup" href="chemistry_album/image003.jpg" rel="gallery" title="" rooto="Rooto" drain="Drain" opener="Opener"><img src="chemistry_album/image003.jpg/image_mini" alt="image003.jpg" class="image-left" /></a>
<p class="caption">"Rooto Drain Opener" and "Roebic Crystal Drain Opener" are both suitably pure sources of sodium hydroxide for GFO regeneration.</p>
</div>
<p>For finding more than a few pounds of lye at considerably cheaper prices you may want to to do a search of local chemical suppliers and ask for caustic soda beads or lye in bulk. While large amounts of lye can be shipped to your door, there are substantial shipping charges added to bulk amounts of lye due to the hazardous nature of it. It is much cheaper to pick it up in person, plus you avoid the whole awkward conversation with your neighbors about what's the deal with the orange hazmat bucket that's been sitting on your porch all afternoon. In California, Gallade Chemical supplies lye as "caustic soda beads" in 50 pound buckets and bags that can be picked up in person or delivered by their own truck to certain locations for free. For $37 you can get 50 pounds of lye that should last the average reefkeeper for several years. If you're looking to cut costs, this is $0.74 per pound compared to $3-6 per pound of the Rooto or Roebic lye. In other states you should be able to find chemical supply houses by asking local soapmaking shops or internet forums where to find local bulk sources of lye. In case you're starting to do the math in your head, the cost of the sodium hydroxide used to regenerate GFO can be up to 20 times cheaper than replacing the GFO.</p>
<p>A quick note--Potassium hydroxide, commonly called caustic potash, can theoretically be used as a substitute for the sodium hydroxide in this step. However, at least in our area it was harder to find and more expensive where we could find it. The amounts used should be about the same for sodium hydroxide, although we haven't used it to regenerate GFO so can't comment on its effectiveness.</p>
<h2>Fresh water rinse</h2>
<p>Now that we've separated the phosphate into solution, we need to dilute and separate the solution from the GFO media. One of the downsides of this process is that the regeneration solution is rather "sticky"--it tends to require a lot of rinsing to get it all off. One way to rinse it is to put the media in a 5 gallon bucket, fill with water, and then decant; this is rather inefficient if you have a lot of media. The particles at the bottom of the pile have very little contact with the fresh water, and if you stir or agitate the media it will start grinding the GFO into dust. Plus the whole ordeal is just messy and a pain to deal with. We have found the easiest way to rinse off the regeneration solution is with a dedicated media reactor from Bulk Reef Supply and a small Maxijet 400 powerhead. Fresh water goes in one side and the diluted solution comes out the other to go straight to the drain. The biggest advantage is that all the GFO media is rinsed at once without any dead spots and without any stirring that can grind it into dust. For this reason, the BRS reactor is also ideal for all 3 steps of the regeneration process. It assures that the acid rinse and sodium hydroxide bath contacts all the media particles without grinding. If you also use a BRS reactor on your reef tank, you can easily swap out the internal plastic cartridge containing GFO from "reef mode" to "regeneration mode" without having to deal with transferring wet and messy GFO media from container to container. We can easily regenerate a GFO canister with just a few minutes worth of work every month, and with very little mess. You may find that regeneration using this method is easier than replacing the GFO! Regardless of which way you choose to rinse your media after regeneration, it is important to have a phosphate test to insure you have removed nearly all of the sodium hydroxide and phosphate before replacing the GFO back into your aquarium. We've found that rinsing the GFO in the reactor still requires about 40-50 bed volumes to be assured that all the phosphate has been rinsed out. Less efficient methods may require even more rinsing, but exactly how much would need to be determined experimentally.</p>
<div class="photo-wrapper"><a class="popup" href="chemistry_album/image007.jpg" rel="gallery" title="Thoroughly rinsing the regenerated GFO with deionized water is easy with a dedicated reactor. "><img src="chemistry_album/image007.jpg/image_preview" alt="image007.jpg" class="image-inline" /></a>
<p class="caption">Thoroughly rinsing the regenerated GFO with deionized water is easy with a dedicated reactor.</p>
</div>
<p>So is there a limit to how many times you can regenerate a given batch of GFO? It doesn't appear that there is any limit on how many times you can exchange the phosphate for hydroxide and back again, but each time you do a small amount of iron oxide hydroxide from the GFO surface is dissolved into solution. This means that the granules of media will slowly start to shrink a little bit each time you regenerate them, so there is a theoretical limit on how many times regeneration can be repeated. Some hobbyists have reported no problems with regenerating the same batch of GFO more than 10 times. There may be an advantage to purchasing pelleted versions of GFO media if you intend to regenerate it. There is less surface area to bind phosphate, but some hobbyists have reported that the pellets hold up better without dissolving as much, so you may get more regeneration cycles out of the media before it needs to be replaced entirely. The GFO we use is the small grained version from Bulk Reef Supply.</p>
<h2>Being Safe</h2>
<div class="photo-wrapper"><a class="popup" href="chemistry_album/image009.jpg" rel="gallery" title="Even Tyler Durden knows you should wear safety gear when handling sodium hydroxide."><img src="chemistry_album/image009.jpg/image_preview" alt="image009.jpg" class="image-inline" /></a>
<p class="caption">Even Tyler Durden knows you should wear safety gear when handling sodium hydroxide.</p>
</div>
<p>This article describes procedures that involve dangerous chemicals. Sodium hydroxide/potassium hydroxide/lye/caustic soda is potentially very harmful to you, your kids, and your pets. Before using it, please look up the safety information in the links below. If those links don't work in the future, here's the gist of it: Sodium hydroxide can permanently blind you and cause really nasty chemical burns if it comes in contact with your skin. When sodium hydroxide comes in contact with water it can produce enough heat to melt through plastic and burn you. For this reason it should always be very slowly added to cold water, and not vice versa. It can also react violently with some metals such as aluminum to produce hydrogen gas, so for our purposes it should be mixed, stirred, and stored with plastic materials. Safety equipment including latex gloves and eye protection should be considered an absolute necessity any time you are handling it, even when it's diluted in water. The pH of the sodium hydroxide solution described above should be right around 14 when it's freshly mixed. Vinegar will safely neutralize sodium hydroxide so it's a good idea to have a jug of vinegar around for spills. When disposing of the sodium hydroxide solution down the drain it should be flushed with plenty of cold water and/or neutralized with vinegar.</p>
<p>The same goes for muriatic acid, if you choose to use it instead of vinegar. Muriatic/Hydrochloric acid is potentially very harmful to you, your kids, and your pets. Before using it, please look up the safety information in the links below. If those links don't work in the future, here's the gist of it: Muriatic acid can permanently blind you and cause really nasty chemical burns if it comes in contact with your skin. Muriatic acid should be opened only in an area of sufficient ventilation and special care should be taken to avoid exposing yourself to the fumes. All acids should be very slowly added to cold water, and not vice versa. Like sodium hydroxide it can also react violently with some metals such as aluminum and/or produce hydrogen gas, so for our purposes it should be mixed, stirred, and stored with plastic materials. Safety equipment including latex gloves and eye protection should be considered an absolute necessity any time you are handling it, even when it's diluted in water. Baking soda will safely neutralize muriatic acid so it's a good idea to have a box of it around for any spills. When disposing of the muriatic acid solution down the drain it should be flushed with plenty of cold water and/or neutralized with baking soda.</p>
<p>Working with these chemicals and knowing the risks is your responsibility. Please proceed carefully, and happy regenerating!</p>
<h2>References</h2>
<ol>
<li>Holmes-Farley, R. Phosphate and the Reef Aquarium. Reefkeeping Online Magazine, Sept. 2006.</li>
<li>Holmes-Farley, R. Iron Oxide Hydroxide (GFO) Phosphate Binders. Reefkeeping Online Magazine, Nov. 2004.</li>
<li>Pers. comm., William Wing.</li>
<li>Pers. comm., The Reef Chemistry Forum, <a class="external-link" href="http://www.reefcentral.com">www.reefcentral.com</a></li>
</ol>
<h3>Sodium Hydroxide safety and MSDS</h3>
<ol>
<li><a href="http://www.certified-lye.com/MSDS-Lye.pdf">http://www.certified-lye.com/MSDS-Lye.pdf</a></li>
<li><a href="http://www.certified-lye.com/safety.html">http://www.certified-lye.com/safety.html</a></li>
</ol>
<h3>Muriatic Acid safety and MSDS</h3>
<ol>
<li><a href="http://www.epa.gov/ttn/atw/hlthef/hydrochl.html">http://www.epa.gov/ttn/atw/hlthef/hydrochl.html</a></li>
<li><a href="http://www.americanbio.com/MSDS_PDF/AB00830.pdf">http://www.americanbio.com/MSDS_PDF/AB00830.pdf</a></li>
</ol></div> <br /><br /> <script type="text/javascript"><!-- google_ad_client = "ca-pub-5170032844807535"; /* Square250x250 */ google_ad_slot = "6862474606"; google_ad_width = 250; google_ad_height = 250; //--></script><script type="text/javascript" src="http://pagead2.googlesyndication.com/pagead/show_ads.js"></script>]]></content:encoded>
    <dc:publisher>No publisher</dc:publisher>
    
    <dc:creator>Matt Wandell, Laura Kormos</dc:creator>
    <dc:rights>Pomacanthus Publications, Inc.</dc:rights>
    
      <dc:subject>Laura Kormos</dc:subject>
    
    
      <dc:subject>Aquarium Chemistry</dc:subject>
    
    
      <dc:subject>Matt Wandell</dc:subject>
    
    <dc:date>2010-10-15T00:00:00Z</dc:date>
    <dc:type>Page</dc:type>
  </item>


</rdf:RDF>
