

Introduction
Viewing a reef tank as “kinetic art” has sensitized many aquarists to the complex multifactoral relationships between a host of tank parameters and the color of corals, particularly small polyped scleractinians (SPS’s). Nowhere does this issue arouse more debate and more passion than on the topic of light. In no small part, the evolution of aquarium lighting sources has driven the successes experienced by numerous aquarists in sustaining captive acropora, montipora, etc. This evolution has been fueled by the introduction of metal halide light sources characterized by Kelvin ratings up to 20K, and more recently by the availability of high-output fluorescent bulbs (called T5 bulbs) with a range of spectral signatures. This broad palette of lighting options has been embraced by the contemporary reefkeeping community, and spectacular tableaus of colorful SPS’s have been achieved under a variety of lighting conditions. The lack of a single unique lighting solution has led to the inevitable comparisons/debate about the relative merits of 10K vs. 14K vs. 20K metal halide bulbs, inter alia, as well as much animated discussion on the related topic of metal halide vs. T5-based lighting solutions.
Discussion and debate have their place, but in the absence of hard data, it is difficult to resolve anything. It should be possible experimentally to test directly the effect of T5 vs. 10K MH vs. 20K MH lighting on a given coral’s coloration. In order to gain useful information from this type of experiment, it is important to define the variables involved, identify the constant elements, and arrive at a meaningful measure of experimental output. With these thoughts as background, we set out to probe the following question:
How does the observed color of an SPS coral vary as per the type of lighting used to grow it?
The whole concept of coral coloration impinges on many different areas of science, from the molecular genetics of corals, to the physical chemistry of light absorption by pigment molecules, to optics, visual perception, and finally to camera/computer graphics. Events at each of these levels impacts on the color the viewer perceives when observing the coral or examining a photographic representation of a coral. Corals produce a multitude of colored molecules, mostly but not exclusively proteins, in response to a variety of stimuli. The relationship between stimulus and colored molecule (protein) expression is a matter of speculation at present, and the control/regulatory elements that presumably operate at the genetic level have yet to be elucidated. Hypotheses spanning the gamut from offensive functions (i.e., light gathering antennas) to defensive capabilities (i.e., sunscreens) have been discussed, and there is no decisive evidence at present to discourage any of these lines of thinking. Salih et al. generated much interest by reporting data that they interpreted as being consistent with the sunscreen hypothesis, particularly for GFP (Green Fluorescent Protein) in Acropora palifera, Acropora nobilis, Pocillopora damicornis, and Goniastrea retiformis from shallow water at the great Barrier Reef, Australia (Salih, 2000). However, this conclusion was challenged by Mazel, who did not find any support for the idea that GFP modulated in any way the quantity of light reaching the zooxanthellae of Montastraea cavernosa and Montastraea faveolata (Mazel, 2003a). Schlichter described observations consistent with the antenna hypothesis, where fluorescent proteins appear to aid in converting photosynthetically unusable incident light into wavelengths readily absorbed by the zooxanthellae’s photosynthetic reaction centers (Schlichter, 1985). Finally, Fabricius recently has reported that lighter colored corals absorb less infrared radiation, which contributes to coral heating, than darker colored corals (Fabricius, 2006). This observation might be interpreted in terms of enhancing or suppressing thermal bleaching of the coral, depending upon the darkness of the color. Riddle has detailed the UV/VIS (UltraViolet/VISible) characterization of many coral coloration proteins, and his latest article is an excellent source of contemporary thinking on this topic, along with leading references (Riddle, 2007b). In addition to the coloration molecules produced by the coral itself, the symbiotic zooxanthellae, of course, contribute a golden brown color largely as a consequence of reflectance from the pigment peridinin (Hochberg, 2006).
The color of a coral that is perceived by a viewer is a combination of incident light, reflected light and re-emitted light (fluorescence) from the coral under observation. The reflected light does not interact productively with any coral molecules, and so the coral surface acts essentially like a mirror reflecting selective wavelengths of light. Therefore, the wavelengths (colors) contained within the incident light play a dominant role in the color of this reflected light. For example, a bulb shifted toward the blue end of the spectrum (i.e., 20K) lacks a large component of red light, and so any object reflecting 20K bulb light will appear biased toward the blue end of the color spectrum by virtue of this red light deficiency. Re-emitted light (fluorescence emission) does involve a molecular-level interaction between the light particles (photons) and a receptor molecule in the coral. Coral coloration molecules are capable of absorbing light at a specific spectral range of wavelengths, and this absorption has two consequences: (1) it removes from the reflected light those absorbed wavelengths (colors), and (2) it opens the possibility of fluorescence emission. Fluorescence results from a re-emission of light from the coral coloration molecule at a longer wavelength (shifted away from the blue and toward the red end of the color spectrum). The energy drop between the absorbed photons and the emitted photons is a consequence of the loss of excited state energy via molecular vibrations, a process well studied within the discipline of physical chemistry. Thus, a given coral coloration molecule may absorb blue light but emit green light through this fluorescence mechanism. Typical fluorescent efficiencies, as defined by (fluorescent) photons emitted-per-available incident photons, range from 3% – 10% (Mazel, 2003b). Mazel and Fuchs have attempted to quantify the amount of the fluorescent component in the observed light from the strongly fluorescent corals Agaricia sp., Colpophyllia natans, Diploria labyrinthiformis, Montastraea cavernosa, Montastraea faveolata, and Scolymia sp. (Mazel, 2003). Their estimates for the fluorescent component at a 2-meter depth range from 7% – 30% depending upon the precise fluorescence efficiency and the spectral properties of the coral coloration molecule(s). There are other mechanisms by which light might interact with corals to produce wavelength-shifted emitted light, including phosphorescence and diffraction, but the contribution of these processes to coral coloration is not clear at present. Overall, the perceived coral color will depend on a blend of reflected light (incident light absent absorbed wavelengths) and fluorescence emissions, if applicable. A good discussion of light and color can be found in the series of articles in Reefkeeping entitled “Facts of Light” (Joshi, 2006); see also Fenit (Fenit, 2005).
Color rendition by electronic devices is a complicated topic well outside the scope of this article. It is important to recognize, however, that all color rendition schemes involve compromises between the “true” color of an object and the “calculated” color depicted, whether by a camera, computer, or display device. In fact, software processing of an object’s color through multiple devices may lead to even greater deviations from true color. Some details of the color processing procedure used with the images in this article, and color correction using the Gretag-MacBeth color checker technique employed herein, are provided below. A good starting point for further reading can be found in: http://www.cambridgeincolour.com/tutorials.htm.
The idea that the wavelength (color) of the light under which a coral has grown can influence some characteristic of the coral is not new. Kinzie and later Schlacher both have probed specific hypotheses is this general area of coral research. Seminal studies by Kinzie assessed coral skeletal growth rates under the influence of blue, red, green, and white growth lights for both Montipora verrucosa and Pocillopora damicornis (Kinzie, 1984). They concluded that these corals grew fastest under blue light, followed closely by white light, then green light, and finally the slowest growth was observed under red light. They followed up this study by measuring photosynthesis rates of Montipora verrucosa under these same lighting conditions (Kinzie, 1987). Once again, the highest photosynthesis rates were achieved under blue light; slightly lower but similar rates were observed for corals grown under both white light and green light, followed distantly by photosynthesis rates under red light. More recently, Schlacher et al. examined growth rates of Acropora solitaryensis under 150W metal halide bulbs rated at 5.5K, 10K, 14K, and 20K color temperatures (Schlacher, 2007). After 3 months of grow-out, the overall growth rates under the different bulbs were quite distinct: 6.2 mg/day at 5.5K, 4.9 mg/day at 10K, 8.5 mg/day at 14K, and 10.9 mg/day at 20K. Thus, the bulbs delivering the highest proportion of blue light (20K and 14K) promoted the highest growth rates. One concern clouds the interpretation of these results; the authors positioned all of the bulbs at the same height above the corals, leading to significant differences in the measured Photosynthetic Photon Flux Density (PPFD) delivered to the coral from each of these lamps. For example, the PPFD of the 20K lamp at the 400-450 nm spectral range of chlorophyll absorption is about 7.5 times greater than the PPFD of the 5.5K lamp at this same spectral range. The significance of these photon quantity differences on growth rate, independent of overall bulb “color”, remains to be determined. The relationship between incident light color and consequent coral coloration, the topic of this essay, was considered by Riddle (Riddle, 2003). Using a brown Pocillopora meandrina as a test case, coral coloration was visually assayed after exposure of this SPS to focused light from either blue, red, green, yellow, or ultraviolet LED’s over a period of greater than 7 weeks. The coral section irradiated by the blue LED turned from brown to pink, whereas the other colored lights either had no effect, or promoted coral bleaching. This limited investigation led to some intriguing speculation about the connection between growth light and coral color, and it sets the stage for the more extensive studies described below.
Experimental Design
The experiment was designed as follows: Three 10-gallon tanks were set up to hold coral fragments on eggcrate. These tanks were connected in series along with an Eheim canister filter containing live rock. The Eheim filter provides the motive force to circulate water among the three tanks, at a rate of approximately 1 turnover of the 30-gallon system volume every 3 hrs. A Phosban reactor charged with granular activated carbon (GAC) and phosban was installed for water purification. The GAC/phosban was changed every 3 weeks. A Remora skimmer completed the water purification apparatus, and an Ebo Jagger heater and tunze osmolator held the system temperature and the system water level, respectively, constant. For circulation, each tank was equipped with a Maxijet 1200 feeding a spray bar set just under the waterline. Livestock consisted of nothing more than a few turbo and astrea snails and a peppermint shrimp, per tank. This setup equalized all of the other parameters among the three tanks, such as water quality, water temperature, water flow, salt, trace elements, etc., and isolated the light source as the only variable affecting coral coloration.
Weekly additions of alkalinity (Two Little Fishes solution B) and calcium (CaCl2•2H2O) were employed to maintain the levels of the former at 2.4-2.9 meq/L and the later at 350 – 400 ppm. Magnesium (MgCl2•6H2O + MgSO4•7H2O) was added occasionally as needed to maintain the Mg level at 1250 – 1300 ppm. A 5-gallon water change was conducted weekly, and the tanks were fed cyclopeeze, oyster eggs and Salifert Amino Acids on a weekly basis as well.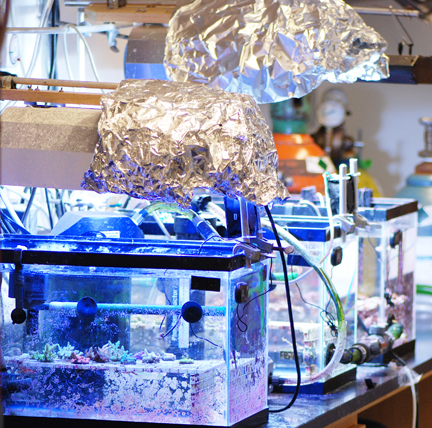
Three approximately equal sized 0.25 – 0.5 inch frags from 6 different montipora and 5 different acropora parent colonies were cut, glued onto Aragacrete frag plugs, and placed on the eggcrate in each tank. By this protocol, each tank had one frag from each unique coral specimen. The frags from each parent colony were placed in the same locations in each of the tanks so the frags from each unique coral should experience the same, or at least very similar, light exposure and water flow. Above one tank was placed a 20K 175W XM single-ended metal halide bulb; a second tank was illuminated with a 10K 175W XM single-ended metal halide bulb, and the third tank was topped with a Tek Light fixture featuring 4 x 24W T5 bulbs (2 x 24W Aquasun VHO’s in the exterior positions, 1 JALLI 10000K, and 1 AB actinic blue in the interior positions). The MH bulbs were situated in Spider reflectors, and small muffin fans were used to cool the tanks. No UV shielding was positioned between the bulbs and the tank. Note that T5 (fluorescent) bulbs do not produce significant light in the UV-A region of the spectrum (Riddle, 2007a). Likewise, the single-ended MH bulbs used in this experiment have adequate shielding in the UV-A region as a consequence of their borosilicate glass housings. In contrast, many double-ended MH bulbs do produce significant quantities of UV-A light, but the effects of this higher energy light on coral coloration are beyond the scope of these experiments. The tanks were separated by opaque white posterboard to prevent cross-contamination of light sources. With this arrangement, the tank temperature fluctuated from 76 oF (lights off) to 80 oF (lights on) over the course of 24 hours; the irradiation period lasted 8 hours/day. The height of each of the lights was adjusted to provide a constant amount of PAR at the coral level, measured by an Apogee Quantum Meter; the initial height settings of the lights delivered about 140 – 160 mE/m2 of light intensity, but unsatisfactory coloration in this nutrient poor environment prompted the elevation of these bulbs so that the PAR readings at the corals were about 80 – 100 mE/m2. These readings were taken at the center of the tanks, directly under the MH or T5 bulbs. Therefore, not every coral received the same amount of light, as the intensity drops off as distance from the center increases. Nevertheless, identical placement of each type of coral in the three tanks ensured, at the very least, that the light intensity for each type of coral was approximately equal between the two MH tanks, with some uncertainty in the amount of intensity variance between the MH tanks and the T5 tank. Note that this approach normalizes the PPFD, in contrast to the Schlacher experiment. The corals were grown under these conditions for 14 months. All bulbs were replaced after 12 months of continuous use. The experimental setup is illustrated in Figure 1.
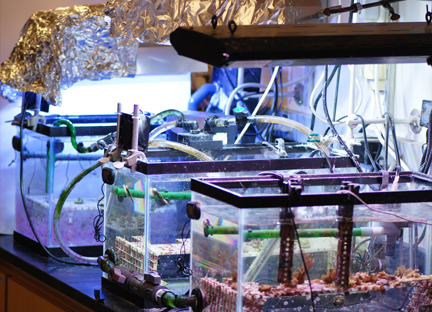
Figure 1. Left-hand view (top) and right-hand view (bottom) of three interconnected tanks for coral frag growout; the left tank is irradiated at 20K, the middle tank at 10K, and the right tank is under T5 lighting. The opaque dividers that separated the tanks were removed for these photographs.
The corals colored up and grew at appreciable rates under this experimental regimen. Photography was used to provide a visual comparison of the frag coloration from each of the tanks. A Nikon D80 camera equipped with a 105 mm Macro lens was mounted on a tripod for the photography. These pictures were taken in RAW mode through the (cleaned) front glass of the tanks, without flash. Thus, the tank lighting itself provided the only illumination for the photographs. In order to ensure that accurate colors are portrayed, color correction via white balancing was employed in the photograph workup. A Gretag-MacBeth color checker was used to regularize the white balance setting (details are given below). In addition, the computer monitor (Apple MacBook Pro) used to perform these color corrections was color calibrated using the native color calibration software provided. The corals were allowed to grow out over the course of 14 months. At that time, their colors appeared to have stabilized, and there was visible and often substantial new growth in each of the frags. At that point in time, the coral frags were photographed, and these photographs are presented below.
Results
White balancing via the Gretag-MacBeth color checker
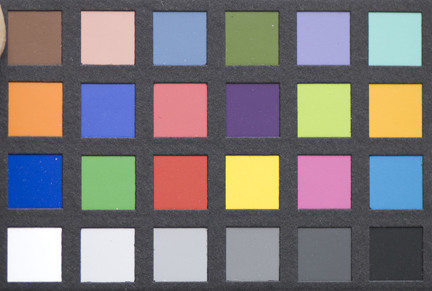
The Gretag-MacBeth color checker illustrated in Fig. 2 is the standard used for white balancing in the photography industry. As an illustration of the methodology, Fig. 2 (left) shows the color checker photographed in sunlight using the automatic white balancing function of the Nikon D80 camera. Fig. 2 (middle) captures the same checker, illuminated by sunlight, taken in RAW mode. Fig. 2 (right) demonstrates how Adobe Photoshop (CS3) can be used to “correct” the color of the 2 (middle) photograph by adjusting the color scheme. Since these photographs were taken under a light source for which the camera’s software is optimized, there is little difference between Fig. 2 (left) and Fig. 2 (right). In fact, the color squares of the Gretag-Macbeth color checker have standard hue values accepted by the photography profession, and so the degree of color “accuracy” can be quantified. Both the Gretag-MacBeth color scheme and the color settings used by Adobe Photoshop3 adhere to the sRGB scale. Each color utilized by Photoshop (or displayed in the color checker) is composed of a mixture of red, green, and blue primary colors ranging in intensity from 0 (= black) to 255 (= white). The scale is set up such that if RGB = 0/0/0, the displayed color is black, and if RGB = 255/255/255, the displayed color is white. If all three RGB intensity values are equal, the result is a shade of gray. The official color “red”, as an example, is composed of a red intensity of 175, a green intensity of 54, and a blue intensity of 60 (Table 1, line 1, column 2), whereas yellow (not a primary color) is more of a blend: 231/199/31 (Table 1, line 5, column 2). For photographs 2 (left) – 2 (right), values spanning a representative suite of colors are shown in Table 1. Whereas there is some variance between the official hue designations and the processed colors, these differences are rather minor and almost imperceptible to the human eye.
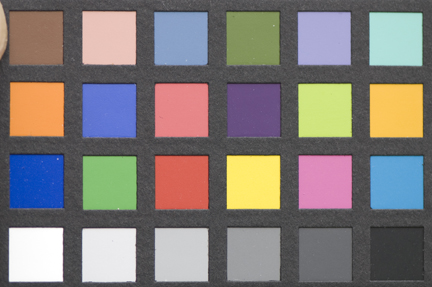
Figure 2. The Gretag-MacBeth color checker white balance correction for photography under sunlight. Left: the camera-auto white balanced file. Middle: the uncorrected RAW file. Right: the corrected colors in the processed picture file.
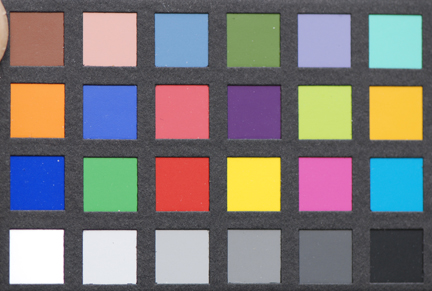
| color | accepted hue | Fig. 2 (left) hue | Fig. 2 (middle) hue | Fig. 2 (right) hue |
|---|---|---|---|---|
| red | 175/54/60 | 225/74/67 | 216/99/89 | 218/100/86 |
| blue | 56/61/150 | 18/71/213 | 4/74/195 | 14/77/190 |
| green | 70/148/73 | 109/198/130 | 133/193/121 | 136/194/118 |
| purple | 94/60/108 | 110/69/135 | 104/79/136 | 107/80/131 |
| yellow | 231/199/31 | 255/230/76 | 255/236/115 | 255/236/107 |
| white | 243/243/242 | 255/255/255 | 252/253/255 | 253/253/253 |
| medium gray | 160/160/160 | 161/164/171 | 157/160/167 | 160/161/163 |
| black | 52/52/52 | 50/51/55 | 56/57/61 | 61/63/62 |
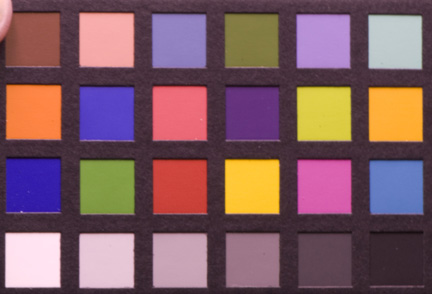
Unlike photography under sunlight, pictures taken under high-Kelvin tank lighting conditions present significant challenges for most cameras, as the photo processing software is not designed to handle such blue-biased lighting. This problem has been discussed extensively elsewhere (Rothschild, 2005). While white balancing in Photoshop via the color checker may be an imperfect solution, there appears to be no better option for eliminating the biases of color adjustment. Fig. 3 illustrates the outcome of white balancing in the most difficult case, 20K incident light. Similarly, Figs. 4 and 5 present the optimized color corrections realized under the 10K bulb and the T5 bulbs, respectively. A quantitative representation of these corrections is displayed in Table 2. It is evident that the corrected colors differ from the accepted colors by greater margins with the aquarium lighting, especially under the 20K bulbs, than with sunlight as the light source.
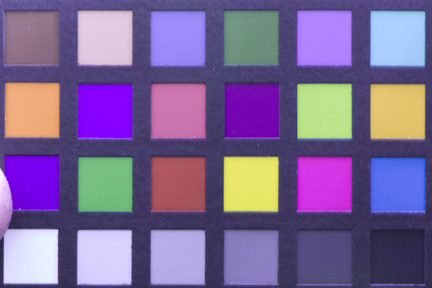
Figure 3. The Gretag-MacBeth color checker white balance correction for photography under 20K MH 175W XM bulbs. Left: the uncorrected RAW file. Right: the corrected colors in the processed picture file.
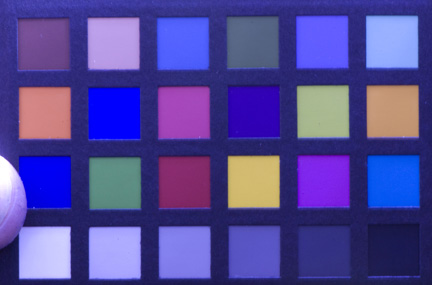
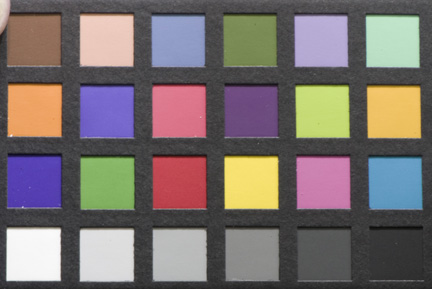
Figure 4. The Gretag-MacBeth color checker white balance correction for photography under 10K MH 175W XM bulbs. Left: the uncorrected RAW file. Right: the corrected colors in the processed picture file.
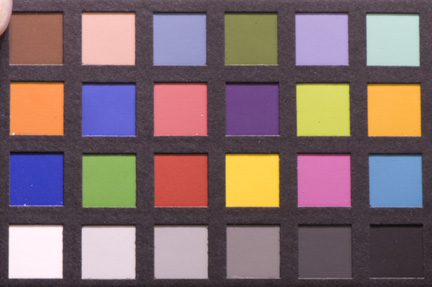

Figure 5. The Gretag-MacBeth color checker white balance correction for photography under T5 24W bulbs. Left: the uncorrected RAW file. Right: the corrected colors in the processed picture file.
| color | accepted hue | 20K hue (Fig. 3) | 10K hue (Fig. 4) | T5 hue (Fig. 5) |
|---|---|---|---|---|
| Red | 175/54/60 | 171/85/94 | 190/70/79 | 188/84/59 |
| blue | 56/61/150 | 117/0/237 | 85/64/180 | 53/33/157 |
| green | 70/148/73 | 119/190/127 | 132/180/99 | 95/168/63 |
| purple | 94/60/108 | 117/5/178 | 109/75/127 | 98/56/120 |
| yellow | 231/199/31 | 233/232/106 | 245/224/110 | 242/226/43 |
| white | 243/243/242 | 229/238/255 | 246/246/246 | 237/237/237 |
| medium gray | 160/160/160 | 180/173/230 | 187/187/187 | 178/178/180 |
| black | 52/52/52 | 49/43/79 | 52/52/52 | 45/45/45 |
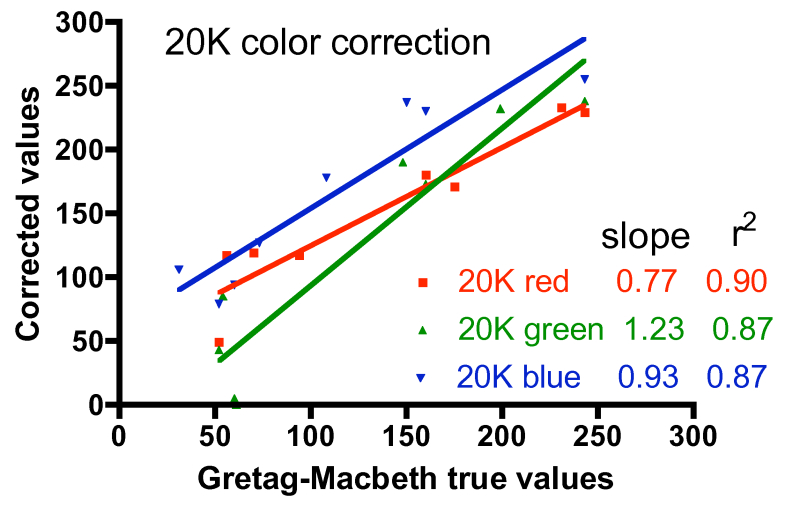
One approach to quantifying the differences between the corrected color values and the true values is shown in Fig. 6. In these graphs, the accepted intensity values for all hues (and colors within hues) listed in Table 2 were plotted on the X-axis against the corrected values on the Y-axis. In the ideal case of perfect color correction, the correlation lines between these two sets of data will have a slope of 1.00, and the scatter of the data, as represented by the r2 value, would be negligible (r2 approaches 1.00). In practice, these criteria for success are met best by the T5 color correction, and least by the 20K color correction. The 20K color correction in general tends to significantly underestimate the red intensities overall (slope = 0.77), but that underrepresentation is partially compensated by an enhancement of the green channel (slope = 1.23). Simply increasing the red intensity and/or decreasing the green intensity in the color correction process leads to obviously false color images. The difficulty with color correcting the light from the 20K lamps may be due to the fact that these lamps are not true 20K lamps and lie far off the black body curve used to determine the color temperature of the bulbs (Joshi 2006) Nevertheless, these corrections are the best available, and they will be applied to the coral photographs presented below.
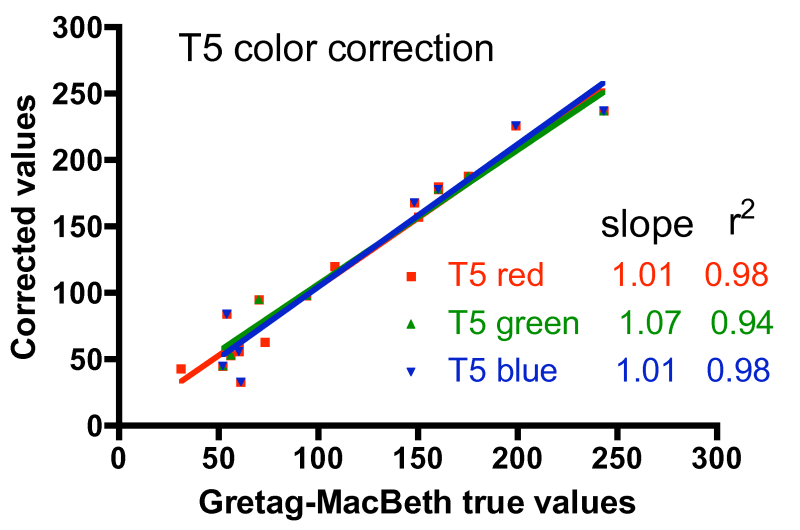
Figure 6. Graphical representation of the fidelity of the Gretag-MacBeth color checker-based corrections for the three different light sources, using the data for the colors listed in Table 2.

Acropora photographs
Five acropora species were fragged and grown out as described in the Experimental section. The origins of the coral are indicated, and all five corals are given a provisional species identification. This identification should be considered tentative, and typically was provided by the vendor. Correct species identification would be greatly appreciated and should be forwarded to the authors. In each case, a photograph of the parent colony in one of the author’s aquariums is provided. Four of these five parent colony photos were taken with a Canon PowerShot S500 point-and-shoot camera with automatic white balancing, whereas the fifth (A. carduus) was captured with a Nikon D80, again with automatic white balancing. Both growth light and photography light for these parent colonies was provided by 10K 400W XM bulbs.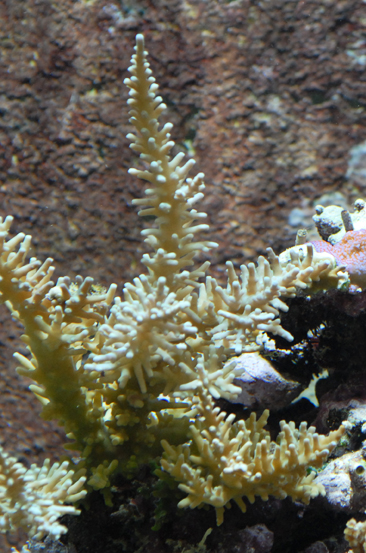
1. A. carduus (Fig. 7)
An aquacultured “baby blue bottlebrush” was purchased from Atlantis Aquarium and tentatively identified as A. carduus by one of the authors. Under 10K 400W XM lighting, the mother colony remained largely beige in color, with a slight hint of blue when viewed from the top. When viewed under either 10K or T5 lighting, the frags of this coral grown under any of the experimental lights appeared uniformly beige, much like the parent colony. However, when viewed under 20K lighting, the frag grown under 20K irradiation, uniquely, did appear to have a slight greenish tinge, especially near the base growth area. The frags grown under either 10K or T5 lighting did not display this faint color when viewed under 20K light. Thus, this observation is consistent with a scenario wherein 20K growth light actually induces the production of a green coral coloration molecule, but that same pigment is not induced when the coral is grown under either 10K or T5 lighting.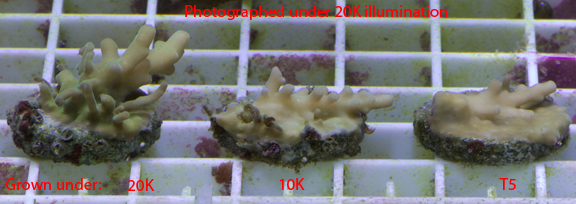
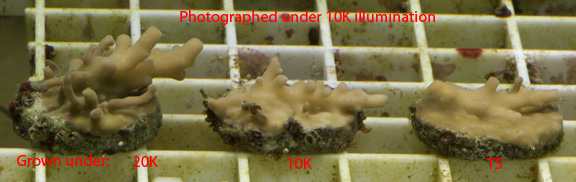

Figure 7. Acropora carduus: Parent colony under 10K lighting, 20K (top), 10K (middle), T5 (bottom).
2. Acropora insignus (Fig. 8)
This aquacultured coral was purchased from Pacific East Aquaculture as a small colony. It appeared to be light blue with darker blue corallites when grown under 10K lighting. In the experimental tanks, it never achieved this blue color, but it did take on a greenish cast. All frags under a given photography lighting appeared to be colored identically. When viewed under either T5 or 10K lighting, the green color was barely perceptible. However, when viewed under 20K lighting, all frags, irrespective of the specific growth light, displayed a bright green pigment (GFP??). Thus, this coral appears to be an example of a case where the higher temperature lighting is necessary to bring out the striking green color, but the coral coloration molecule that is responsible for this hue is present under all three growth lights.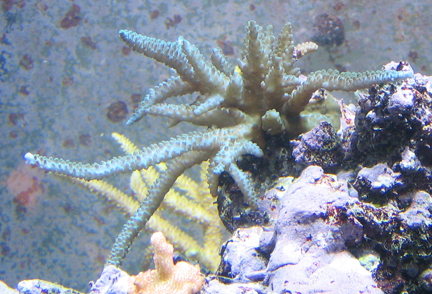

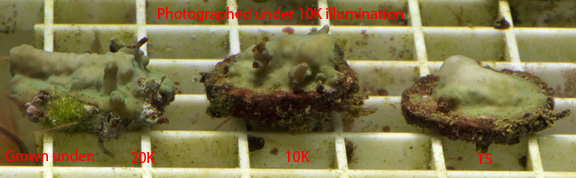

Figure 8. Acropora insignus: parent colony under 10K lighting, 20K (top), 10K (middle), T5 (bottom).
3. Acropora hoeksemai (Fig. 9)
This aquacultured Acropora hoeksemai was purchased from Atlantis Aquarium. It exhibited the typical blue-purple coloration seen in many hoeksemai specimens imported over the past several years, although the parent colony picture below does not do it justice. In the frag propagation tanks, this rich blue-purple color was never duplicated under any of the lighting conditions. In addition, the incident light frequency had no demonstrable effect on the coral’s coloration. All three frags photographed under 20K light exhibited a vibrant greenish-yellow tint. Similarly, each frag set under either 10K or T5 lighting appeared identical, and furthermore, there was little difference between the hoeksemai frags’ color when viewed under either of these light sources. In these 10K- and T5-illuminated photographs, the coral frags appeared to be a uniform golden-brown with a hint of green tint. Thus, the coral coloration molecules of this species are present/induced under all of the three lighting regimens. However, the viewing light has a profound influence on the perceived color, and 20K lighting clearly provides the most captivating colors.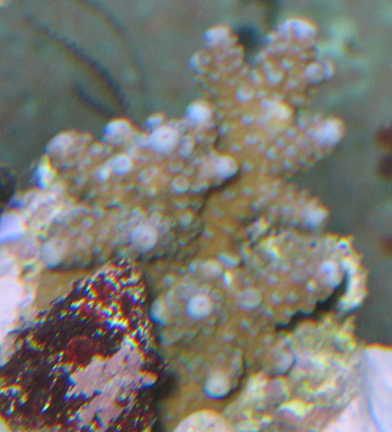
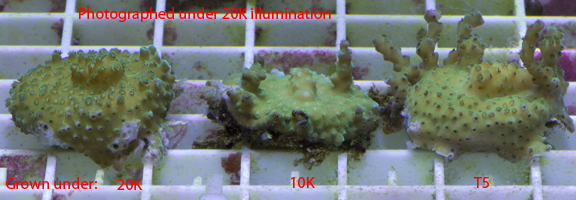

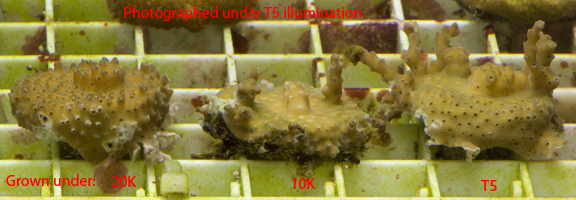
Figure 9. Acropora hoeksemai: parent colony under 10K lighting, 20K (top), 10K (middle), T5 (bottom).
4. Acropora sarmentosa (Fig. 10)
This Acropora sarmentosa was purchased as a wild colony from Reefer Madness. The parent colony photograph shown below was taken just after purchase, and the colors are somewhat muted from the shipping ordeal. Upon fragging and grow-out in the propagation tanks, the coloration story with this species is similar to that described above for the A. hoeksemai. There is no visual evidence that growth light frequency has any influence on the coral’s coloration. The frags appeared to be identically colored under a given photography lighting scheme, and it is only the viewing light that matters in any material way. Once again, the 20K lighting scheme provided specimens with the most pronounced and vibrant colors. In this case, the full richness of the green is apparent. As these frags grew out further, the characteristic pink tips of the sarmentosa appeared as well (not shown). The specimens photographed under both 10K and T5 lighting all appeared identical, with just a sheen of the green color observed under the 20K lighting. Once again, viewing lighting, and not growth lighting, makes the difference.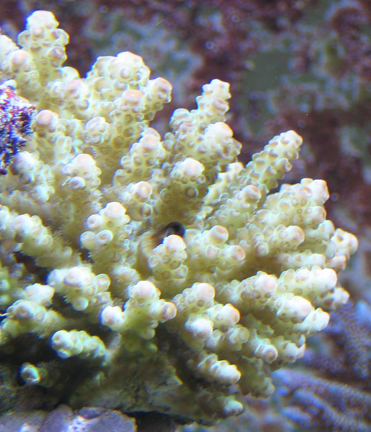
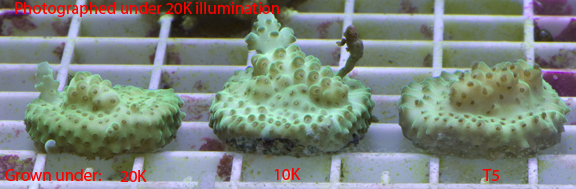
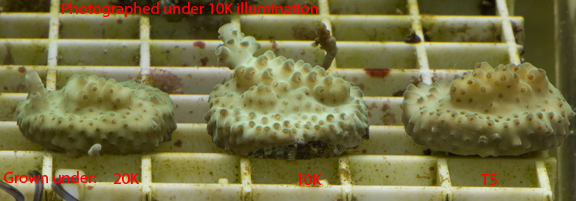
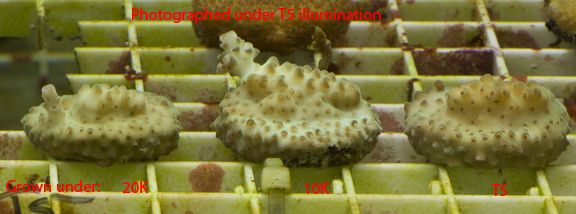
Figure 10. Acropora sarmentosa: parent colony under 10K lighting, 20K (top), 10K (middle), T5 (bottom).
5. Acropora millepora (Fig. 11)
The aquacultured Acropora millepora recruited for this study was purchased from Phishy Business. Its color was not stable in its home tank, and over an approximately 1.5 year period it went through several color changes. It initially arrived as a “bubblegum” pink colony, but that color faded to peach as the coral grew. In addition, the new growth of the encrusting base, but not the growth tips, was green! Eventually, the overall peach color morphed into a rust red-brown. The environmental stimuli that drove these changes are unknown; reaction with molecular oxygen (“oxidation”) has been cited in pigment color shifts (called “kindling”), and it is possible that slow protein oxidation plays a role in these shifts (Riddle, 2007b). The photograph of the parent colony shown below depicts this coral in its “peach” phase. True to its behavior in its home tank, the frags grown out under the different illumination conditions did shown color sensitivity to the growth light frequency. When viewed under 20K lighting, the frag grown out under 20K illumination had a peach colored body, green growth tips, and a distinct purple cast to the growth edge of its base. In contrast, the 10K-growth/20K-photographed frag expressed the peach body color/green growth rim seen in the parent colony during one of its early phases. The frag grown out under T5 lighting and visualized under 20K lighting was different again: a green body with a purple growth rim. The color variations observed under both 10K and T5 lighting were much less dramatic. Under 10K photographic illumination, all corals appeared as mainly beige-peach, but the one frag grown under 10K lighting had unique and distinct green growth areas at its burgeoning tips and the rim of its base. When viewed under T5 lighting, all frags appeared similarly beige-peach, and the green growth rim of the 10K-grown specimen was barely detectable. As with the other acropora species, viewing this millepora under 20K lighting brings out more dramatic colors. Apart from this obvious conclusion, this coral exhibited the most pronounced variation in color as a function of growth light among all of the coral species examined. The 20K photography results suggest that perhaps three coral coloration molecules are involved: peach, green, and purple. Alternatively, the purple color might be attributable to the superposition of green and peach coloration molecules, and not to a distinct third pigment. The frag grown out under 20K lighting appears to express all three colors in different growth zones. The frag grown out under 10K lighting appears to lack substantial amounts of the purple pigment, or alternatively, it lacks spatial overlap between the peach and green pigments. The frag grown out under T5 lighting appears to lack substantial areas containing only the peach colored pigment. Thus, these observations provide evidence in support of the hypothesis that different growth lights can induce the production of different coral coloration molecules, and help rationalize the color variations in the parent colony over time.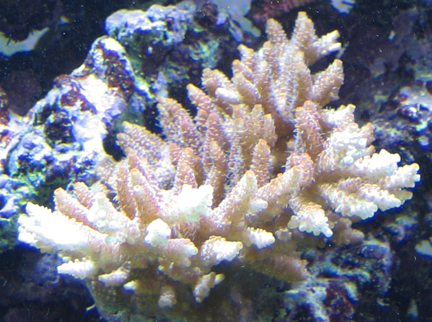
Figure 11. Acropora millepora: parent colony under 10K lighting, 20K (top), 10K (middle), T5 (bottom).
Montipora photographs
Six montipora species were fragged and grown out as described in the Experimental section. The origins of the coral are indicated, and five out of the six specimens are given a provisional species identification. This identification should be considered tentative, and typically was provided by the vendor. Correct species identification would be greatly appreciated and should be forwarded to the authors. In four out of the six examples, a photograph of the parent colony in one of the author’s aquariums is provided. These parent colony photos were taken with either a Canon PowerShot S500 point-and-shoot camera with automatic white balancing (orange M. digitata, M. capricornis, M. sp.?) or a Nikon D80 also with automatic white balancing (M. danae). Both growth light and photography light for the parent colonies was provided by 10K 400W XM bulbs.
1. M. digitata, orange (Fig. 12)
The orange Montipora digitata was acquired from a 10-year old colony with multiple generations maintained by one of the authors at the Penn State Aquarium. The parent colony maintained its robust orange color with pinkish growth tips in its home aquarium over the course of many years. In the experimental tanks, however, it never regained this solid orange hue, but rather acquired a much more pink tint to the orange base color throughout. When viewed under 20K lighting, the frags grown under either 20K or T5 lighting appeared identical and largely pink throughout. Under this same lighting, the specimen grown under 10K lighting had the most noticeable orange tint, especially in the polyps. These color relationships are maintained throughout the other two viewing light schemes. Under both T5 and 10K viewing lights, the coral frags grown under both 20K and T5 lighting appeared the most pink, and were essentially indistinguishable in color. The frag grown under 10K lighting, whether viewed under either 20K or T5 lighting, maintained its decidedly orange cast with pink overtones. Thus, this coral exemplifies a case where growth light does matter – the frag grown under 10K lighting has distinctly more orange pigment than pink pigment, but viewing light does not matter – the color variation noted above is evident under all three viewing lights.
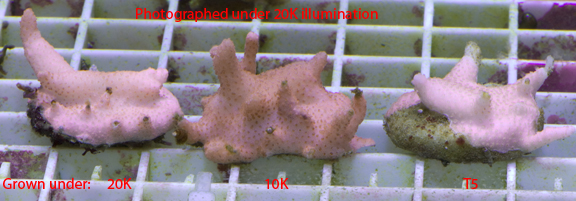
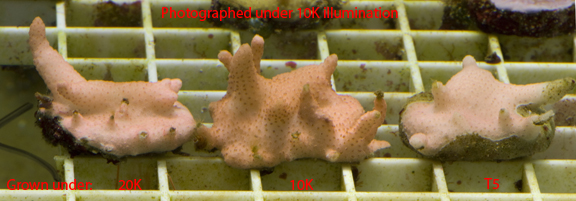
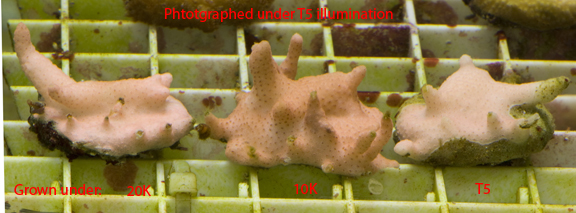
Figure 12. Montipora digitata (orange): 20K (top), 10K (middle), T5 (bottom).
2. M. digitata, purple (Fig. 13)
The purple Montipora digitata was acquired from the Penn State Aquarium. This coral originally came from Joe Yaiullo at Atlantis Marine World, Long Island. Unlike the orange color morph discussed above, this montipora appears to be colored identically whether grown under 20K, 10K, or T5 lighting. However, there is a distinct difference in apparent coloration as a consequence of the viewing light. Only 20K lighting clearly reveals the purple coloration of this specimen, and this purple color molecule is expressed under all growth lights. With both 10K and T5 photography lighting, this coloration molecule is not dominant in the reflected (visible) light, and the coral adopts the typical brown coloration of zooxanthellae.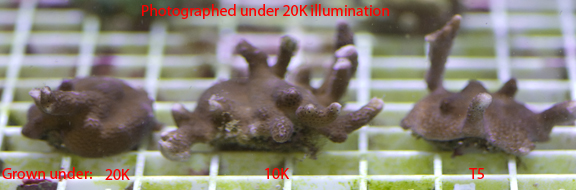
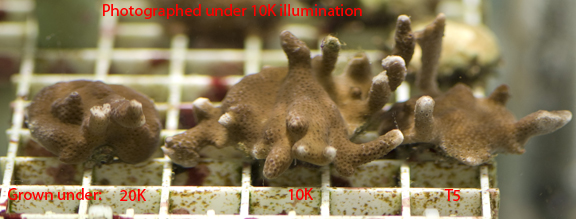
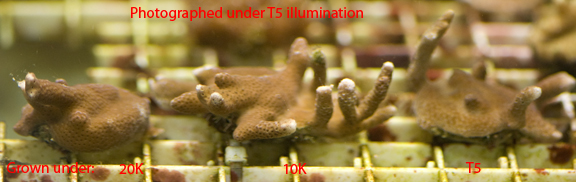
Figure 13. Montipora digitata (purple): 20K (top), 10K (middle), T5 (bottom).
3. M. spongodes, green (Fig. 14)
The green Montipora spongodes was acquired from the Penn State Aquarium. The original source of this coral is no longer known. When grown out as a larger colony, it can develop light purple tips, which are just becoming evident in the pictures below. Like the purple digitata discussed above, there does not appear to be any compelling visual evidence to support the conclusion that incident growth light influences coloration. All corals appear to have the same color under a given photography (viewing) light. However, this species does display dramatic color differences when viewed under the different lighting schemes. When viewed under 20K illumination for any growth lighting, the green color is much more vivid than under either of the other two photography lights. It appears to have a fluorescent quality, and the purple of the growth tips is more pronounced. Under 10K viewing/photography light, the color of this coral, irrespective of its growth lighting, is beginning to shift from the unmistakable green of the 20K photograph to the muddy zooxanthellae-inspired brown frequently encountered by disappointed hobbyists. This trend is extended when viewed under T5 lighting, where the “browning out” of this coral is complete. Thus, these pictures provide strong impetus for use of 20K lighting to enhance the viewing color of this particular montipora species.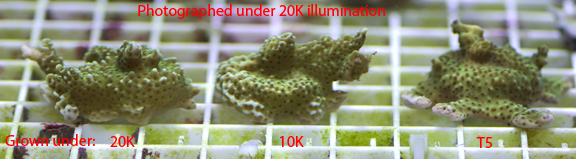


Figure 14. Montipora Spongodes (green): 20K (top), 10K (middle), T5 (bottom).
4. M. capricornis (Fig. 15)
The Montipora capricornis pictured in Fig. 15 was won at a frag swap raffle with the parent colony acquired from Aqua Marines. It is likely the same coral widely sold as the “Idaho grape monti”. The parent colony is quite fast growing and colored lavender throughout with purple/blue polyps. The growth lighting for this coral does appear to have a slight influence on the final coloration. Specifically, the specimen grown under 20K light appears to have a uniquely ruddy, or slightly brownish, cast to it under any photography light. The samples grown out under either the 10K or T5 lights do not share this color characteristic, and they appear to be the conventional lavender color expected for this coral, when viewed under 20K, 10K or T5 lighting. Thus, this montipora species may be another example of a coral whose coloration molecule(s) can be induced selectively by the incident light source.
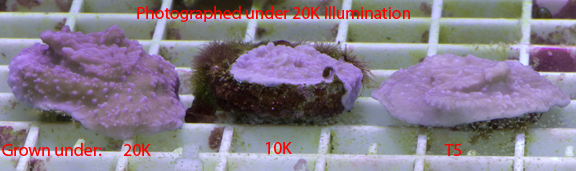
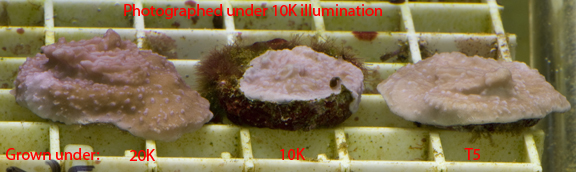
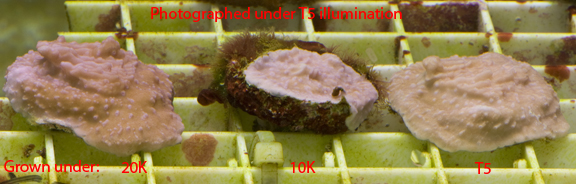
Figure 15. Montipora capricornis: parent colony under 10K lights, 20K (top), 10K (middle), T5 (bottom).
5. M. danae (Fig. 16)
This fast-growing montipora was purchased from Atlantis Aquarium under the title of “Superman monti”. Common to the montiporas already discussed, this coral’s coloration does not seem to be responsive to the frequency of the growth light source. As the pictures in Fig. 16 illustrate, both the lavender base and the red/orange polyps appear identical when photographed (viewed) under any of the light sources. As with the other corals, the 20K photographic illumination causes the colors to “pop” out more than the 10K or T5 examples. Clearly, the same coral coloration molecules are present under any of the lighting regimes examined.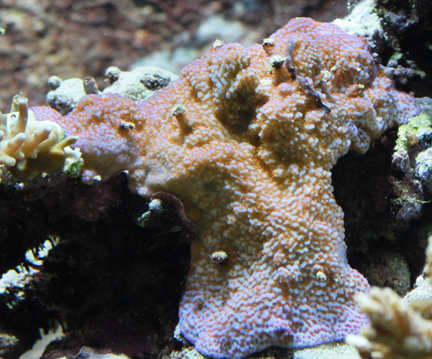


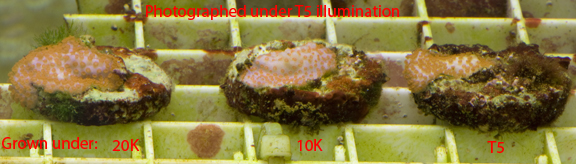
Figure 16. Montipora danae: parent colony under 10K lighting, 20K (top), 10K (middle), T5 (bottom).
6. M. sp., purple (Fig. 17)
This slow growing montipora was the grand prize at a local frag swap raffle. It was obtained from Aqua Marines. In what is now a recurring theme, the growth lighting of this coral does not seem to have any substantial impact on its coloration, with one curious exception. The specimen grown under 10K lighting and photographed under T5 lighting is conspicuously tinted more toward the pinkish purple than the frags grown out under 20K or T5 lighting, which are more bluish purple. The significance of this observation is unclear at present. Once again, the color of this coral under 20K illumination appears to be a richer, more vibrant hue of purple than its color under 10K or T5 lighting.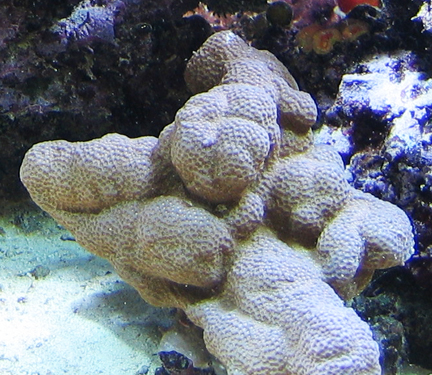
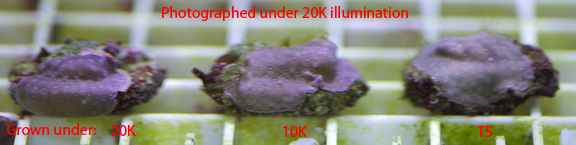
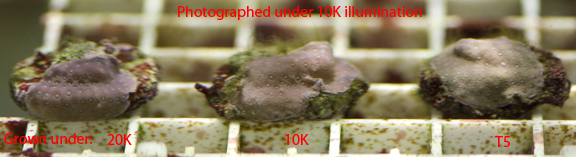
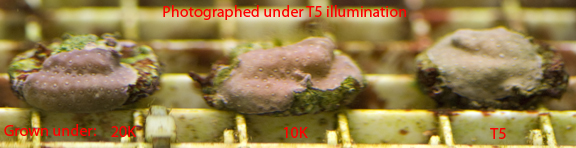
Figure 17. Montipora sp.: parent colony under 10K lighting, 20K (top), 10K (middle), T5 (bottom).
Conclusions
It is not possible to draw sweeping generalizations about the relationship between coral growth lighting and coral coloration based upon this limited data set of 11 SPS corals. Nevertheless, two focused conclusions are supported by these data: (1) the colors of these specific corals viewed under 20K lighting appear more vibrant compared to either 10K or T5 lighting. In addition, the coral colors appear quite similar under these latter two lighting schemes. The former observation could be due to the inability of the human eye and/or the color correction procedure to completely eliminate the dominant effect of the blue light in the 20K bulb’s spectrum. (2) In some cases, the growth light does induce, uniquely, the production of specific coral coloration molecules. Whereas the first conclusion has been recognized for as long as 20K bulbs have been available, the experiments described herein suggest, for the first time, that the specific coloration molecules that define these vibrant colors are actually present in the coral even if it is grown out under lower Kelvin-rated lighting. Lighting color, of course, is just one of the possible input parameters that influences coral coloration. Water nutrient levels, light intensity water flow, salt and trace element content, oxygen concentration, temperature, pH, etc., may all contribute as well (see Riddle, 2007a for a more thorough discussion). It will be interesting to see if carefully designed experiments that isolate each of these parameters in turn can be conducted with the intent of further elaborating the specific inputs that, when summed together, lead to the stunning coral colors that aquarists find so captivating.
References
- Fabricius, F. 2006. “Effects of Irradiance, Flow and Colony Pigmentation on the Temperature Microenvironment around Corals; Implications for Coral Bleaching.” Limnol. Oceanogr., 51, 30-37.
- Finet, B.; Lesage, F.; Will, N. 2005. “Colors by the Thousands – Light, Colors and Corals, Part 1. Advanced Aquarist; http://www.advancedaquarist.com/2005/12/aafeature2.
- Hochberg, E. J.; Apprill, A. M.; Atkinson, M. J.; Bidigare, R. R. 2006. “Bio-Optical Modeling of Photosynthetic Pigments in Corals.” Coral Reefs, 25, 99-109.
- Joshi, S. 2006. “Facts of Light. Part IV: Color Temperature” Reefkeeping; http://reefkeeping.com/issues/2006-05/sj/index.php.
- Kinzie, R. A., III; Jokiel, P. L.; York, R. 1984. “Effects of Light of Altered Spectral Composition on Coral Zoozanthellae Associations and on Zoozanthellae in vitro.” Mar. Biol., 78, 239-248.
- Kinzie, R. A., III; Hunter, T. 1987. “Effect of Light Quality on Photosynthesis of the Reef Coral Montipora verrucosa.” Mar. Biol., 94, 95-109.
- Mazel, C. H.; Lesser, M. P.; Gorbunov, M. Y.; Barry, T. M.; Farrell, J. H.; Wyman, K. D.; Falkowski, P. G. 2003a. “Green Fluorescent Proteins in Caribbean Corals.” Limnol. Oceanogr., 48, 402-411.
- Mazel, C. H.; Fuchs, E. 2003b. “Contribution of Fluorescence to the Spectral Signature and Perceived Color of Corals.” Limnol. Oceanogr. , 48, 390-401.
- Riddle, D. R. 2003. “Effect of Narrow Bandwidth Light Sources on Coral Host and Zooxanthellae Pigments.” Advanced Aquarist; http://www.advancedaquarist.com/issues/nov2003/feature.htm.
- Riddle, D. R. 2007a. “Coral Coloration, Part 4: Red Fluorescent Pigments, a Preliminary Report of Effects of Various Environmental Factors and Color Mixing.” Advanced Aquarist; http://www.advancedaquarist.com/2007/2/aafeature.
- Riddle, D. R. 2007b. “Coral Coloration, Part 8: Blue and Green Fluorescence: Environmental Factors Affecting Fluorescent Pigmentation.” Advanced Aquarist; http://www.advancedaquarist.com/2007/11/aafeature.
- Rothschild, G. 2005. “White Balance and Your Aquarium.” Reefkeeping; http://reefkeeping.com/issues/2005-03/gr/index.php.
- Salih, A.; Larkum, A.; Cox, G.; Kühl, M.; Hoegh-Guldberg, O. 2000. Nature, 408, 850-853.
- Schlacher, T. A.; Stark, J.; Fischer, A. B. P. 2007. “”Evaluation of Artificial Light Regimes and Substrate Types for Aquaria Propagation of the Staghorn Coral Acropora solitaryensis.” Aquaculture, 269, 278-289.
- Schlichter, D.; Weber, W.; Fricke, H. W. 1985. “A Chromatophore System in the Hermatypic, Deep Water Coral Leptoseris fragilis (Anthozoa: Hexacorallia.” Mar. Biol., 89, 143-147.
0 Comments