

Over the last few years, two noteworthy lighting technologies have made their way to the aquarium industry and hobby. These are known as Light Emitting Diode (LED) and Light Emitting Plasma (LEP). At present, LED seems most popular, with many types of fixtures available. Although many aquarists have embraced these new technologies, the effects of LED and LEP on aquarium life, including corals, are unclear. Although it is known that corals can grow under virtually any light source, provided that light quality and quantity are sufficient, the effects of light spectrum on coral growth, coloration and physiology have only been documented for a few species (Wijgerde et al. 2012; D’Angelo et al. 2008; Mass et al. 2010b, respectively).
The most commonly used combination of LED lights produces light that is skewed towards to the blue part of the electromagnetic spectrum, whereas LEP emits a spectrum with a more balanced power distribution between colors. Here, we present the effects of these increasingly popular light sources, with different spectra, on the growth of ten commercially important coral species. In addition, we show how the spectra produced by LED and LEP affect coral growth at three irradiance levels frequently measured in culture systems and home aquaria. The data from this study can be used to optimize coral aquaculture protocols.
Materials and methods
Coral husbandry
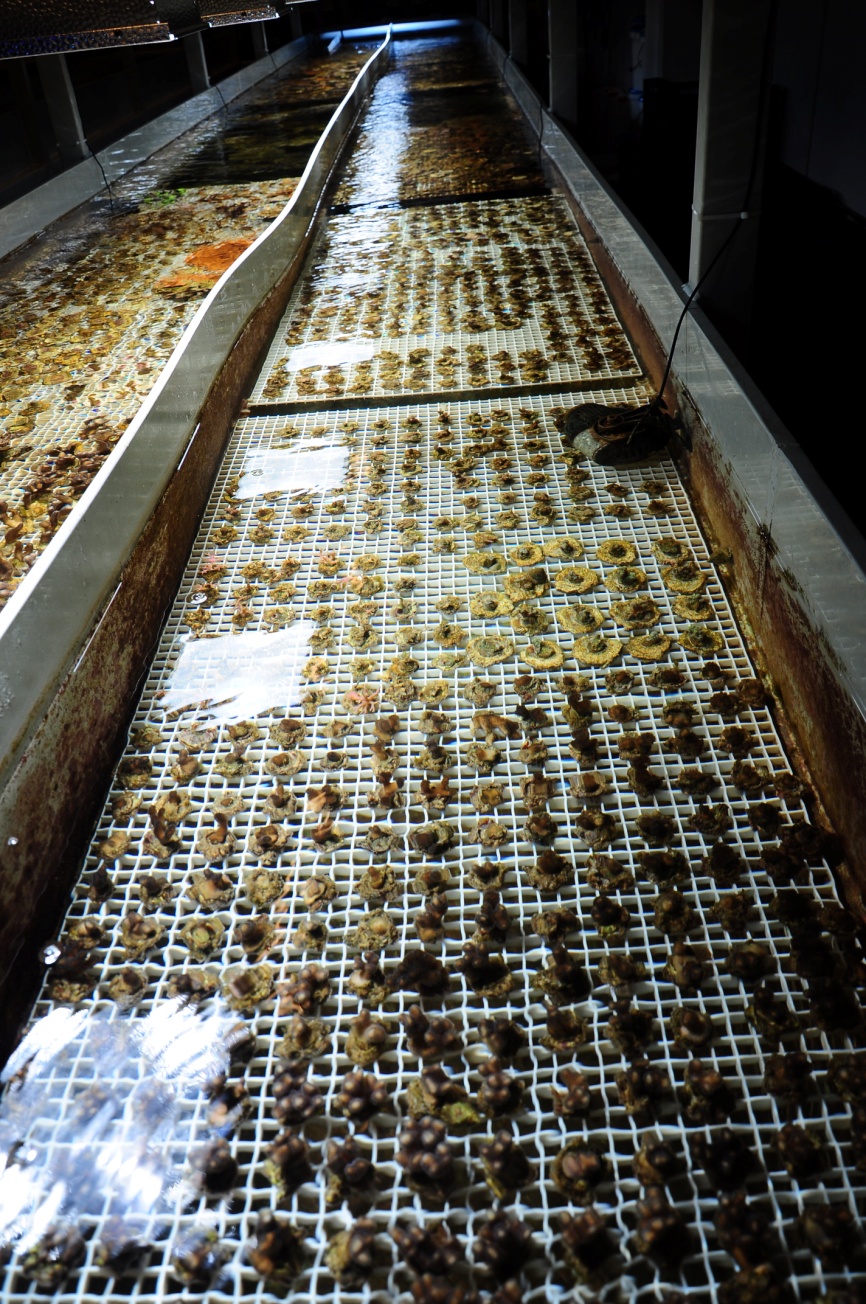
Corals were kept in two separate basins with a volume of 12 m3 each. One basin was provided with LED lighting, the other with LEP. Filtration in each system was provided by a 1,000 dm3 denitrification reactor (Dynamic Mineral Control or DyMiCo, US patent no. 6,830,681 B2, EcoDeco BV, Utrecht, The Netherlands). In addition, 250 kg of live rock (De Jong Marinelife BV, Spijk, The Netherlands) was cultured in each system to promote aerobic nitrification. Water flow was provided by two 1.5 HP electrical outboard motors (Torqeedo GmbH, Starnberg, Germany) per system. Water parameters were maintained at the following levels: salinity 35.4±0.4 g L-1, temperature 26.1±0.9°C, pH 8.2±0.1, NH4+-N 0.06±0.02 mg L-1 (4.29±1.43 µmol L-1), NO3–-N 0.03±0.01 mg L-1 (2.14±0.71 µmol L-1) , PO43--P 0.01±0.01 mg L-1 (0.32±0.32 µmol L-1), Ca2+ 480±22 mg L-1 (12.0±0.6 mmol L-1), Mg2+ 1608±17 mg L-1 (66.1±0.7 mmol L-1), alkalinity 3.51±0.20 mEq L-1. Each system was fed three times a week with a 100 ml mixture containing five different genera of live phytoplankton; Isochrysis, Pavlova, Tetraselmis, Thalassiosira and Nannochloropsis (Reed Mariculture Inc., Campbell, USA). Water flow rate around the corals was not measured, but was visually confirmed to be under 10 cm s-1 for all conditions.
Light treatments
To determine the effects of irradiance and light spectrum on growth, corals were subjected to six different treatments. Three groups (N=6 per group) were placed under a 480W LED fixture (Vertex Aquaristik GmbH, Cologne, Germany) at various horizontal distances from the lamp, effectively creating three different quantum irradiance intervals: 40-60 µmol m-2 s-1, 125-150 µmol m-2 s-1, 275-325 µmol m-2 s-1. Three other groups (N=6 per group) were placed under two 300W Pro 300 LEP fixtures (Gavita Nederland BV, Aalsmeer, The Netherlands), again at various horizontal distances from the lamps to obtain the same irradiance intervals as for the LED groups. As the LEP fixtures are point light sources, two fixtures were used to reach a more homogeneous light distribution. All corals were placed at a water depth of approximately 20 cm on white egg-crate (AquaHolland, Dordrecht, The Netherlands). The distances between the light fixtures and water surface were approximately 33 and 45 cm for LEP and LED, respectively. Irradiance was measured at 10 cm space intervals at approximately 20 cm water depth to determine irradiance levels using a LI-COR 192SA quantum underwater sensor (LI-COR, Lincoln, USA), which measures light in the photosynthetically active spectrum region (PAR, ~400-700 nm).
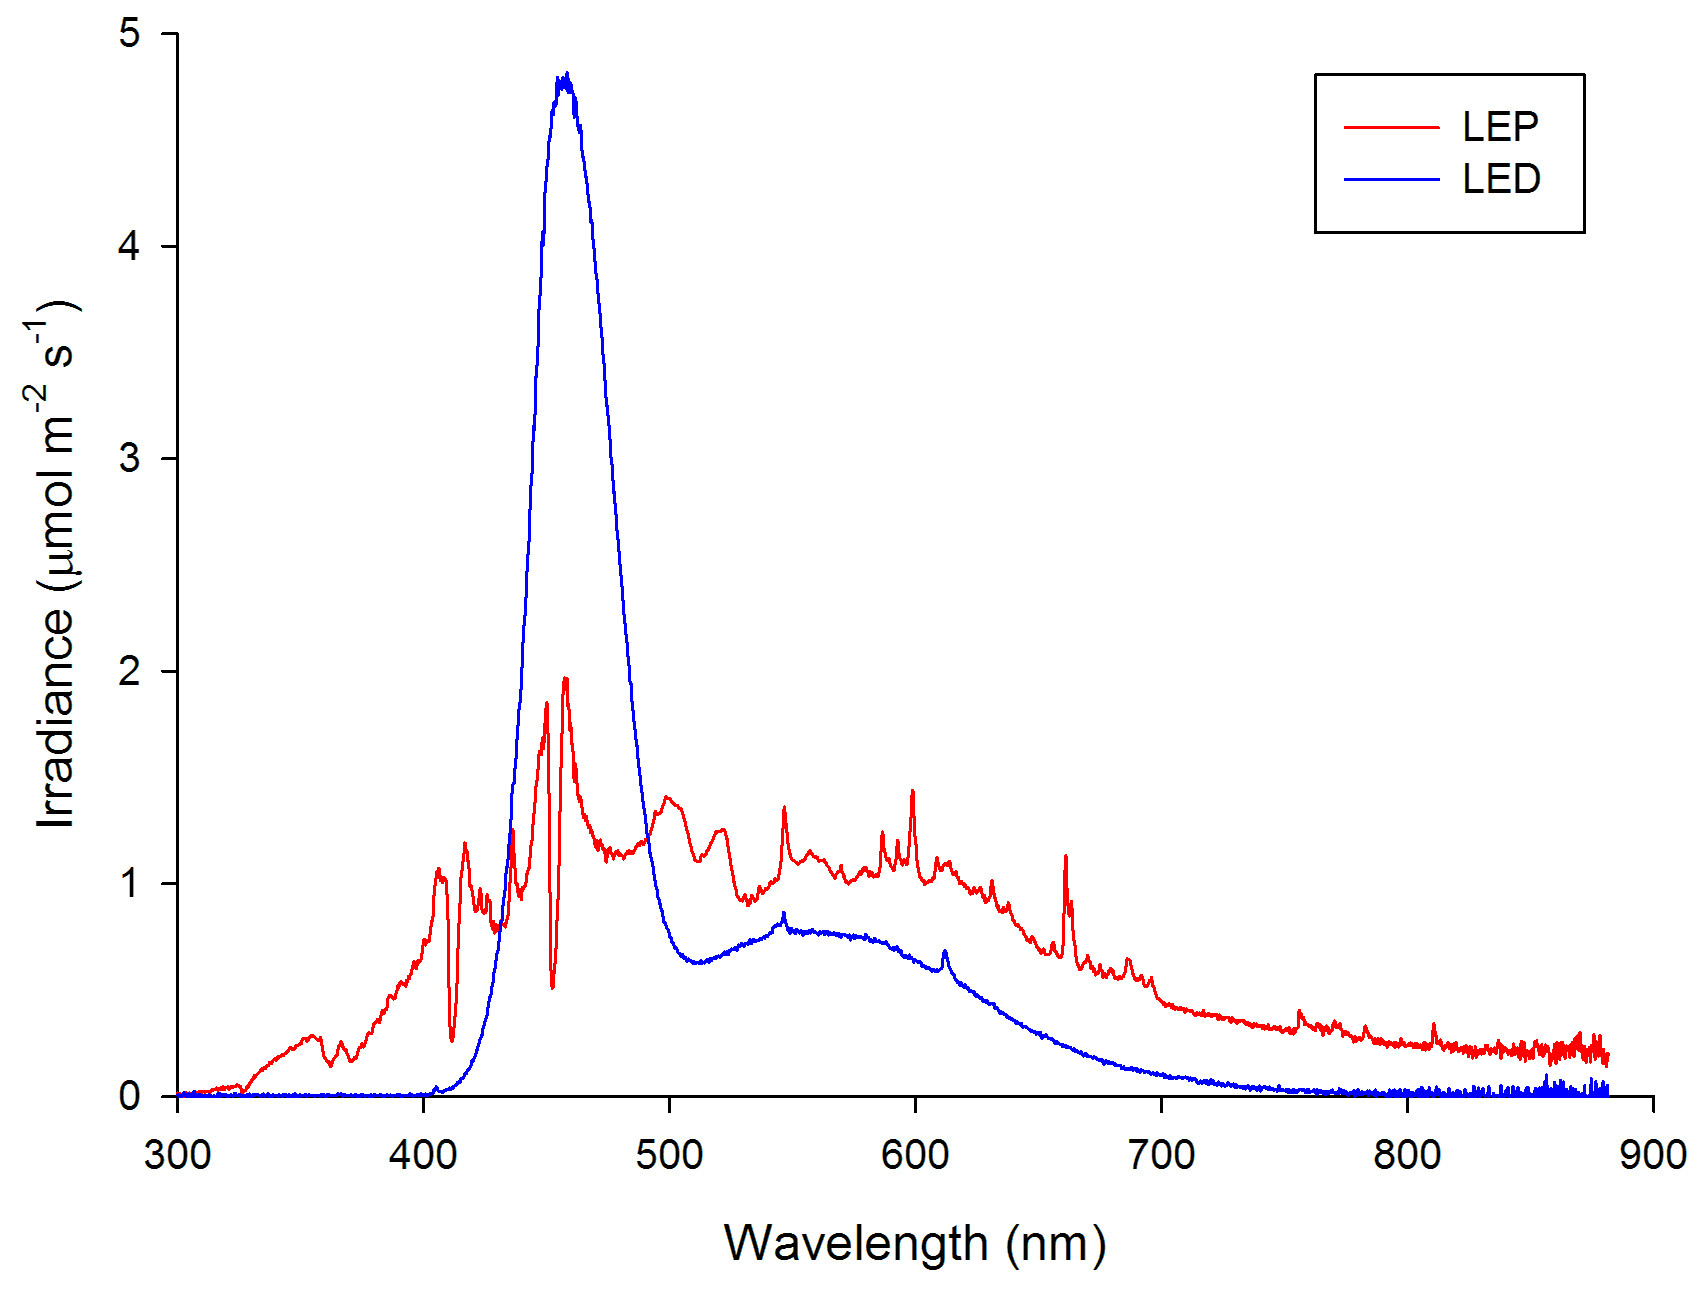
Spectral analysis of the LED (plotted in blue) and LEP (plotted in red) fixtures at an equal total irradiance of 300 µmol m-2 s-1, representative for all irradiance levels applied.
The spectral quality of the LED and LEP fixtures was measured with a calibrated Jaz spectrometer (Ocean Optics, Dunedin, USA) at 10 cm space intervals. The spectrometer was connected to a laptop computer and measured spectra were stored. All measurements were taken at a water depth of approximately 20 cm. The measured spectra differed significantly between LEP and LED. The LED fixture, consisting of three different LED types (white, blue and royal blue), emitted a spectrum with a strong blue peak around 458 nm. The LEP fixtures showed a balanced irradiance over the entire visible spectrum, with an exception of two dips around 412 and 452 nm. Irradiance of UV-A (315-400 nm) and infrared (>750-780 nm) was also measured. A spectral analysis was conducted for each of the three irradiance intervals applied, which demonstrated that spectrum was not affected by irradiance level. A 12:12h light:dark regime was used for all treatments. All treatments lasted 70 days.
Determination of coral growth rates
To determine coral growth rates, drip-dry weights of all colonies were determined at the start and end of the experiment using a CS200 balance (Ohaus Europe GmbH, Nänikon, Switzerland). All weights were determined before and after mounting on ceramic tiles, to obtain net and total weights, and combined epoxy/ceramic tile weights. At the end of the growth interval, total weights were corrected for the combined weights of the epoxy resin and ceramic tiles to obtain net weights. All tiles were cleaned thoroughly with seawater and a brush before every measurement, to minimize the effects of biofouling and sediment on total weights.
In a separate experiment, ten representative ceramic tiles were incubated in seawater for seven days at 26°C and weighed drip-dry to determine possible water uptake caused by the porous nature of the material. Tile weight increases due to water uptake were 3.72±0.76 g. All growth data were corrected for this artifact. To calculate specific growth rates (SGR) for each individual, the following formula was used:
SGR (day-1) = (lnWt – lnWt-1) / Δt
where Wt and Wt-1 are the final and initial coral net weights expressed in grams (g), and Δt is the growth interval in days. SGR is expressed in gram coral gram coral-1 day-1, which can be simplified as day-1.
Data analysis
Normality of data was tested by plotting residuals of each dataset versus predicted values, and by performing a Shapiro-Wilk test. Homogeneity of variances was determined using Levene’s test. A 10log transformation was used when data showed non-normality or heteroscedasticity. After transformation, all data were normally distributed and showed homogeneity of variance (P>0.050). A two-way factorial ANOVA was used to test the (interactive) effects of spectrum and irradiance on specific growth rates. A Bonferroni post-hoc test was used to determine differences between irradiance levels when only a main effect was detected. When an interactive effect was found, simple effects analysis was used to reveal its nature. A P<0.050 value was considered statistically significant. Statistical analysis was performed with SPSS Statistics 17.0 (IBM, Somers, USA). Graphs were plotted with SigmaPlot 11.0 (Systat software, San Jose, USA). All data are expressed as means + s.d. (standard deviation), unless stated otherwise.
Results
Family Pocilloporidae
Stylophora pistillata
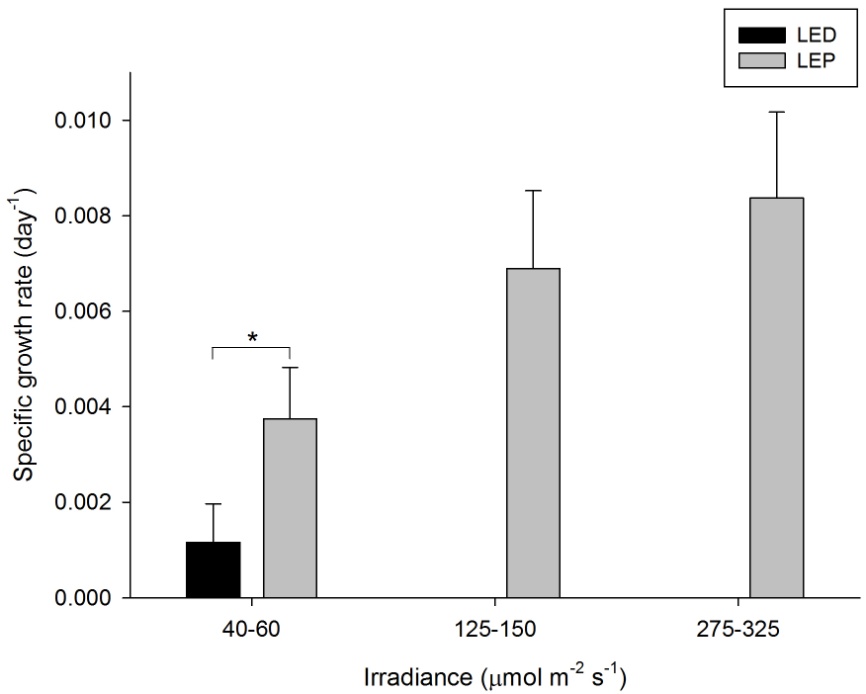
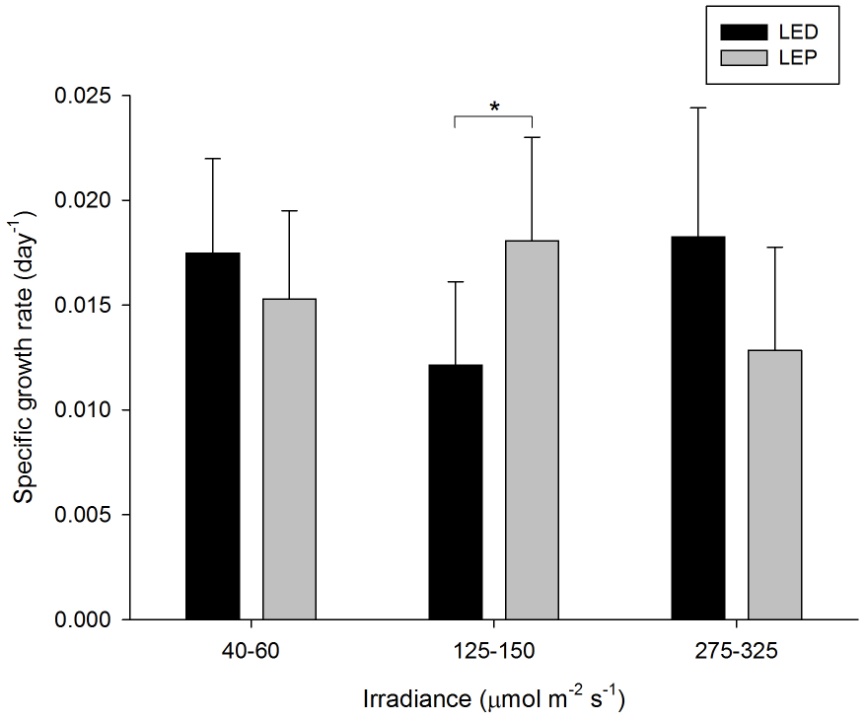
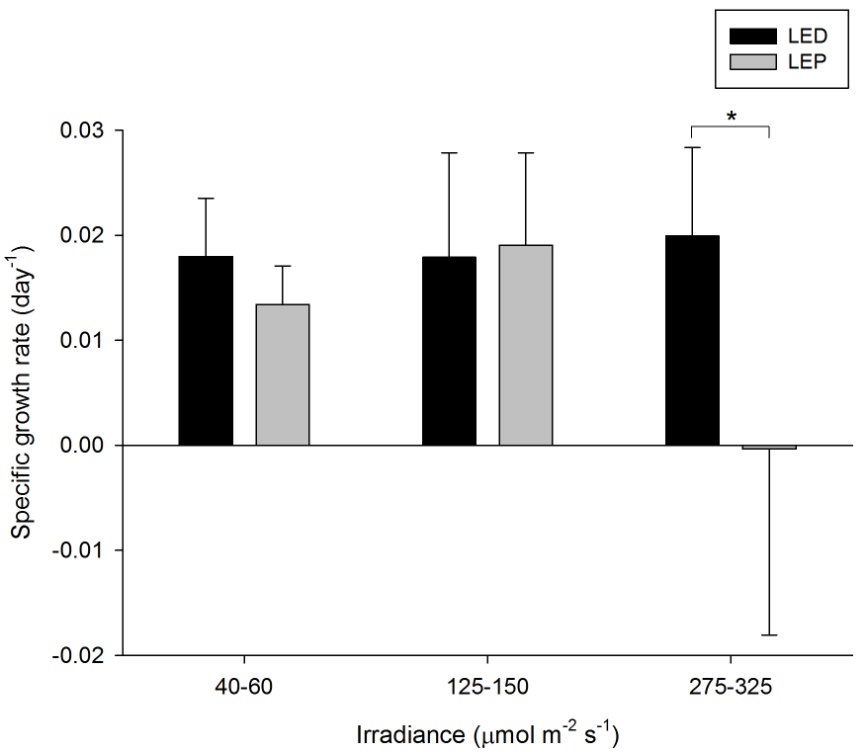
The specific growth rate (SGR) of this species was generally high, and varied from 0.003 to 0.011 day-1 (or 0.3 to 1.1% day-1). The survival rate was 100%. Both spectrum and irradiance exhibited a significant effect on growth (Table 1). In addition, a significant interactive effect between spectrum and irradiance was found (Table 1), which was reflected by the fact that irradiance had a positive effect on growth under LED only (F2,30=20.376, P=0.000). Under LEP, all irradiances resulted in comparable growth rates (F2,30=1.730, P=0.195). Conversely, the interaction was due to the fact that LEP resulted in higher growth at an irradiance of 40-60 and 125-150 µmol m-2 s-1 only (F1,30=38.455, P=0.000 and F1,30=8.066, P=0.008, respectively). At the highest irradiance level, no difference between LEP and LED was found (F1,30=2.219, P=0.147). Highest growth was achieved under LEP, under all irradiance levels, and LED, at the highest irradiance only. However, growth was most efficient under LEP at an irradiance of 40-60 µmol m-2 s-1, as the growth:irradiance ratio was highest under this treatment.
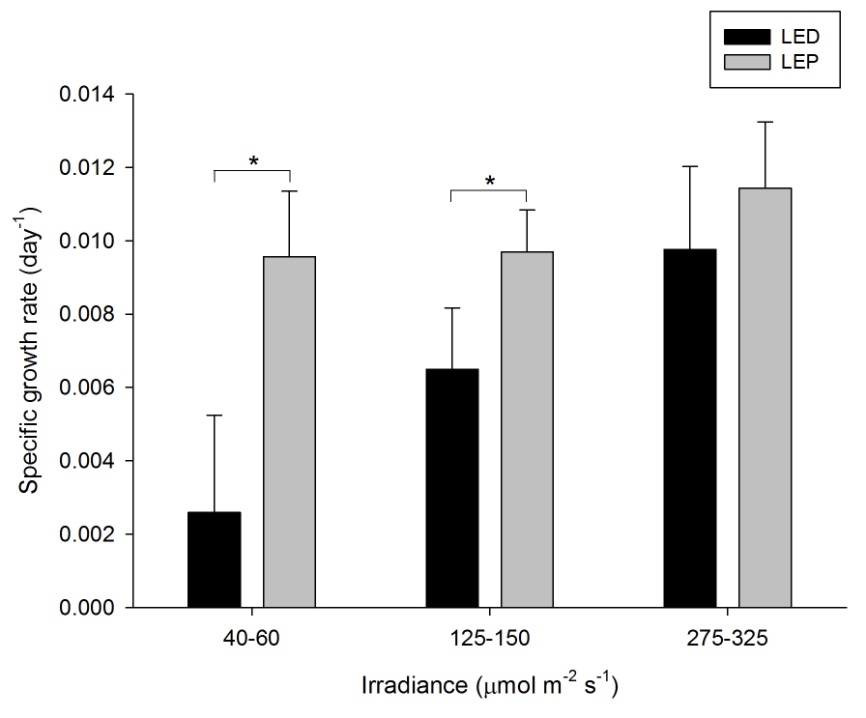
Specific growth rate of Stylophora pistillata under six different light regimes; LED and LEP at an irradiance of 40-60, 125-150 and 275-325 µmol m-2 s-1. Growth interval was 70 days. Data are means + standard deviation (N=6). *Indicates significant difference (P<0.050, simple effects). For clarity, not all significant differences are shown.
Pocillopora damicornis
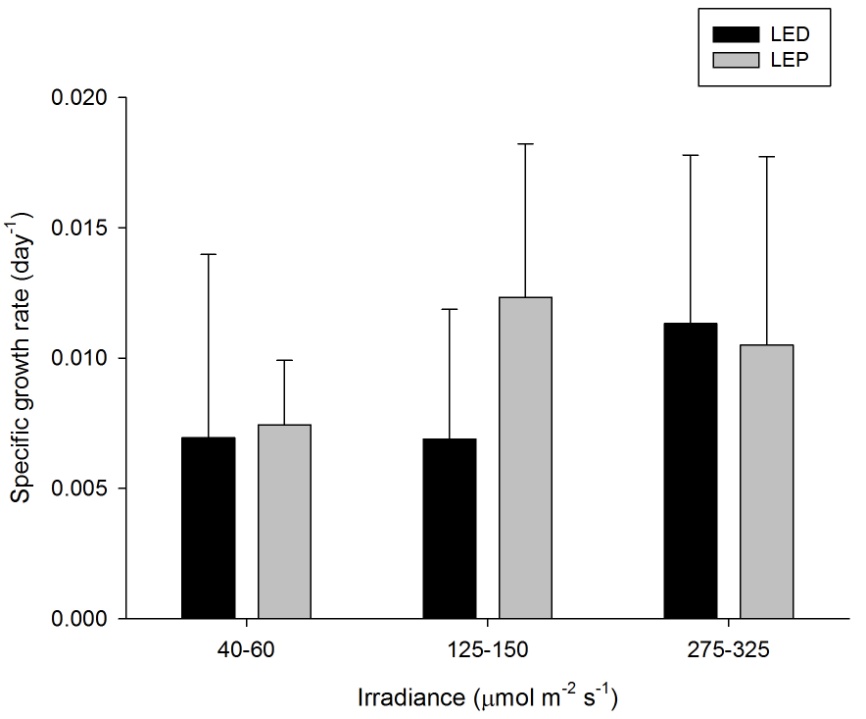
Growth of P. damicornis was highly variable, and varied from -0.004 to 0.005 day-1 (or -0.4 to 0.5% day-1). The survival rate was 50%; all corals under LED died after several months. A significant effect of spectrum on growth was found, in contrast to irradiance (Table 1), with higher growth under LEP at all irradiance levels (F1,30=8.903, P=0.006, F1,30=7.023, P=0.013, and F1,30=8.279, P=0.007, respectively). No interaction between spectrum and irradiance was found. Highest growth was achieved under LEP, regardless of irradiance. Growth under LEP was most efficient at an irradiance of 40-60 µmol m-2 s-1.
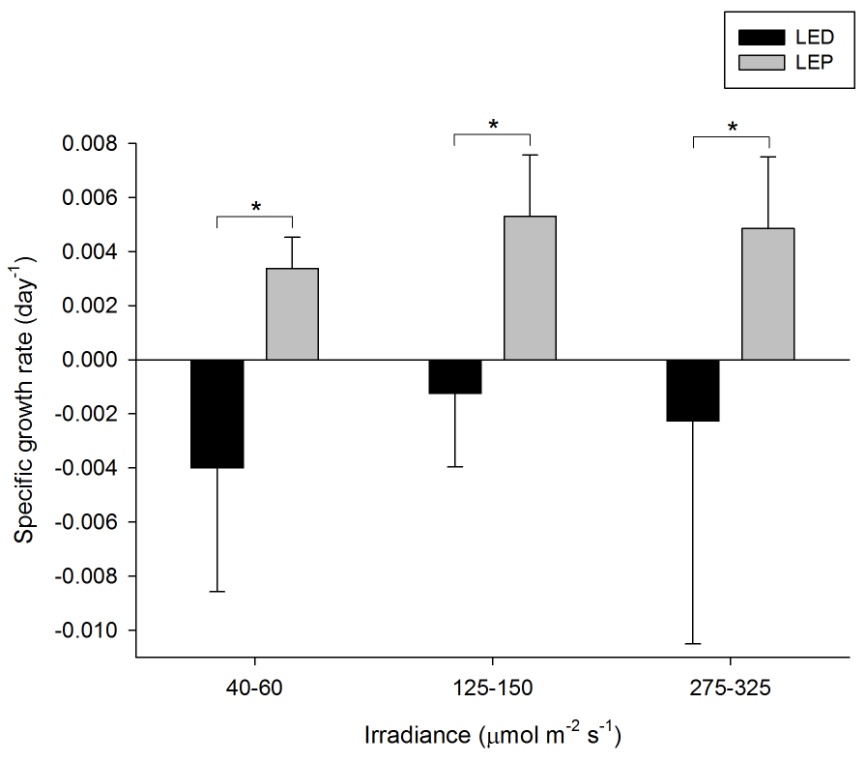
Specific growth rate of Pocillopora damicornis under six different light regimes; LED and LEP at an irradiance of 40-60, 125-150 and 275-325 µmol m-2 s-1. Growth interval was 70 days. Data are means + standard deviation (N=6). *Indicates significant difference (P<0.050, simple effects). For clarity, not all significant differences are shown.
Seriatopora hystrix
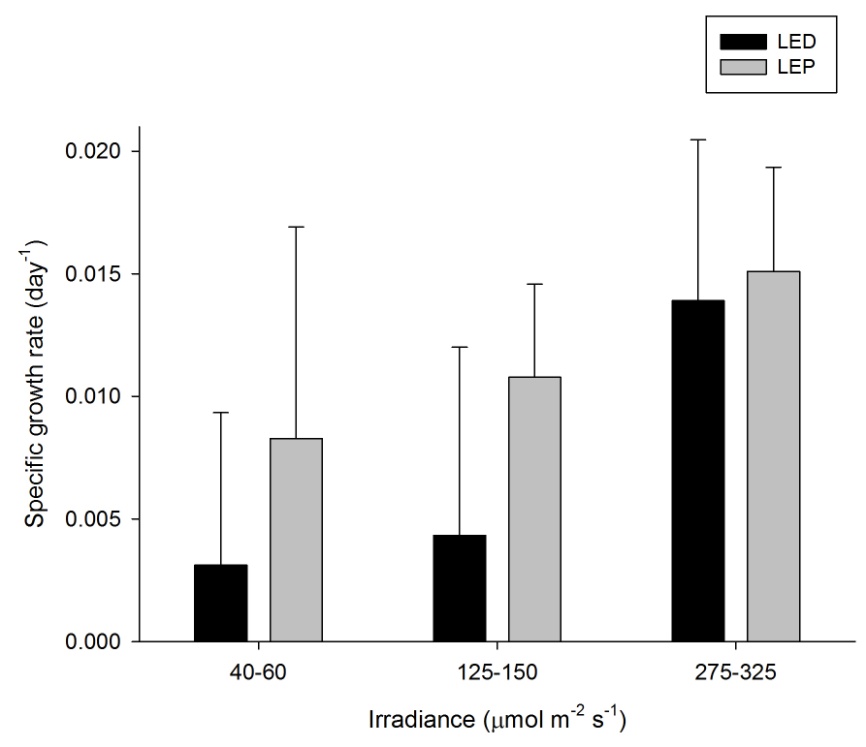
Specific growth rate of Seriatopora hystrix under six different light regimes; LED and LEP at an irradiance of 40-60, 125-150 and 275-325 µmol m-2 s-1. Growth interval was 70 days. Data are means + standard deviation (N=6). *Indicates significant difference (P<0.050, simple effects).
S. hystrix exhibited variable growth under the different treatments, ranging from 0.003 to 0.015 day-1 (or 0.3 to 1.5% day-1). The survival rate was 100%. Spectrum did not exert a significant effect on growth, in contrast to irradiance (Table 1). Generally, growth at an irradiance of 275-325 µmol m-2 s-1 was higher compared to 125-150 and 40-60 µmol m-2 s-1 (Bonferroni, P=0.043 and P=0.006, respectively). No interaction was found (Table 1). Highest growth was achieved at an irradiance of 275-325 µmol m-2 s-1, regardless of spectrum. Growth was most efficient at an irradiance of 40-60 µmol m-2 s-1, regardless of spectrum.
Family Acroporidae
Acropora millepora
Due to water turbulence in the LED system, several coral replicates were accidentally scrambled. As the fragmentation rocks were unlabeled, growth rates under two irradiance treatments (125-150 and 275-325 µmol m-2 s-1) could not be reliably calculated.
The growth of A. millepora varied from 0.001 to 0.008 day-1 (or 0.1 to 0.8% day-1). The survival rate was 100%. Both spectrum and irradiance had a significant effect on growth (Table 1). LEP resulted in higher growth compared to LED. For LEP, growth was higher at 125-150 and 275-325 µmol m-2 s-1 compared to 40-60 µmol m-2 s-1 (Bonferroni, P=0.000 and P=0.000, respectively). The interaction term could not be calculated due to missing data. In addition, LEP resulted in higher growth compared to LED under the lowest irradiance level (F1,15=5.836, P=0.029). Highest growth was achieved under LEP, at an irradiance of 125-150 to 275-325 µmol m-2 s-1. Growth was most efficient under LEP, at an irradiance of 40-60 µmol m-2 s-1.
Specific growth rate of Acropora millepora under six different light regimes; LED and LEP at an irradiance of 40-60, 125-150 and 275-325 µmol m-2 s-1. Growth interval was 70 days. Data are means + standard deviation (N=6). *Indicates significant difference (P<0.050, simple effects). For clarity, not all significant differences are shown.
Montipora aequituberculata
Montipora aequituberculata
Growth of this species was generally high, and varied from 0.012 to 0.037 day-1 (or 1.2 to 3.7% day-1). The survival rate was 86%. Both spectrum and irradiance exhibited an significant main effect on growth (Table 1). In addition, a significant interactive effect of spectrum and irradiance was found (Table 1), reflected by the fact that a significant, negative effect of irradiance was found for LED only (F2,25=11.903, P=0.000). Under LEP, all irradiances resulted in comparable growth rates (F2,25=1.327, P=0.283). Conversely, LED resulted in higher growth compared to LEP at an irradiance of 40-60 and 125-150 µmol m-2 s-1 only (F1,25=19.223, P=0.000 and F1,25=6.839, P=0.015, respectively). At the highest irradiance of 275-325 µmol m-2 s-1, no significant growth difference between LED and LEP was found (F1,25=0.000, P=0.984). Growth was highest and most efficient under LED, at an irradiance of 40-60 µmol m-2 s-1.
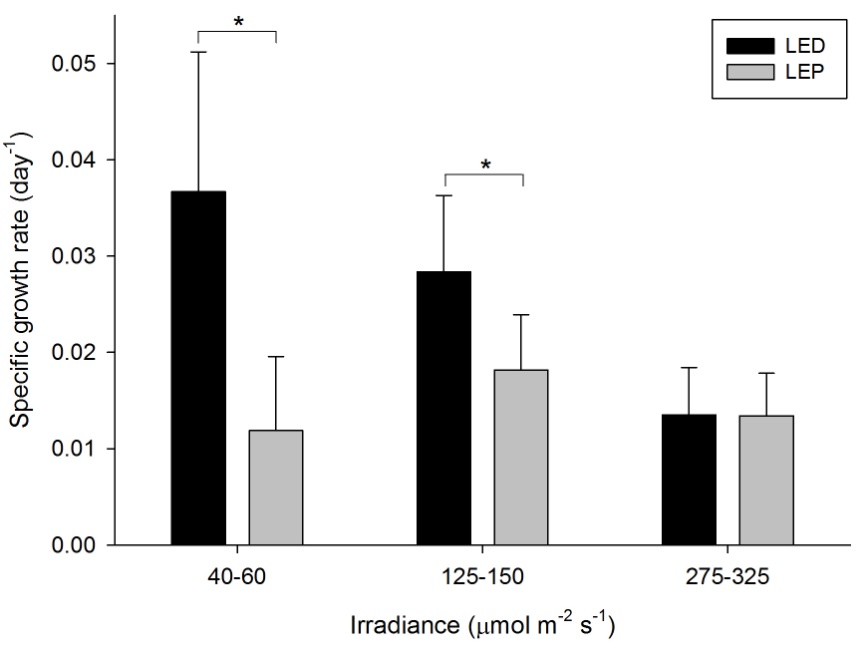
Specific growth rate of Montipora aequituberculata under six different light regimes; LED and LEP at an irradiance of 40-60, 125-150 and 275-325 µmol m-2 s-1. Growth interval was 70 days. Data are means + standard deviation (N=6). *Indicates significant difference (P<0.050, simple effects). For clarity, not all significant differences are shown.
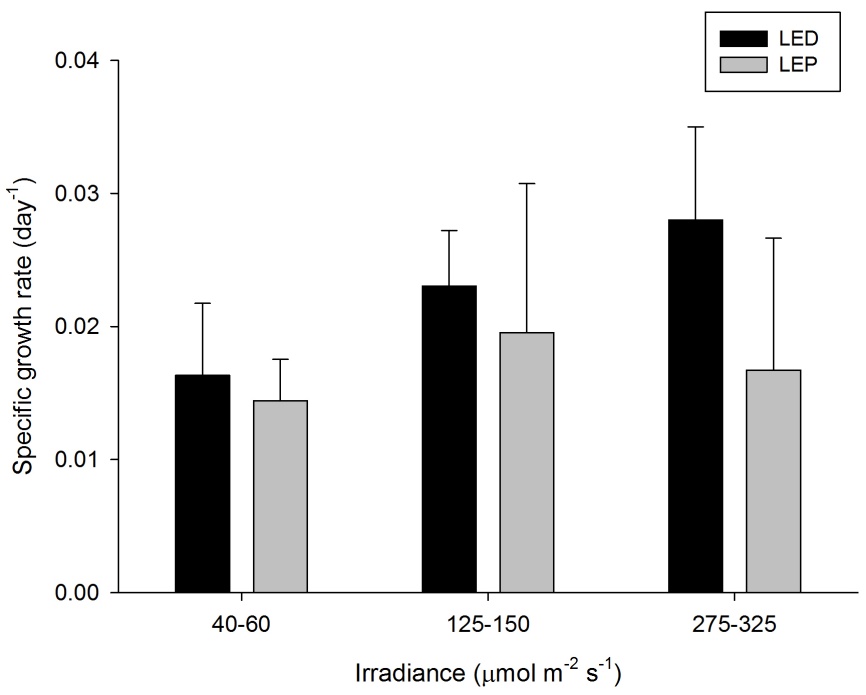
Specific growth rate of Montipora digitata under six different light regimes; LED and LEP at an irradiance of 40-60, 125-150 and 275-325 µmol m-2 s-1. Growth interval was 70 days. Data are means + standard deviation (N=6). *Indicates significant difference (P<0.050, simple effects). For clarity, not all significant differences are shown.
M. digitata showed high growth rates of 0.014 to 0.028 day-1 (or 1.4 to 2.8% day-1). The survival rate was 81%. Neither spectrum nor irradiance exhibited a significant effect on growth rates (Table 1). In addition, no significant interaction was found (Table 1). Growth tended to be highest at 275-325 under LED, and was most efficient at an irradiance of 40-60 µmol m-2 s-1, regardless of spectrum.
Family Faviidae
Caulastrea furcata
This species exhibited growth rates of 0.007 to 0.014 day-1 (or 0.7 to 1.4% day-1). The survival rate was 100%. Neither spectrum nor irradiance exhibited a significant effect on growth rates (Table 1). No significant interaction between spectrum and irradiance was found (Table 1). There is no apparent treatment at which growth was highest. It was most efficient at an irradiance of 40-60 µmol m-2 s-1, with a tendency towards LEP.

Specific growth rate of Caulastrea furcata under six different light regimes; LED and LEP at an irradiance of 40-60, 125-150 and 275-325 µmol m-2 s-1. Growth interval was 70 days. Data are means + standard deviation (N=6). *Indicates significant difference (P<0.050, simple effects).
Family Mussidae
Acanthastrea lordhowensis
Acanthastrea lordhowensis
A. lordhowensis exhibited growth rates of 0.012 to 0.018 day-1 (or 1.2 to 1.8% day-1). The survival rate was 100%. Neither spectrum nor irradiance exhibited a significant effect on growth rates (Table 1). However, a significant interaction between spectrum and irradiance was found (Table 1). This was due to the fact that LEP resulted in higher growth at an intermediate irradiance of 125-150 µmol m-2 s-1 only (F1,30=4.523, P=0.042). At an irradiance of 40-60 and 275-325 µmol m-2 s-1, no growth differences between LEP and LED were found (F1,30=0.617, P=0.438 and F1,30=3.778, P=0.061, respectively). There is no apparent treatment at which growth was highest. It was most efficient at an irradiance of 40-60 µmol m-2 s-1, regardless of spectrum.
Specific growth rate of Acanthastrea lordhowensis under six different light regimes; LED and LEP at an irradiance of 40-60, 125-150 and 275-325 µmol m-2 s-1. Growth interval was 70 days. Data are means + standard deviation (N=6). *Indicates significant difference (P<0.050, simple effects). For clarity, not all significant differences are shown.
Family Merulinidae
Hydnophora grandis

Hydnophora grandis
H. grandis showed quite variable growth rates, ranging from 0.007 to 0.012 day-1 (or 0.7 to 1.2% day-1). The survival rate was 89%. Neither spectrum nor irradiance exhibited a significant effect on growth rates (Table 1). No significant interaction was found (Table 1). There is no apparent treatment at which growth was highest. Again, growth efficiency was maximized at the lowest irradiance of 40-60 µmol m-2 s-1, regardless of spectrum.
Specific growth rate of Hydnophora grandis under six different light regimes; LED and LEP at an irradiance of 40-60, 125-150 and 275-325 µmol m-2 s-1. Growth interval was 70 days. Data are means + standard deviation (N=6). *Indicates significant difference (P<0.050, simple effects).
Family Poritidae
Porites cylindrica
Specific growth rate of Porites cylindrica under six different light regimes; LED and LEP at an irradiance of 40-60, 125-150 and 275-325 µmol m-2 s-1. Growth interval was 70 days. Data are means + standard deviation (N=6). *Indicates significant difference (P<0.050, simple effects). For clarity, not all significant differences are shown.
P. cylindrica exhibited extreme differences in growth rate, ranging from 0.000 to 0.020 day-1 (or 0.0 to 2.0% day-1). The survival rate was 97%. Spectrum had a significant effect on growth, whereas irradiance did not (Table 1). Spectrum and irradiance also exerted an interactive effect on growth rates (Table 1). The interactive effect was reflected by the fact that growth under LED was significantly higher compared to LEP at the highest irradiance only (F1,29=11.998, P=0.002). At the two lower irradiance levels of 40-60 and 125-150 µmol m-2 s-1, no growth differences between LEP and LED were found (F1,29=0.676, P=0.418 and F1,29=0.041, P=0.840, respectively). Growth was highest under LED, at any irradiance, and under LEP, at the two lower irradiances tested. Finally, growth efficiency was maximized at the lowest irradiance of 40-60 µmol m-2 s-1, regardless of spectrum.
| *Indicates significant effect P<0.050). | ||||
| Factor | SGR | F | df | P |
|---|---|---|---|---|
| Stylophora pistillata | ||||
| Spectrum | 36.966 | 1 | 0.000* | |
| Irradiance | 16.219 | 2 | 0.000* | |
| Spectrum * Irradiance | 5.887 | 2 | 0.007* | |
| Pocillopora damicornis | ||||
| Spectrum | 24.147 | 1 | 0.000* | |
| Irradiance | 0.935 | 2 | 0.404 | |
| Spectrum * Irradiance | 0.029 | 2 | 0.971 | |
| Seriatopora hystrix | ||||
| Spectrum | 3.899 | 1 | 0.058 | |
| Irradiance | 6.306 | 2 | 0.005* | |
| Spectrum * Irradiance | 0.535 | 2 | 0.592 | |
| Acropora millepora | ||||
| Spectrum | 5.836 | 1 | 0.029* | |
| Irradiance | 13.112 | 2 | 0.001* | |
| Spectrum * Irradiance | – | – | – | |
| Montipora aequituberculata | ||||
| Spectrum | 19.710 | 1 | 0.000* | |
| Irradiance | 8.076 | 2 | 0.002* | |
| Spectrum * Irradiance | 6.559 | 2 | 0.005* | |
| Montipora digitata | ||||
| Spectrum | 4.178 | 1 | 0.053 | |
| Irradiance | 2.750 | 2 | 0.085 | |
| Spectrum * Irradiance | 1.084 | 2 | 0.355 | |
| Caulastrea furcata | ||||
| Spectrum | 0.590 | 1 | 0.448 | |
| Irradiance | 2.004 | 2 | 0.152 | |
| Spectrum * Irradiance | 2.372 | 2 | 0.111 | |
| Acanthastrea lordhowensis | ||||
| Spectrum | 0.121 | 1 | 0.730 | |
| Irradiance | 0.219 | 2 | 0.804 | |
| Spectrum * Irradiance | 4.399 | 2 | 0.021* | |
| Hydnophora grandis | ||||
| Spectrum | 0.675 | 1 | 0.419 | |
| Irradiance | 1.151 | 2 | 0.332 | |
| Spectrum * Irradiance | 0.807 | 2 | 0.457 | |
| Porites cylindrica | ||||
| Spectrum | 5.832 | 1 | 0.022* | |
| Irradiance | 2.377 | 2 | 0.111 | |
| Spectrum * Irradiance | 3.714 | 2 | 0.037* | |
Discussion
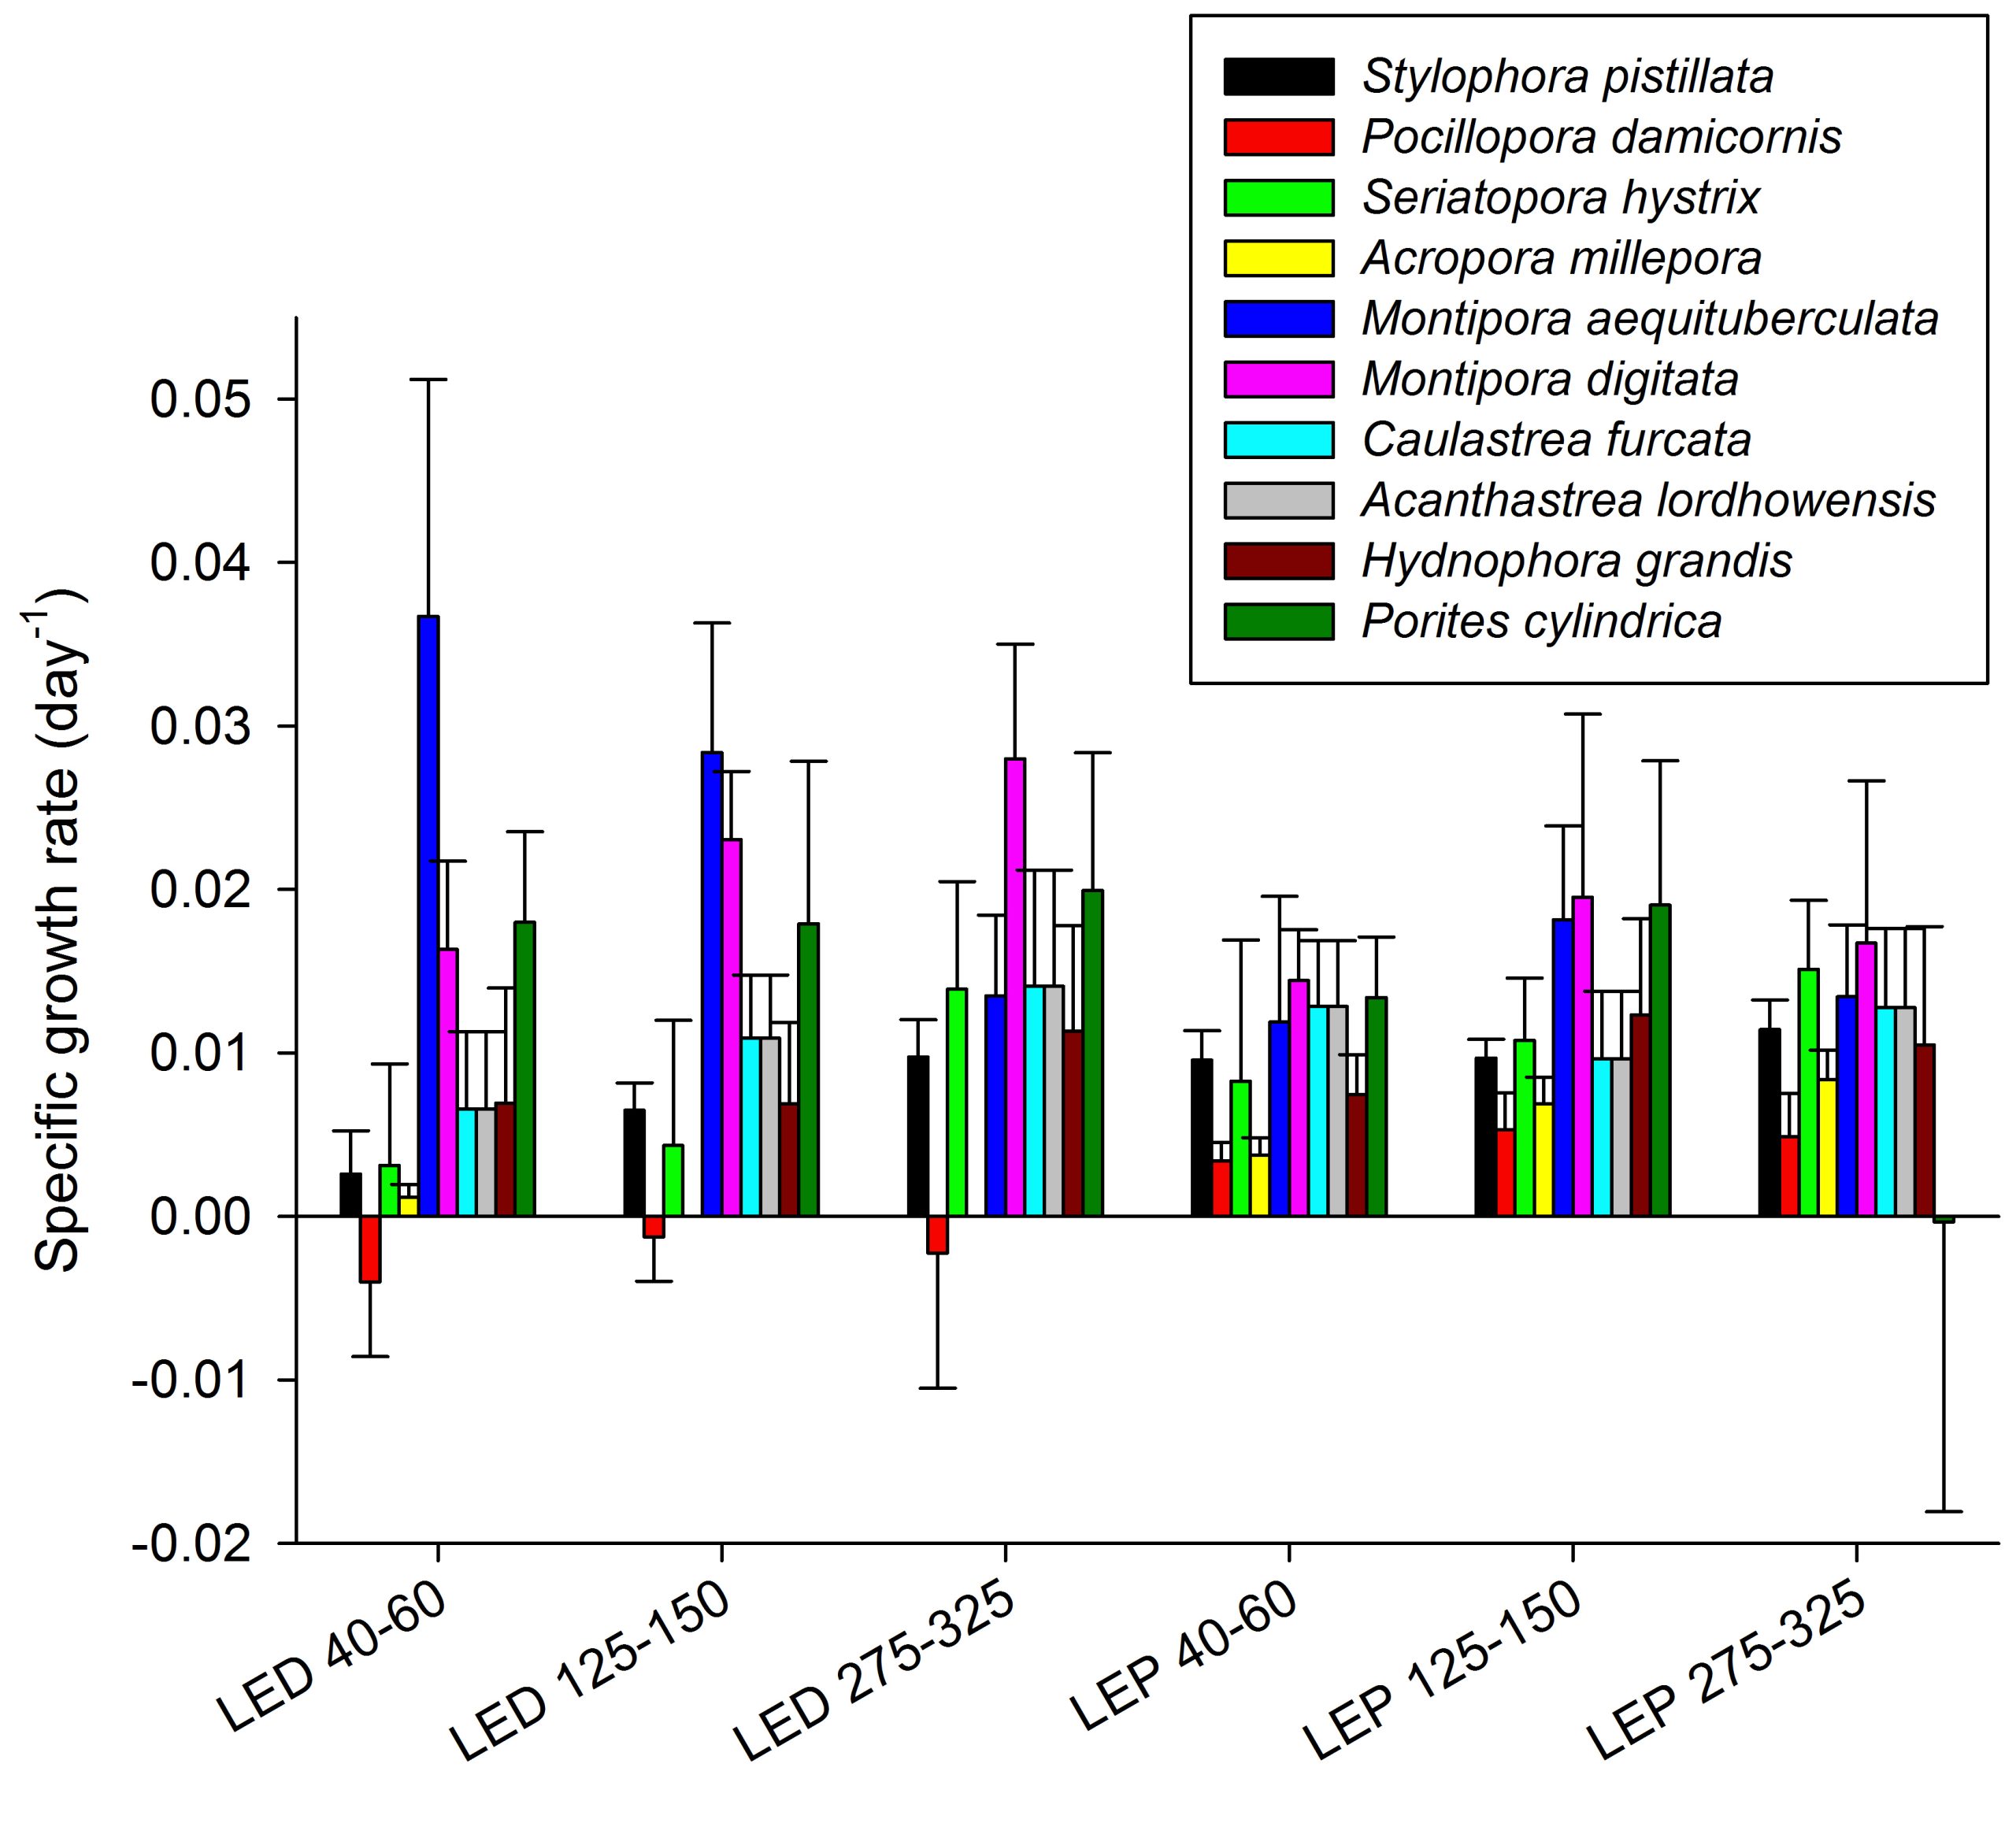
Specific growth rates of all coral species under six different light regimes; LED and LEP at an irradiance of 40-60, 125-150 and 275-325 µmol m-2 s-1. Growth interval was 70 days. Data are means + standard deviation (N=6).
The results obtained during this study reveal that the effects of spectrum and irradiance on coral growth are highly species dependent, which underscores the need for species-specific optimization of aquaculture. At present, different coral species are aquacultured under similar conditions, which clearly is not optimal.
Spectrum
The results above demonstrate that different coral species exhibit different growth rates under the two light spectra provided. Interestingly, a positive effect of irradiance on the growth of Stylophora pistillata was only found for the blue-dominant LED spectrum. Under a more balanced LEP spectrum, containing more red and less blue light, S. pistillata already maximized its growth at the lowest irradiance. It is unclear why this occurred, but it may be related to the photosynthetic pigment complement of the specimens used, which could be chromatically adapted to shallow-water conditions where red light is abundant. Indeed, these corals were collected from shallow water in Eilat, Israel. In the same way, chromatic adaptation of the symbiotic zooxanthellae of Acropora millepora to a high-red spectrum may explain why this species grew faster under LEP at the lowest irradiance applied.
Pocillopora damicornis showed negative growth rates under all LED treatments, which was a result of tissue necrosis. It is unclear why this occurred, but it may have been due to limiting water flow rate. As only moderate water flow rates were measured in the systems (below 10 cm s-1), an accumulation of photosynthetic oxygen and heat within the tissue may have resulted in mortality (Fabricius 2006; Mass et al. 2010a). It is known that highly energetic blue light stimulates photosynthesis in zooxanthellae most efficiently (Halldal 1969), which may require higher water flow rates to remove excess oxygen and heat from coral tissue. It is however unclear why the other species in this study did not show such an adverse effect to the high blue LED spectrum.
Montipora aequituberculata exhibited highest growth rates under LED at low irradiance, which contrasts with the results of other species. In a similar way to S. pistillata and A. millepora, this species may be chromatically adapted to a high blue spectrum, which is found in the wild at depths below approximately 10 meters.
Porites cylindrica showed virtually no growth under LEP at the highest irradiance, which was due to tissue necrosis in four replicates, resulting in the death of one colony. If water flow rate was low enough to promote light stress, a similar growth impairment would be expected under LED, which did not occur. It is possible that other, local disturbances may have played a role in the demise of this group.
All other species investigated in this study showed no clear preference for one particular spectrum, which may be a reflection of the plasticity of their zooxanthellae, in terms of chromatic adaptation.
Irradiance
Generally, the results reveal that the effect of irradiance on coral growth is less prominent than often believed. For only three out of the ten species investigated (S. pistillata, Seriatopora hystrix and A. millepora), a positive effect of irradiance was found (Table 1). In addition, the effect of irradiance was saturating, i.e. a higher irradiance did not result in a proportional increase in specific growth rates. For example, a six-fold increase in irradiance resulted in only a 3.8-fold growth increase of S. pistillata. For A. millepora, the same increase in irradiance resulted in a 2.2-fold growth increase. This saturating relationship between irradiance and coral growth has been documented before (e.g. Schutter et al. 2008), and is due to the fact that other factors become growth limiting at higher irradiance, which may include water flow rate, nutrients, alkalinity and planktonic food. As irradiance has a saturating effect, it naturally follows that coral aquaculture is most efficient at lower irradiances, where the relationship between irradiance and growth is still linear. This insight is crucial for aquarists who aspire to grow corals efficiently. Table 2 summarizes the conditions which result in highest and most efficient growth for each species, to aid the aquarist in selecting optimal growth conditions for several scleractinian coral species. It shows that most efficient growth is invariably attained at the lowest irradiance applied.
Although the beneficial effect of light on growth was limited, it is important to state that the colonies used in this study were small enough to prevent self-shading. When colonies increase in size, a self-shading effect occurs where the lower and inner parts of colonies receive less light as higher branches create shade (Titlyanov 1991). For such colonies, a higher beneficial effect of light on growth is expected. As aquarium corals are usually kept relatively small, self-shading effects may be less prominent in captivity.
| Species | Highest growth condition(s) | Most efficient growth condition(s) |
|---|---|---|
| Stylophora pistillata | LED 275-325, LEP 40-325 | LEP 40-60 |
| Pocillopora damicornis | LEP 40-325 | LEP 40-60 |
| Seriatopora hystrix | LED/LEP 275-325 | LED/LEP 40-60 |
| Acropora millepora | LEP 125-325 | LEP 40-60 |
| Montipora aequituberculata | LED 40-60 | LED 40-60 |
| Montipora digitata | LED 275-325 | LED/LEP 40-60 |
| Caulastrea furcata | unclear | LEP 40-60 |
| Acanthastrea lordhowensis | unclear | LED/LEP 40-60 |
| Hydnophora grandis | unclear | LED/LEP 40-60 |
| Porites cylindrica | LED 40-325, LEP 40-150 | LED/LEP 40-60 |
Coloration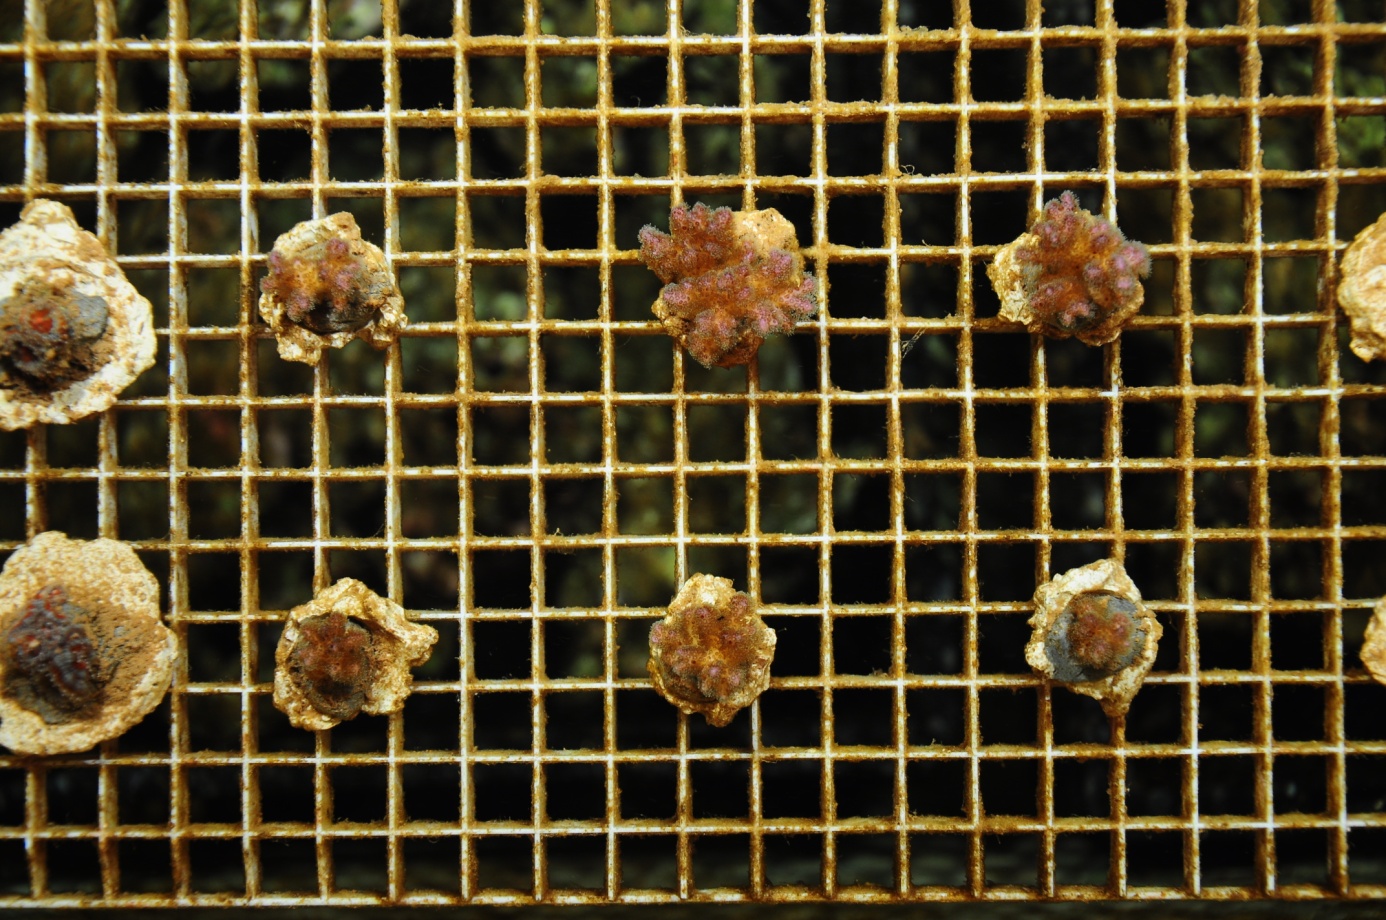
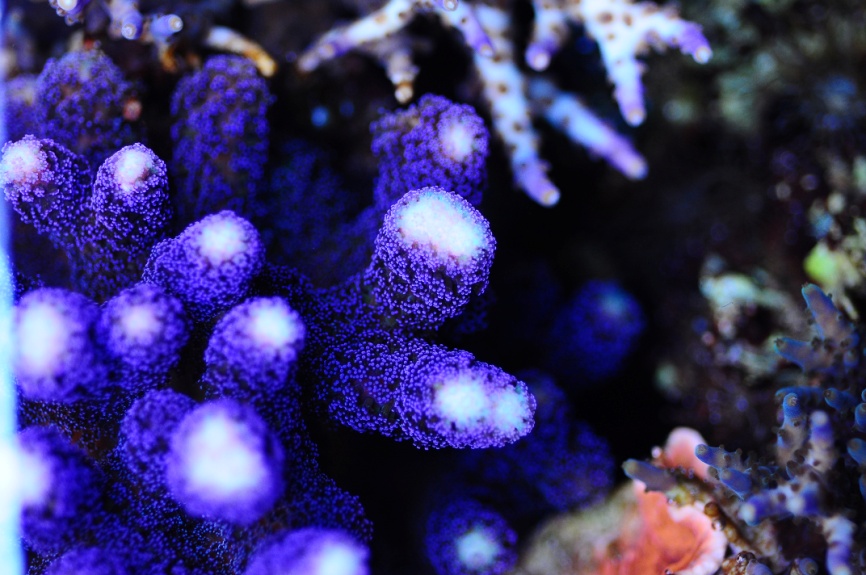
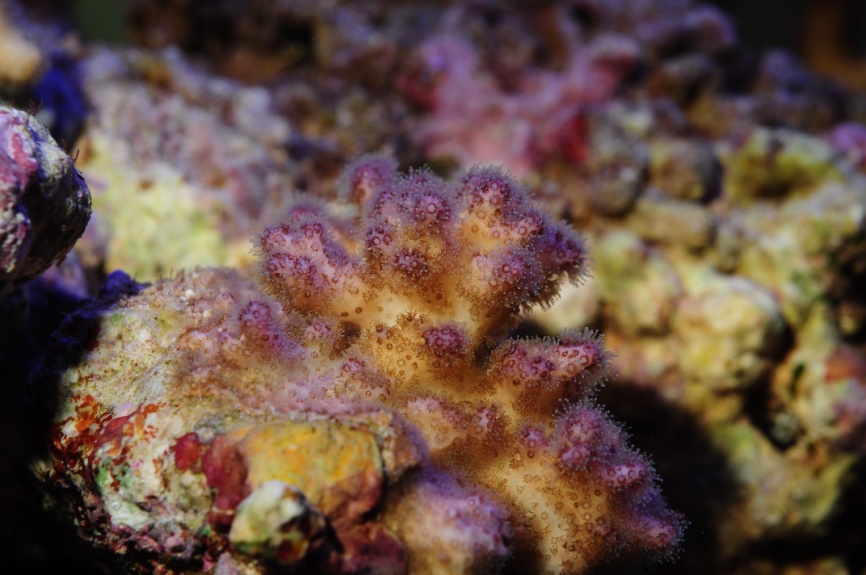
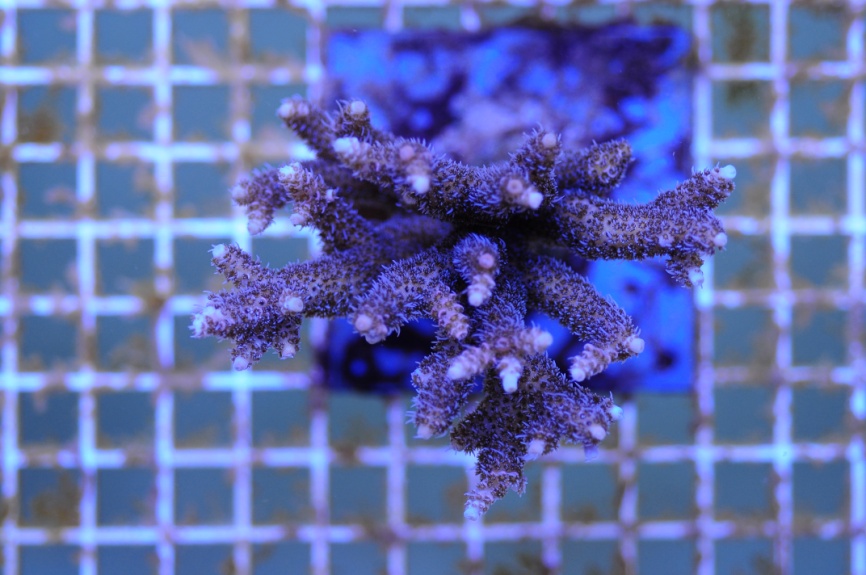
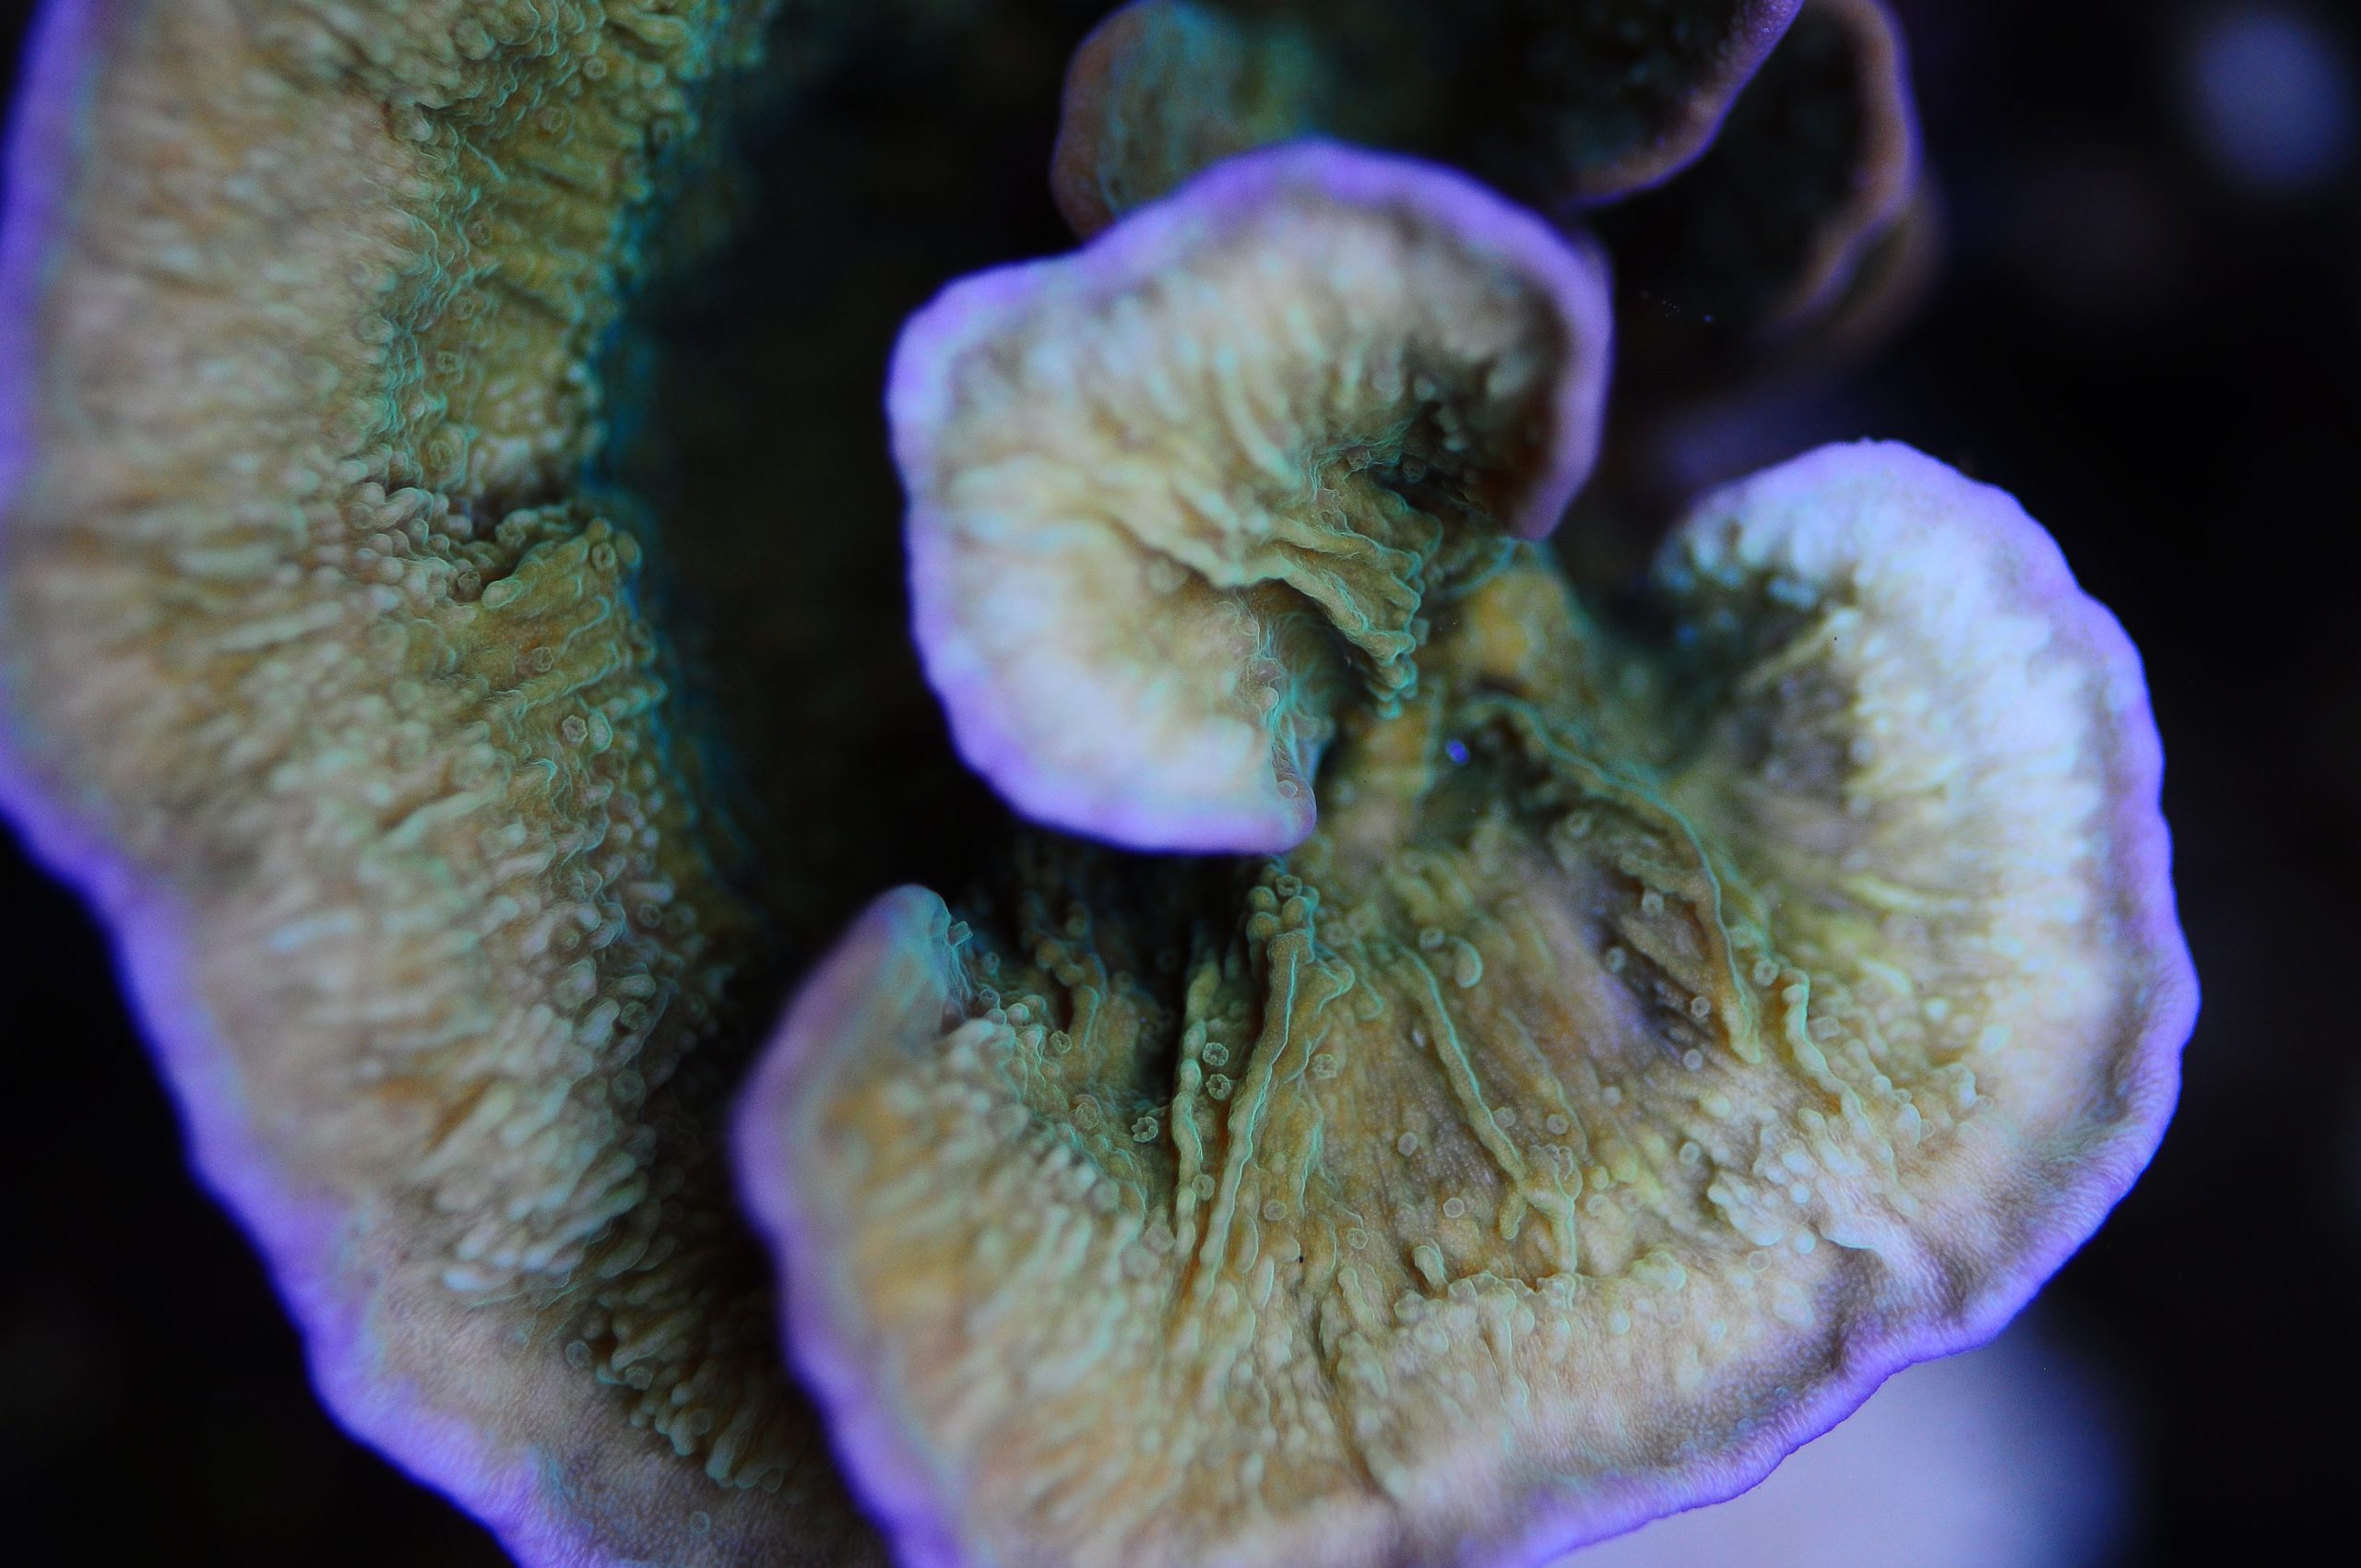
Next to growth rate, coloration is important to the economic viability of coral aquaculture. Although its effect on coral growth is limited, light intensity is known to affect the pigmentation of corals and their symbiotic dinoflagellates. A recent study by D’Angelo et al. (2008) demonstrated that high irradiance, particularly in the blue spectrum region, enhances the coloration of certain corals by stimulating the production of fluorescent proteins and chromoproteins. This can be explained by the fact that fluorescent proteins protect the coral against oxygen radicals, which are produced in higher amounts when photosynthesis is more active (Bou-Abdallah et al. 2006). At the same time, high irradiance often results in decreased photopigment production (e.g. chlorophylls) by zooxanthellae, reducing the brownish appearance of the coral (Dubinsky et al. 1984). Therefore, exposing corals to high irradiance levels can be an important step in the aquaculture process, as aquarists favor brightly colored corals. A good strategy is to culture corals under low irradiance levels, followed by a short period of high irradiance when they have reached marketable size. As corals rapidly adjust their pigment complement in response to light intensity (i.e. within approximately two weeks), this approach is feasible.
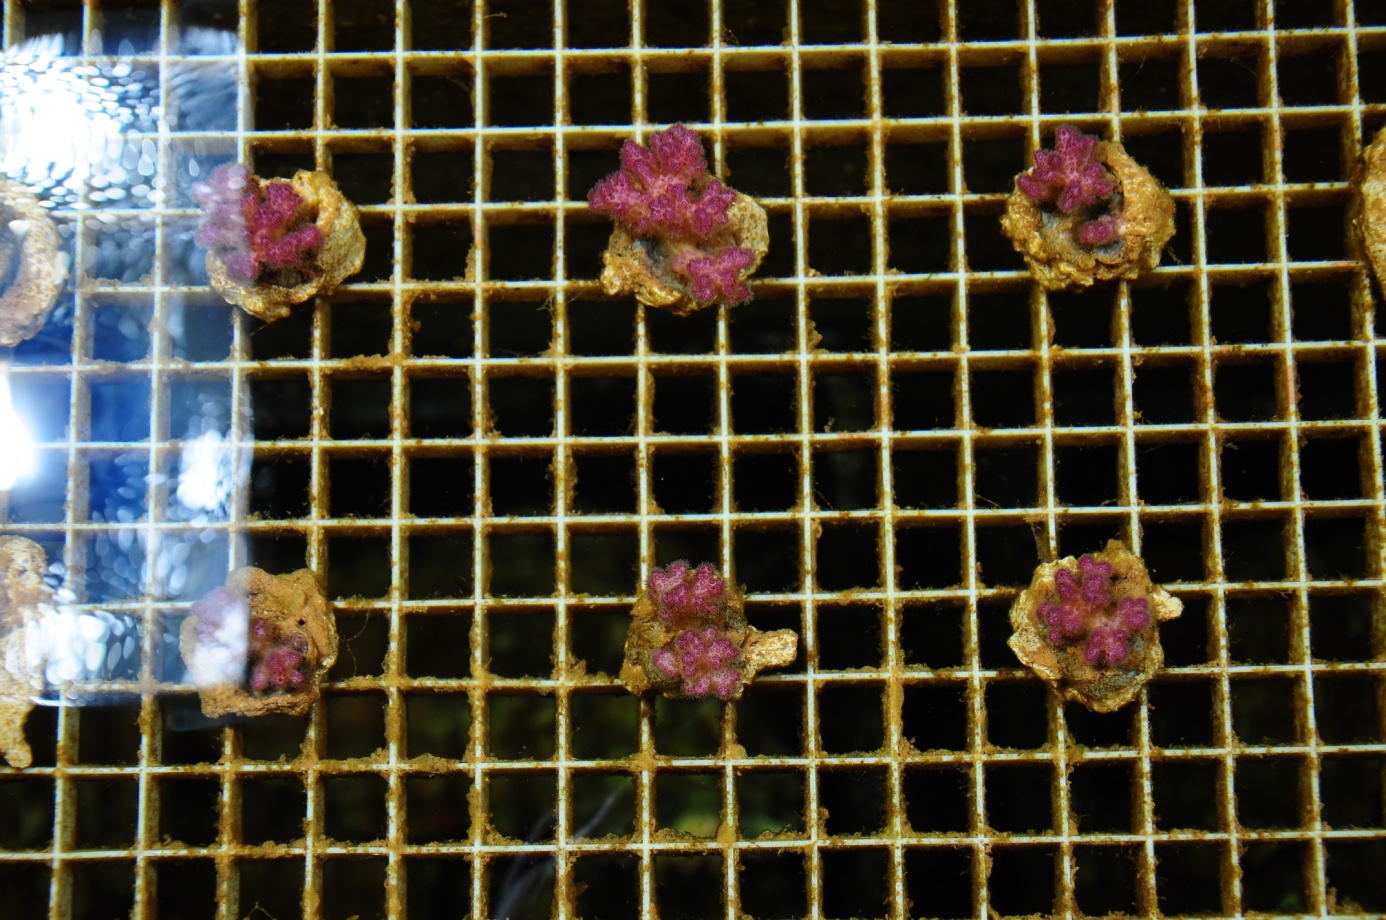
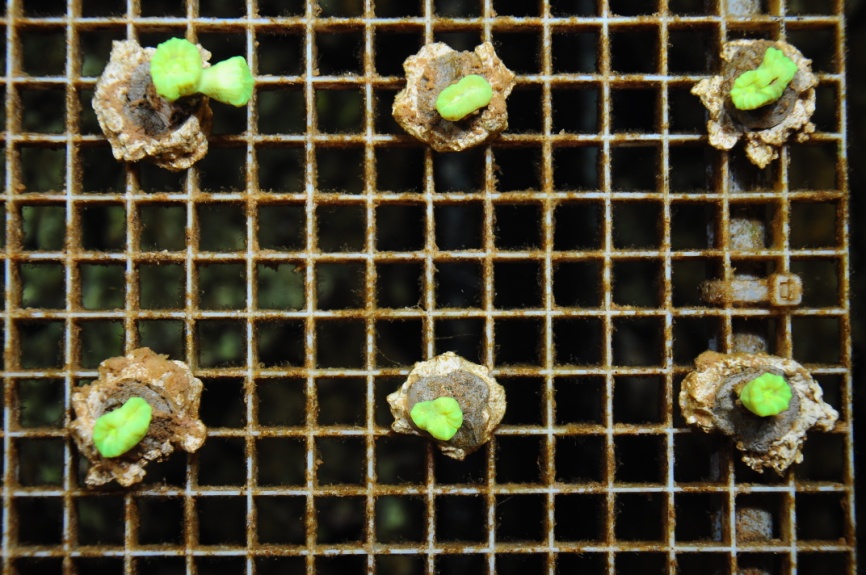
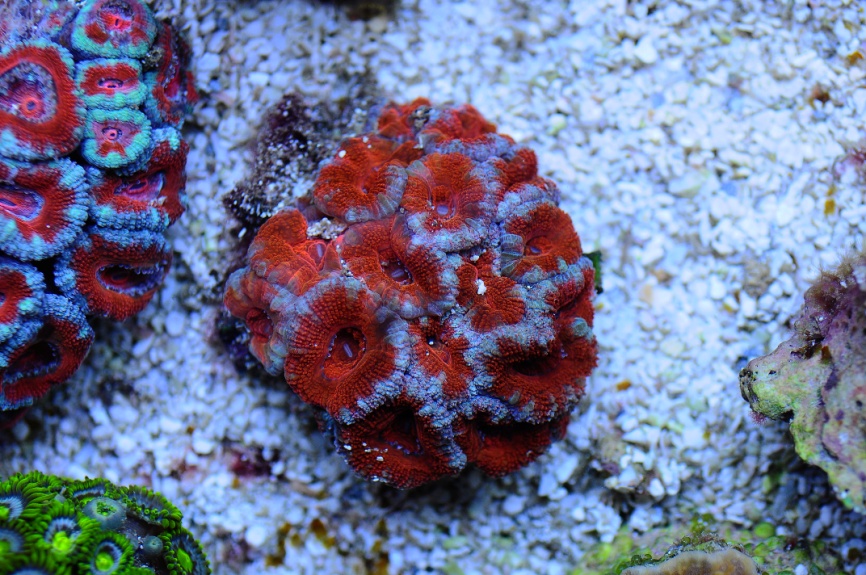
At higher irradiance levels, many scleractinian corals produce colorful pigments that are considered attractive. The upper and lower photographs show Pocillopora damicornis fragments grown at an irradiance of 40-60 and 275-325 µmol m-2 s-1, respectively.
Other considerations
Although the results presented here provide important insights into the effects of light on the growth of coral species from different families, an important limitation has to be discussed. As one a single genotype was used for each species, the results from this study cannot be directly extrapolated to the entire coral population. There is evidence that within species, genotypic variability exists in terms of growth (Osinga et al. 2011). This is not surprising, as each genotype within a particular species has its own gene complement and will thus respond differently to environmental conditions. However, these data still provide important insights into how different species will respond to various light conditions.
Another issue which should be mentioned is the fact that two different systems for the LEP and LED treatments were used. Therefore, we cannot exclude a possible “tank effect”. Unknown chemical and/or biological processes may have contributed to the growth differences between the LEP and LED treatments. However, as all measured parameters were highly similar between both systems, this seems unlikely.
Sustainable, efficient aquaculture is possible when science and the aquarium industry actively collaborate.
Final remarks
As the health of coral reefs dwindles, mariculture and aquaculture of corals will become highly important during the next decades. Studies which address the interactive effects of e.g. light, water flow and nutrition on coral growth will continue to play an important role in optimizing these processes. Public aquaria and zoos can actively participate by performing their own optimization studies, in collaboration with universities. A recent example of such a collaboration is the study of Fitzgerald (2010). When science and the aquarium industry join forces, sustainable aquaculture of many endangered reef species seems a realistic goal.
Acknowledgments
The data presented in this article were acquired during a feasibility study conducted by EcoDeco BV, to evaluate the economic viability of commercial aquaculture. We would like to thank Peter Henkemans, Robbert Dokter and Irma van Raaij of EcoDeco BV for their assistance. This study was financially supported by the Dutch Ministry of Infrastructure and the Environment with a Small Business Innovation Research grant (SBIR092082).
References
- Bou-Abdallah F, Chasteen ND, Lesser MP (2006) Quenching of superoxide radicals by green fluorescent protein. Biochim Biophys Acta 1760:1690-1695
- D’Angelo C, Denzel A, Vogt A, Matz MV, Oswald F, Salih A, Nienhaus GU, Wiedenmann J (2008) Blue light regulation of host pigment in reef-building corals. Mar Ecol Prog Ser 364:97-106
- Dubinsky Z, Falkowski PG, Porter JW, Muscatine L (1984) Absorption and utilization of radiant energy by light- and shade-adapted colonies of the hermatypic coral Stylophora pistillata. Proc R Soc Lond B 222:203-214
- Fabricius KE (2006) Effects of irradiance, flow and colony pigmentation on the temperature microenvironment around corals: implications for coral bleaching? Limn Oceanogr 51:30-37
- Fitzgerald H (2010) The effect of lighting type on the growth rate of the coral Montipora capricornis. Horniman Museum and King’s College London, London, UK. 121 p.
- Halldal P (1968) Photosynthetic capacities and photosynthetic action spectra of endozoic algae of the massive coral Favia. Biol Bull 134:411-424
- Mass T, Genin A, Shavit U, Grinstein M, Tchernov D (2010a) Flow enhances photosynthesis in marine benthic autotrophs by increasing the efflux of oxygen from the organism to the water. Proc Nat Ac Sc USA 107:2527-2531
- Mass T, Kline DI, Roopin M, Veal CJ, Cohen S, Iluz D, Levy O (2010b) The spectral quality of light is a key driver of photosynthesis and photoadaptation in Stylophora pistillata colonies from different depths in the Red Sea. J Exp Biol 213:4084-4091
- Osinga R, Schutter M, Griffioen B, Wijffels RH, Verreth JAJ, Shafir S, Henard S, Taruffi M, Gili C, Lavorano S (2011) The biology and economics of coral growth. Mar Biotechnol. 13:658-671
- Schutter M, van Velthoven B, Janse M, Osinga R, Janssen M, Wijffels R, Verreth J (2008) The effect of irradiance on long-term skeletal growth and net photosynthesis in Galaxea fascicularis under four light conditions. J Exp Mar Biol Ecol 367:75-80
- Titlyanov EA (1991) Light adaptation and production characteristics of branches differing by age and illumination of the hermatypic coral Pocillopora verrucosa. Symbiosis 10:249-260
- Wijgerde T, Henkemans P, Osinga R (2012) Effects of irradiance and light spectrum on growth of the scleractinian coral Galaxea fascicularis – Applicability of LEP and LED lighting to coral aquaculture. Aquaculture 344–349:188–193
0 Comments