

Abstract
Zooxanthellae within stony corals (Porites sp.) were exposed to LED-generated light of differing spectral qualities and photosynthetic efficiencies were determined. Red light (631nm and 657nm) was most efficient, followed by Violet (peaking at 400nm and marketed as ‘UV’), Blue (420nm), and White (433nm and phosphors). Blue/White light (453 & 467nm with phosphors) was least efficient. Protective xanthophylls (absorbing blue and blue/green light at ~440-490nm thereby competing with photopigments chlorophyll a, chlorophyll c² and peridinin) seem to be responsible for the different rates of photosynthesis. Black light (365nm) was found to promote photosynthesis. Reports for coral growth at very low PAR values (25 µmolm²sec) were also investigated. The Xanthophyll Cycle (a ‘pressure relief valve’ for excessive photosynthesis that might result in coral bleaching) was found to begin at different light intensities of LEDs of various colors. Protection did not occur in Red light (631nm and 657nm; Up to an intensity of 170 µmolm²sec, possibly explaining the damaging effects of red light at very high intensity) but did so in Blue/White and Blue light (90 and 100 µmolm²sec, respectively) and ‘White’ and ‘UV’ (400nm) at 40 and 50 µmolm²sec, respectively. Long-term experiments are in the planning stages.
Introduction
Advanced technology allows quick determination of a light source’s ability to promote photosynthesis. The availability of two devices has made this possible: A ‘photosynthesis meter’ (a PAM fluorometer, which allows in-situ determination of rates of photosynthesis) and LEDs (Light-Emitting Diodes of high efficiencies when combined with lenses to create intense light fields.)
Determination of efficient (photosynthetically speaking) light sources is important for several reasons. Economy in the costs of maintaining a coral reef aquarium certainly is a concern, but the health of zooxanthellae and hence their animal host should be of primary importance. Aesthetic concerns, such as the promotion of coral coloration through expression of fluorescent proteins and non-fluorescent chromoproteins, are of interest to many.
The radiometric power of a photon matters not in photosynthesis – a blue photon (with high radiometric power) will drive photosynthesis just as well as a photon of lesser energy (say, a red photon.) So, it would seem that the issue is settled. It is not. The adage ‘a photon is a photon’ is true when discussing light production by various light sources, but it is not correct when considering how different light wavelengths (or bandwidths) promote photosynthesis.
This article will examine photosynthetic efficiencies of various LEDs. Specifically, six light sources were tested for photosynthetic responses by zooxanthellae found in the stony coral Porites (most likely Symbiodinium of Clade C15.) The light sources include a black light (mostly UV-A produced by a fluorescent lamp), and LEDs radiating energy at peaks of 400nm (UV-A/violet), a 418nm LED (producing mostly violet with a small amount of UV-A), a blue/white LED combination peaking at white light with a peak 443nm and 457nm, a ‘white’ LED with a blue peak at 443nm, and red LEDs producing maximal light at 631nm and 657nm. All tests were performed when light intensity was at sub-saturating levels. Evidence suggests absorption by carotenoids is responsible for lessened photosynthetic efficiencies at 450 nm and 470 nm.
Energy dissipation through various non-photochemical means will be presented, with a discussion on this subject to follow in a future article.
Answers were obtained for the following questions:
- Do measurements made by PAR meters really tell us everything we need to know about light intensity?
- What can we make of reports about successful coral husbandry under very low (but specific) lighting conditions?
- Is there a difference in rates of photosynthesis when a coral and its zooxanthellae are exposed to different colored LEDs?
- If so, which LED is best at promoting photosynthesis?
- Do energy dissipation pathways differ when using differently colored lights?
- Why might the color of the LED light make a difference?
- Does ultraviolet radiation (UV-A at ~365nm) promote photosynthesis in zooxanthellate corals?
We’ll examine answers to these questions at the end of this article, but first we’ll look at the definitions of terminology used in this article:
Glossary
Absorption: Uptake, or taking in,of radiant energy.
Absorbance: The capacity of a substance to absorb radiation, expressed as the common logarithm of the reciprocal of transmittance of the substance.
Action Spectrum: The rate of physiological activity (such as oxygen production resulting from photosynthesis) plotted against wavelength of light. See Figure X for an action spectrum of zooxanthellae from a stony coral.
Bandwidth: The range of frequencies within a given waveband. Violet light’s bandwidth is defined as those wavelength frequencies between 380nm and 430nm.
Carotenes: A sub-group of carotenoids. -carotene is found in zooxanthellae and may act as a rather inefficient photopigment and/or as an anti-oxidant. Carotenes are made by plants (and not animals) and are usually yellow, orange, or red in color.
Carotenoid: Any of about 600 naturally occurring pigments in plants. Carotenoids can be divided into two sub-categories: Carotenes and Xanthophylls.
Electron Transport Rate: The rate of electron flow from Photosystem II (PSII) to Photosystem I (PSI), and abbreviated as ETR. If the amount of light absorbed is not measured, the electron flow is reported as the Relative Electron Transport Rate (rETR).
Fluorescence: The absorption of light energy and emission of this light energy at a longer wavelength.
Hue: A main property of color. Unique hues are blue, green, yellow, and red.
LED: Light-Emitting Diode. A semi-conductor capable of producing near-monochromatic radiant energy.
Monochromator: A laboratory device capable of splitting white light into its components, and delivering light of pure hue.
Nanometer: One billionth of a meter. Abbreviated as nm.
NO: Non-regulated quenching of chlorophyll fluorescence by means other than photosynthesis and NPQ.
NPQ: Non-photochemical quenching of chlorophyll fluorescence, specifically shunting of energy away from photosynthesis by xanthophylls, mostly as a protective measure against excessive light energy. Considered to be a ‘regulated’ means of energy dissipation.
PAM Fluorometer: A device capable of monitoring chlorophyll fluorescence, and is capable of calculating the fate of absorbed light energy, either through photosynthesis or two other dissipation pathways (including NPQ: Non-Photochemical Quenching of chlorophyll fluorescence by protective xanthophylls) or NO (dissipation by other pathways, including photoinhibition.) PAM stands for Pulse Amplitude Modulated light intensity. PAR (Photosynthetically Active Radiation): That visible light energy between 400 and 700nm. It is important to note that photosynthesis does not simply stop at wavelengths below 400nm – violet and some ultraviolet wavelengths can promote photosynthesis!
PPFD: Photosynthetic Photon Flux Density: The number of photosynthetically active photons falling upon a surface of given dimensions in a given time, usually expressed as microMol photons per square meter per second (µmol photons ·m²·sec, or simply µmol·m²·sec.)
Photopigments: Organic substances responsible for collecting light energy and hence the promotion of photosynthesis. Common photopigments in zooxanthellae are chlorophyll a, chlorophyll c², peridinin, and -carotene.
Radiometer: An instrument that measures radiant energy. For our purposes, the radiometer measures ultraviolet radiation and reports its intensity in microwatts per square centimeter (µwatts·cm².)
Saturation, Photosynthetic: Photosynthetic Saturation is reached when an increased amount of light does not increase the rate of photosynthesis. Sub-saturating light intensity is that seen between zero photosynthesis and just below saturating intensity.
Spill Over: See State Transition.
State Transition: A redistribution of collected light energy from one photosystem to another, thus allowing photosynthesis to occur in an efficient manner. Redistribution is known to occur in some zooxanthellae clades, usually from Photosystem II to Photosystem I, and prevents a damaging traffic jam of electrons. State Transition is also known as ‘spill-over.’
Ultraviolet Radiation: That radiation just below that visible to the human eye. For our purposes Ultraviolet-A (UV-A) is defined as 320nm -~380nm. Ultraviolet-B (UV-B) ranges from 290nm – 320nm.
Xanthophylls: Oxygenated carotenoids. Important xanthophylls found in zooxanthellae are diadinoxanthin and diatoxanthin – these play an important role in protecting them from excessive light. Dinoxanthin is an accessory pigment that transfers collected energy to dinoflagellates photosystems (with an unknown efficiency) and might act as an antioxidant as well.
Yield: The amount of product produced (such as photosynthesis) by the interaction of two substances (such as light and chlorophyll), generally expressed as a percentage. Zooxanthellae typically have a Yield of 0.30 – 0.40, while terrestrial plants’ Yields are much higher (~0.80.)
Absorption Characteristics of Zooxanthellae Photopigments
Symbiodinium dinoflagellates contain three major photopigments – chlorophyll a, chlorophyll c, and the carotenoid peridinin. Peridinin absorbs light into the green portion of the spectrum – this is the reason many corals appear brown. Table 1 shows the absorption peaks of these photopigments.
| Peak 1 | Peak 2 | Peak 3 | Peak 4 | Peak 5 | Peak 6 | Peak 7 | |
|---|---|---|---|---|---|---|---|
| Chlorophyll a | 430.3 | 662.1 | 410.7 | 382.7 | 616.5 | 580.3 | 534.1 |
| Chlorophyll c | 450.1 | 395.5 | 581.1 | 629.7 | N/A | N/A | N/A |
| Peridinin | 455.5 | 484.7 | 430 | N/A | N/A | N/A | N/A |
Problems with Using Action Spectra for Determination of Photosynthesis Light Requirements
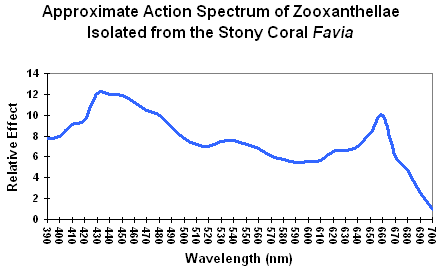
Figure 1. An action spectrum for a stony coral’s zooxanthellae. Using this chart, it would appear that blue light is the most efficient promoter of photosynthesis. Is it?
The standard method for determining light requirements for corals’ zooxanthellae has been examination of absorption characteristics of photopigments such as chlorophyll a, chlorophyll c, etc. (good) or action spectrums (better). Both are not without problems. Absorption characteristics are usually based on pigments extracted in solvents. Spectral characteristics shift slightly according to the extraction solvent used, and photopigments, when combined, also change these characteristics slightly. A better way is to examine the action spectrum of zooxanthellae isolated from a stony coral. This is usually done with a monochromator, where a beam of pure color (hue) illuminates a culture of Symbiodinium dinoflagellates and a reaction is determined (such as oxygen evolution). A chart of wavelengths versus reaction is then made. See Figure 1. This method also suffers from deficiencies – the two Photosystems (I and II) absorb light wavelengths with difference efficiencies, hence a monochromator might stimulate one photosystem, but not the other, and photosynthesis might not proceed efficiently (although ‘spill-over’ – also called State Transitions 1 or 2 – could perhaps overcome this problem – something very much in the discovery phase for zooxanthellae.) See Kirk (2000) for further details on action spectrums.
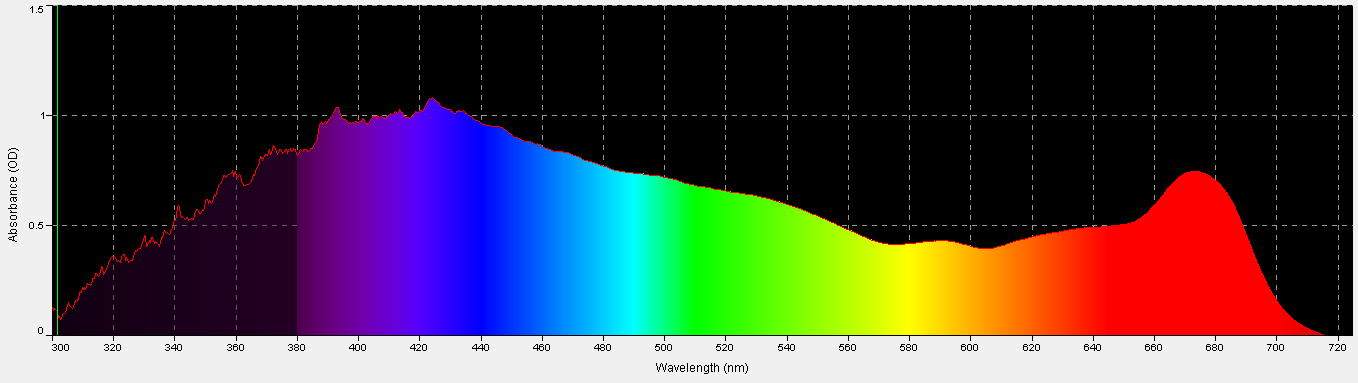
Figure 2. Porites coral absorbance, with a coral skeleton used as the absorbance standard. It is remarkably similar to the action spectrum in Figure 1, and is non-invasive to boot.
Another method for estimating light requirements of a coral’s zooxanthellae was developed during preparation of this article. It is non-invasive and easily performed if proper equipment is available. This method involves measuring of absorbance with a spectrometer and associated software (in this case, an Ocean Optics fiber optic spec and SpectraSuite software). A modification to this standard procedure is the use of a coral skeleton as a reflectance/absorbance standard in lieu of a 99% diffuse standard. See Figures 2 – 4, and Table 2.
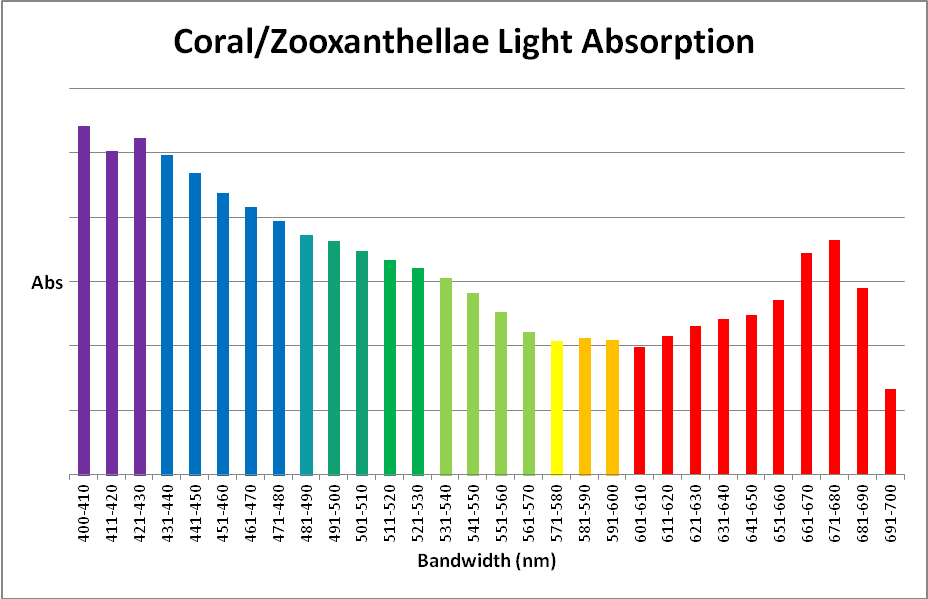
Figure 3.Coral/zooxanthellae absorption in 10nm bandwidths.
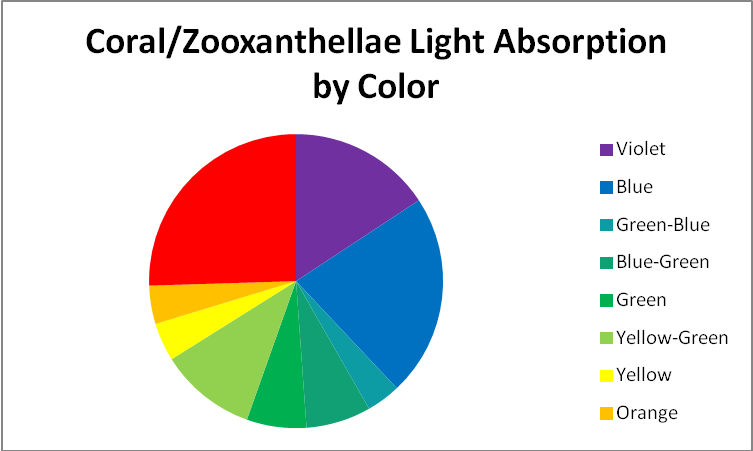
Figure 4. Coral and symbiont absorption by color, or hue.
| Wavelength, nm | Percent | Wavelength, nm | Percent | Wavelength, nm | Percent |
|---|---|---|---|---|---|
| 400-410 | 5.55% | 501-510 | 3.57% | 601-610 | 2.04% |
| 411-420 | 5.16% | 511-520 | 3.41% | 611-620 | 2.21% |
| 421-430 | 5.37% | 521-530 | 3.29% | 621-630 | 2.37% |
| 431-440 | 5.10% | 531-540 | 3.14% | 631-640 | 2.48% |
| 441-450 | 4.81% | 541-550 | 2.89% | 641-650 | 2.54% |
| 451-460 | 4.50% | 551-560 | 2.59% | 651-660 | 2.78% |
| 461-470 | 4.27% | 561-570 | 2.28% | 661-670 | 3.53% |
| 471-480 | 4.04% | 571-580 | 2.12% | 671-680 | 3.75% |
| 481-490 | 3.83% | 581-590 | 2.17% | 681-690 | 2.98% |
| 491-500 | 3.73% | 591-600 | 2.14% | 691-700 | 1.37% |
Using these data, it would seem that we need only to use a light source that mimics action or absorption spectra in order to promote photosynthesis in a most efficient manner.
The following sections describe light bandwidths, the light sources used in the procedures (in great detail), and the photosynthetic responses of a Porites coral’s zooxanthellae to these light sources. If this is not of particular interest, skip to the Discussion section.
Description of Light Bandwidths
Since there are gradual transitions between colors in the visible spectrum, it would not be surprising that definitions of color bandwidths vary among sources. To confuse the issue even further, quantum meters report those wavelengths falling between 400 and 700 nm, leaving out a portion of the violet bandwidth (380 – 399nm.) Hence, I will define bandwidths as follows:
- Violet: 400 – 430 nm
- Blue: 431 – 480 nm
- Green-Blue: 481 – 490 nm
- Blue-Green: 491 – 510 nm
- Green: 511 – 530 nm
- Yellow-Green: 531 – 570 nm
- Yellow: 571 – 580 nm
- Orange: 581 – 600 nm
- Red: 601 – 700 nm
Light Sources Used in These Procedures
This section will describe the light sources used in the experiments, and some caveats that are important to serious hobbyists. Our discussion begins with:
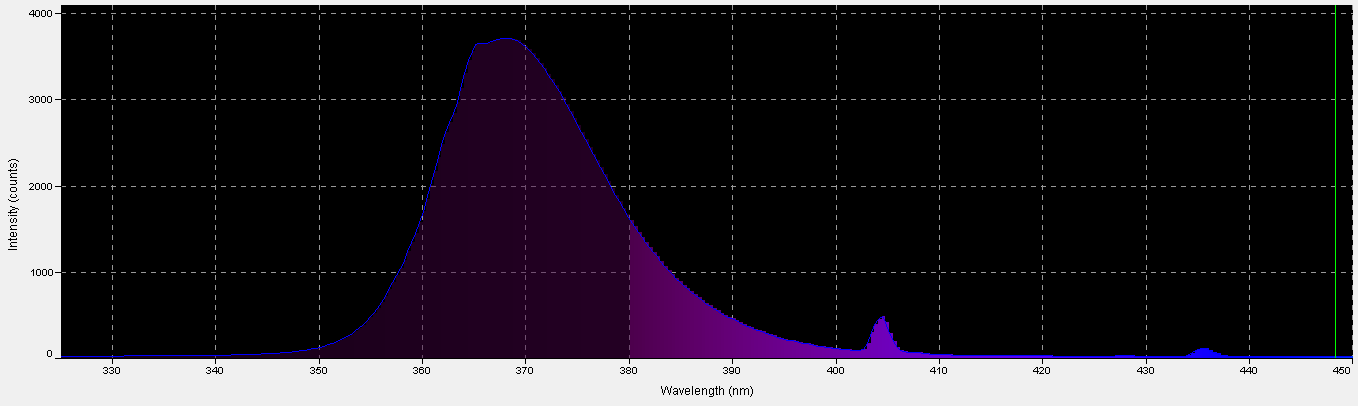
Figure 5. Spectral characteristics of a fluorescent black light lamp.
‘Black Light’ – Peak Output: 365nm
Black light, or UV-A radiation, produced by a fluorescent lamp was used to determine if zooxanthellae can utilize these wavelengths in photosynthesis. About 28% of this lamp’s output is in the range visible to the average human eye, according to analysis with a spectrometer. See Figures 5 through 7, & Table 3.
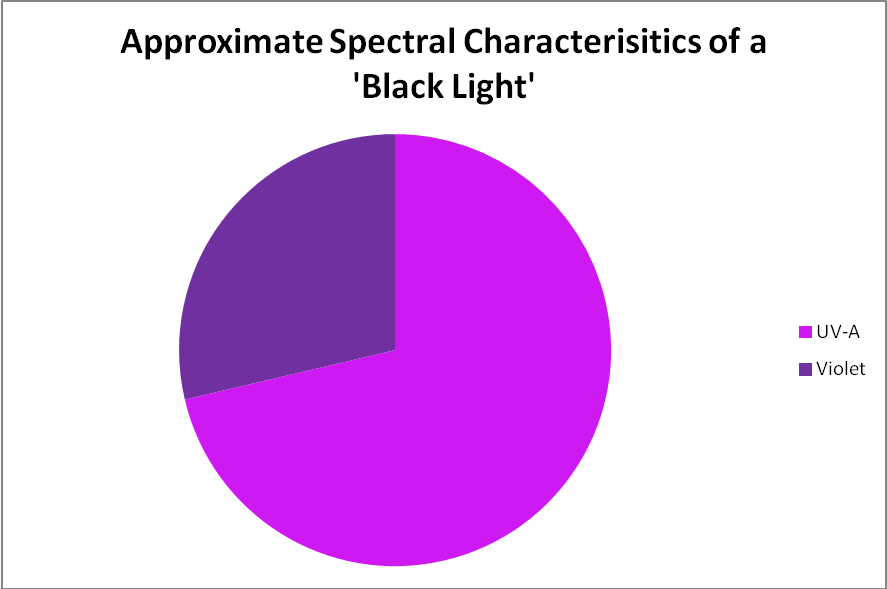
Figure 6. The output of a black light lamp is almost entirely in the ultraviolet range, which is invisible to the human eye.
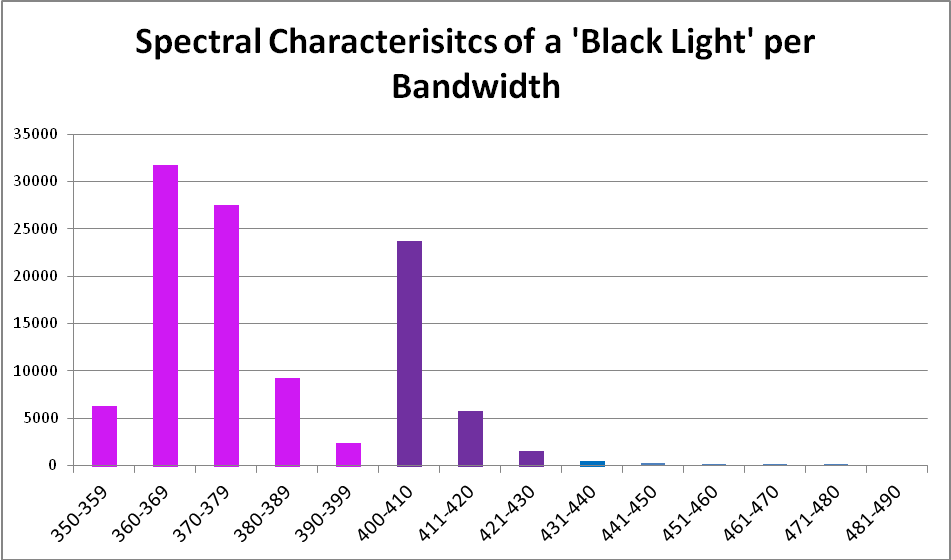
Figure 7. Output of the black light per 10nm bandwidths.
| Wavelength, nm | Percent | Wavelength, nm | Percent |
|---|---|---|---|
| 350-359 | 6% | 390-399 | 2% |
| 360-369 | 29% | 400-410 | 22% |
| 370-379 | 25% | 411-420 | 5% |
| 380-389 | 8% | 421-430 | 1% |
‘Ultraviolet’ LED – Peak Output: 400 nm
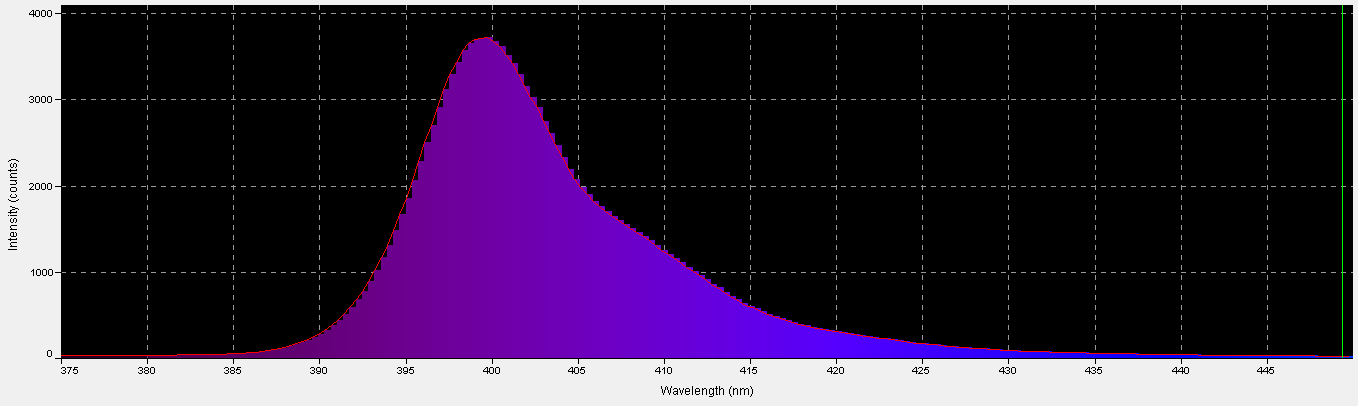
Figure 8. Spectral characteristics of the ‘UV’ LED.
The term ‘ultraviolet’ is something of a misnomer in this case, if we recognize the definition of violet light as being those wavelengths between 380nm and 430nm. In this case, practically all of the radiation produced falls into the ‘violet’ bandwidth. Interestingly, ~40% of the LED’s output will not detected by PAR meters with a cutoff of wavelengths below 400nm. See Figure 8 – 10, and Table 4.
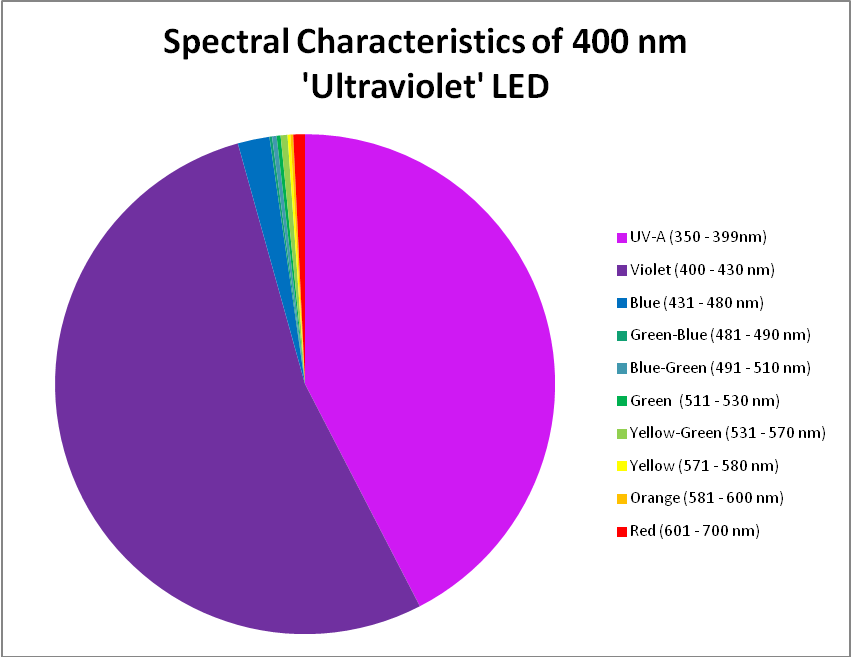
Figure 9. A break out of radiation produced by the ‘UV’ LED. Note how the color bandwidths are defined in the legend!
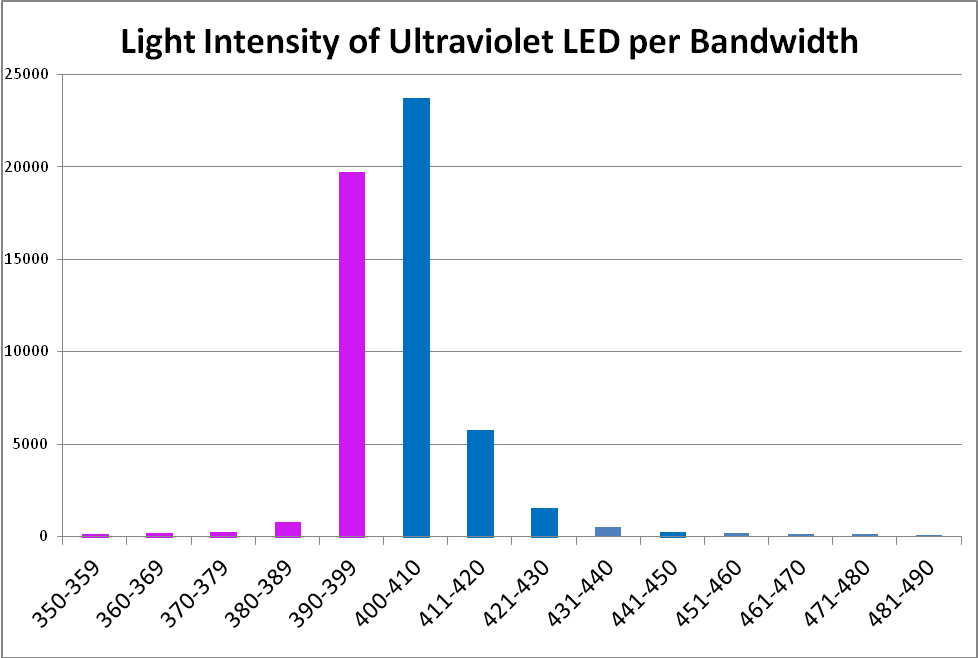
Figure 10. Output of the ‘UV’ LED per 10nm bandwidth.
| Wavelength, nm | Percent | Wavelength, nm | Percent |
|---|---|---|---|
| 350-359 | 0% | 420-429 | 3% |
| 360-369 | 0% | 430-439 | 1% |
| 370-379 | 0% | 440-449 | 0% |
| 380-389 | 2% | 450-459 | 0% |
| 390-399 | 37% | 460-469 | 0% |
| 400-409 | 44% | 470-479 | 0% |
| 410-419 | 11% | 480-489 | 0% |
420nm ‘Blue’ LED – Peak Output: 418nm
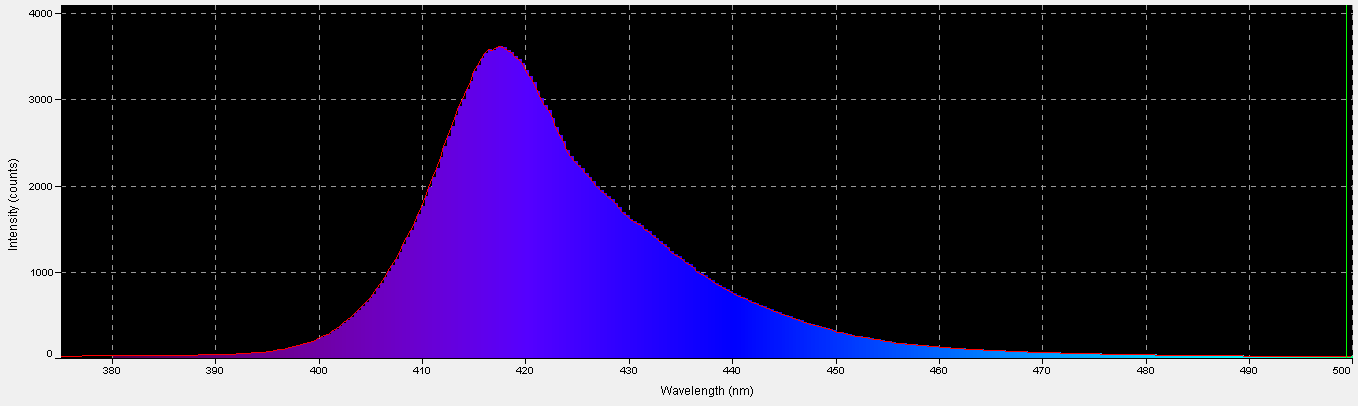
Figure 7. Spectral output of the 420nm LED.
The peak output of these LEDs (418nm) is remarkably close to the advertised peak. Note that about 6% of the output will not be detected by a PAR meter with a cutoff of 400nm and below. See Figures 7 – 9, and Table 5.
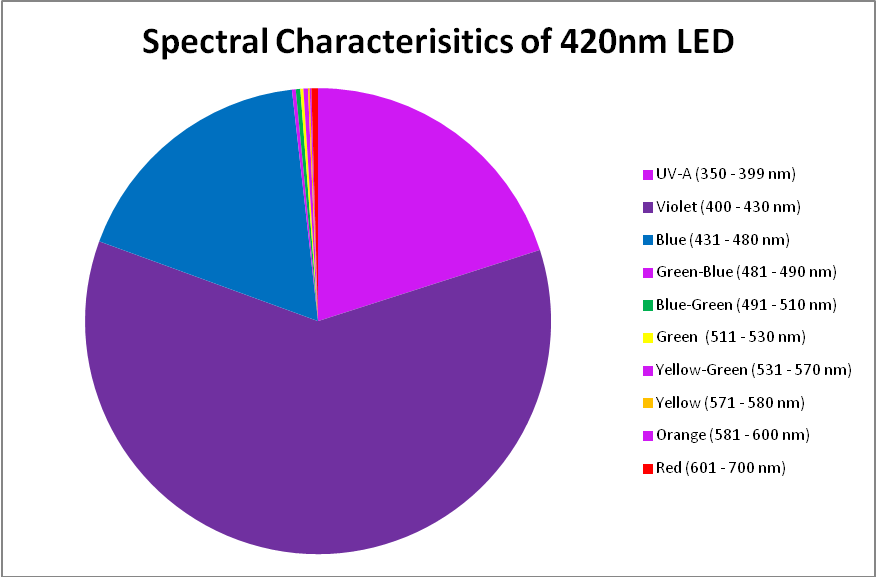
Figure 8. A break out of radiation produced by the 420nm LED.
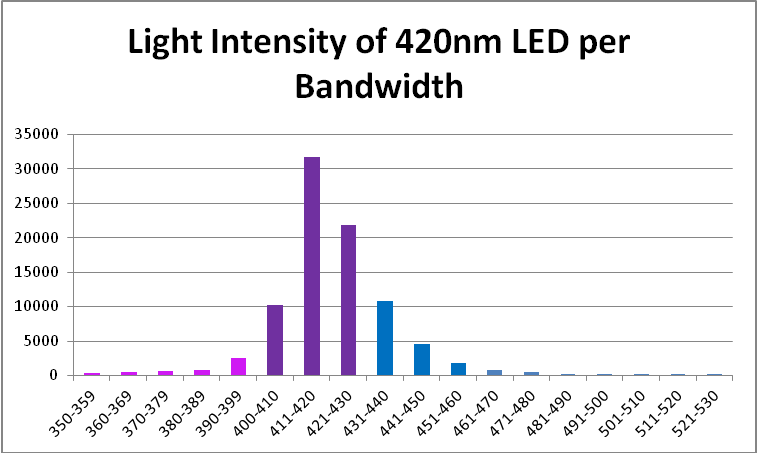
Figure 9. Output of the 420nm LED in % by 10nm bandwidths.
| Wavelength, nm | Percent | Wavelength, nm | Percent |
|---|---|---|---|
| 350-359 | 0% | 421-430 | 25% |
| 360-369 | 1% | 431-440 | 12% |
| 370-379 | 1% | 441-450 | 5% |
| 380-389 | 1% | 451-460 | 2% |
| 390-399 | 3% | 461-470 | 1% |
| 400-410 | 12% | 471-480 | 1% |
| 411-420 | 36% | 481-490 | 0% |
Blue and White LED Combination – Peak Output: 453 and 467nm

Figure 10. This blue and white LED combination peaks at 453nm and 467nm, with ‘white light’ produced by doping blue LEDs with phosphors.
This custom-built LED fixture has a combination of LEDs producing blue and white light. LEDs producing ‘white’ light are actually blue LEDs that have been doped with phosphors that absorb blue light and fluoresce it as white light. See Figures 10 – 12, and Table 6.
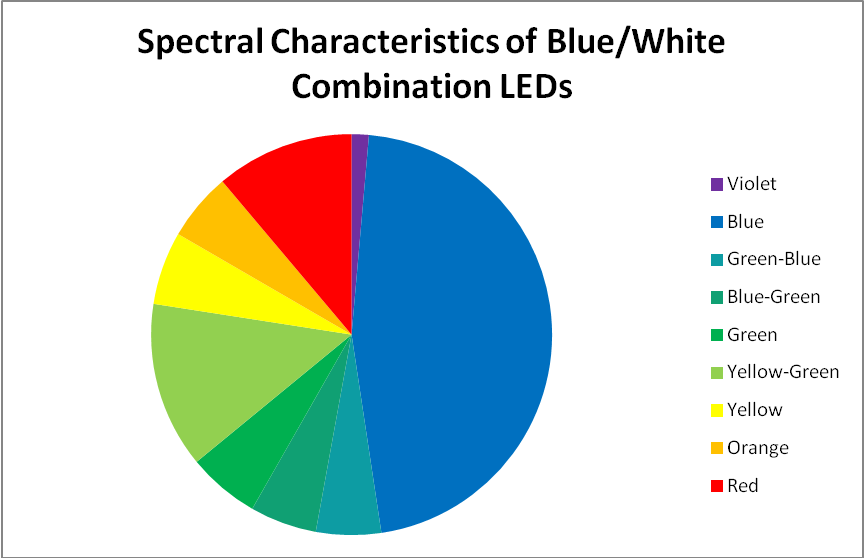
Figure 11. A break out of radiation produced by the blue and white LED combination.

Figure 12. Output of the blue/white LED combination in 10nm bandwidths.
| Wavelength, nm | Percent | Wavelength, nm | Percent | Wavelength, nm | Percent |
|---|---|---|---|---|---|
| 400-410 | 0.16% | 501-510 | 2.51% | 601-610 | 2.41% |
| 411-420 | 0.31% | 511-520 | 2.78% | 611-620 | 2.10% |
| 421-430 | 0.95% | 521-530 | 3.20% | 621-630 | 1.77% |
| 431-440 | 3.15% | 531-540 | 3.43% | 631-640 | 1.43% |
| 441-450 | 9.07% | 541-550 | 3.54% | 641-650 | 1.13% |
| 451-460 | 12.97% | 551-560 | 3.49% | 651-660 | 0.88% |
| 461-470 | 12.94% | 561-570 | 3.33% | 661-670 | 0.65% |
| 471-480 | 9.47% | 571-580 | 3.14% | 671-680 | 0.49% |
| 481-490 | 5.39% | 581-590 | 2.94% | 681-690 | 0.36% |
| 491-500 | 3.03% | 591-600 | 2.71% | 691-700 | 0.26% |
‘White’ LED – Peak Output = 443nm
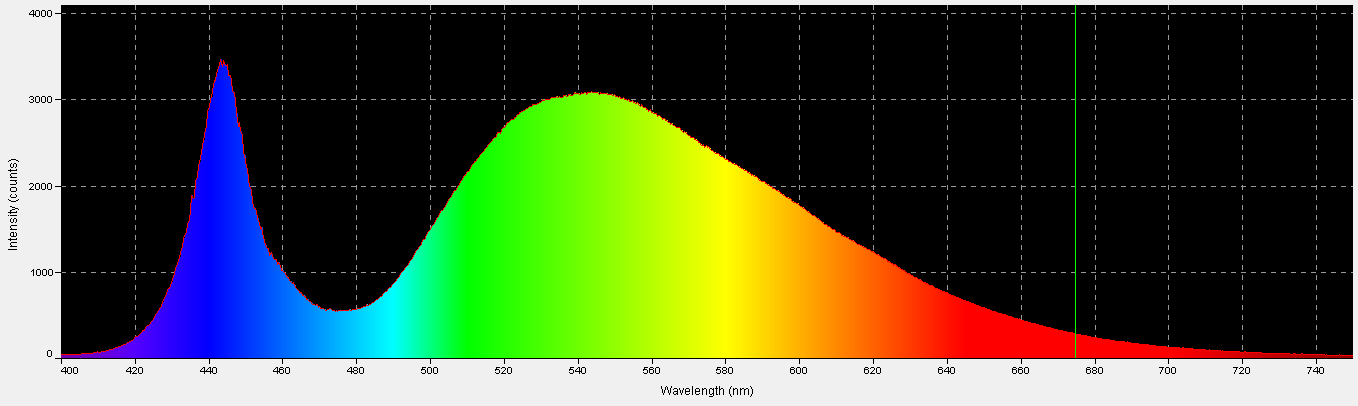
Figure 13. Spectral characteristics of the 4,000K ‘white’ LED.
These LEDs are variants of those previously discussed. Blue light is produced with a maximum output at 443nm, and some of this blue light is absorbed by phosphors within the LED and fluoresced as full-spectrum ‘white’ light. See Figures 13 – 15, and Table 7.
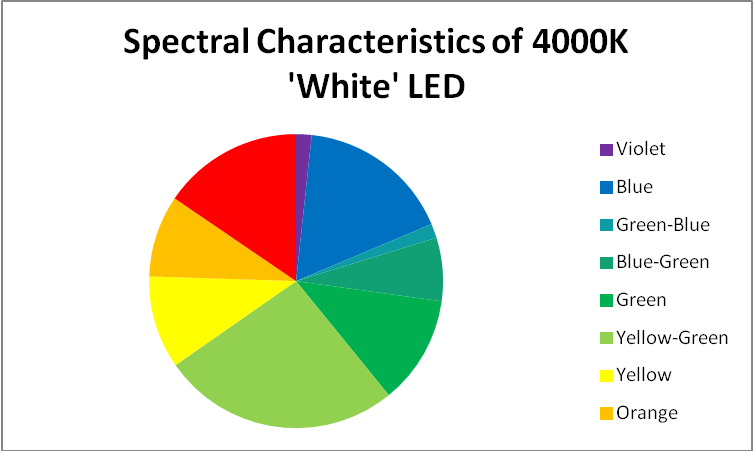
Figure 14. A break out of radiation produced by the 4,000K ‘white’ LED.
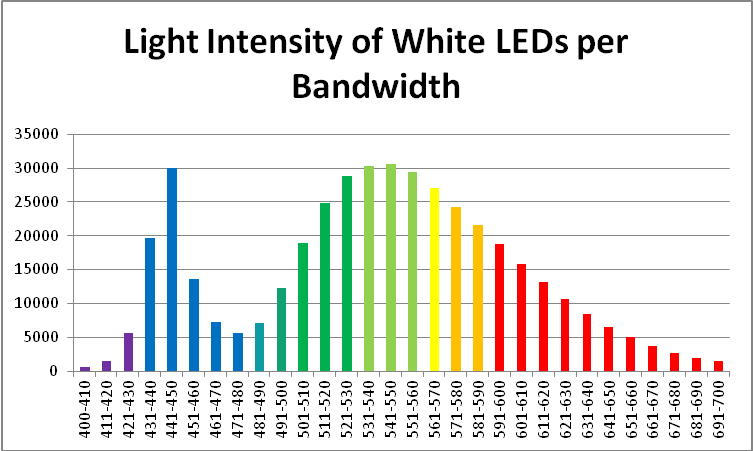
Figure 15. Output of the ‘white’ LED in 10nm bandwidths.
| Wavelength, nm | Percent | Wavelength, nm | Percent | Wavelength, nm | Percent |
|---|---|---|---|---|---|
| 400-410 | 0.13% | 501-510 | 4.44% | 601-610 | 3.72% |
| 411-420 | 0.34% | 511-520 | 5.81% | 611-620 | 3.10% |
| 421-430 | 1.31% | 521-530 | 6.73% | 621-630 | 2.51% |
| 431-440 | 4.60% | 531-540 | 7.11% | 631-640 | 1.97% |
| 441-450 | 7.02% | 541-550 | 7.18% | 641-650 | 1.52% |
| 451-460 | 3.18% | 551-560 | 6.89% | 651-660 | 1.16% |
| 461-470 | 1.71% | 561-570 | 6.32% | 661-670 | 0.85% |
| 471-480 | 1.31% | 571-580 | 5.67% | 671-680 | 0.63% |
| 481-490 | 1.66% | 581-590 | 5.05% | 681-690 | 0.46% |
| 491-500 | 2.87% | 591-600 | 4.41% | 691-700 | 0.34% |
Red LEDs – Peak Output: 631 nm and 657nm
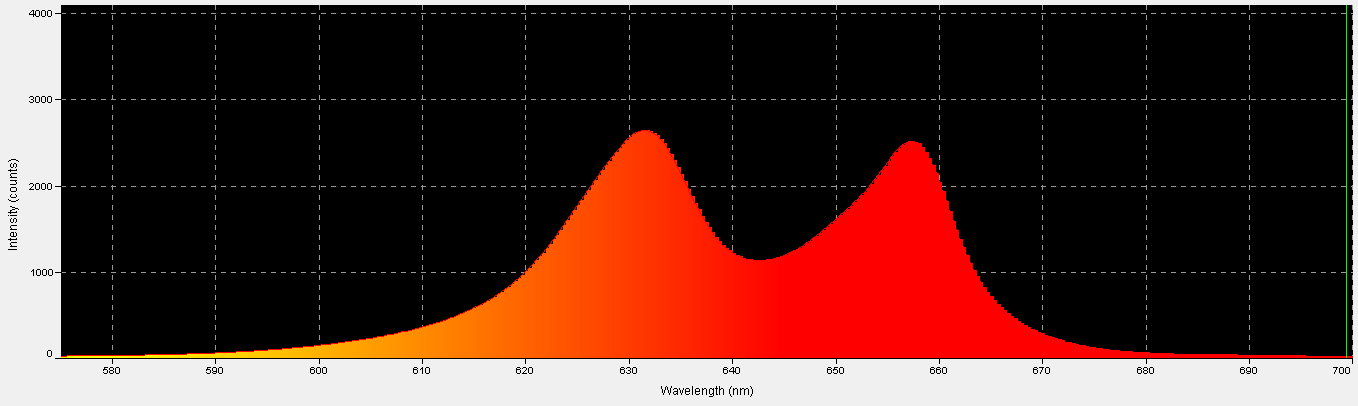
Figure 16. Spectral power distribution of red LEDs.
Red light is important in the promotion of photosynthesis. See Figures 16 – 18, and Table 8.
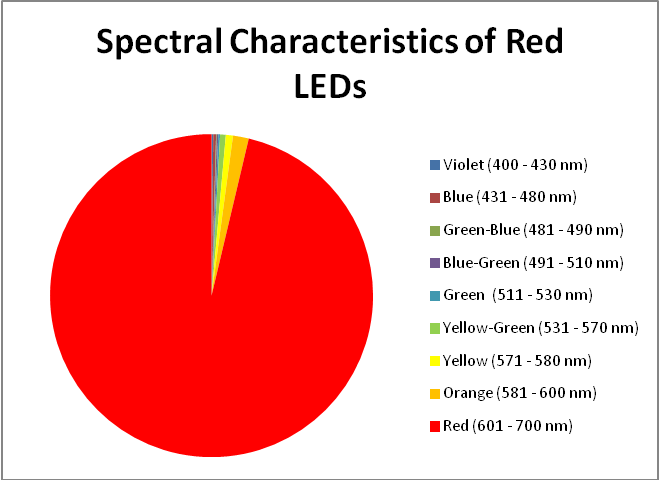
Figure 17. A break out of radiation produced by red LEDs.
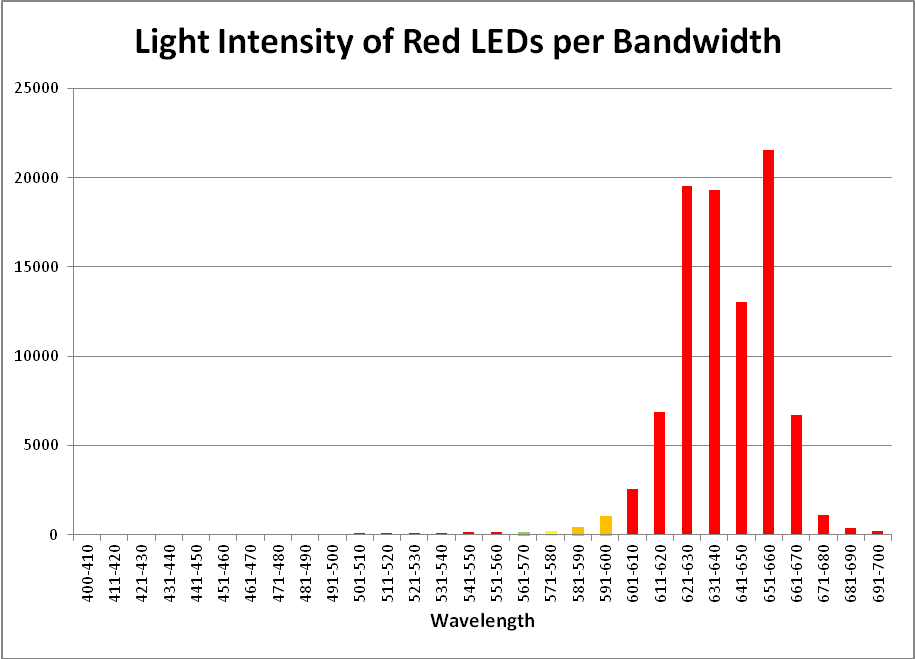
Figure 18. This LED fixture from Build My LED generates light peaking at 631nm and 657nm.
| Wavelength, nm | Percent | Wavelength, nm | Percent | Wavelength, nm | Percent |
|---|---|---|---|---|---|
| 400-410 | 0.06% | 501-510 | 0.08% | 601-610 | 2.73% |
| 411-420 | 0.05% | 511-520 | 0.09% | 611-620 | 7.28% |
| 421-430 | 0.06% | 521-530 | 0.09% | 621-630 | 20.67% |
| 431-440 | 0.05% | 531-540 | 0.11% | 631-640 | 20.44% |
| 441-450 | 0.06% | 541-550 | 0.14% | 641-650 | 13.81% |
| 451-460 | 0.06% | 551-560 | 0.14% | 651-660 | 22.85% |
| 461-470 | 0.06% | 561-570 | 0.18% | 661-670 | 7.10% |
| 471-480 | 0.06% | 571-580 | 0.25% | 671-680 | 1.20% |
| 481-490 | 0.07% | 581-590 | 0.47% | 681-690 | 0.42% |
| 491-500 | 0.07% | 591-600 | 1.12% | 691-700 | 0.25% |
Results
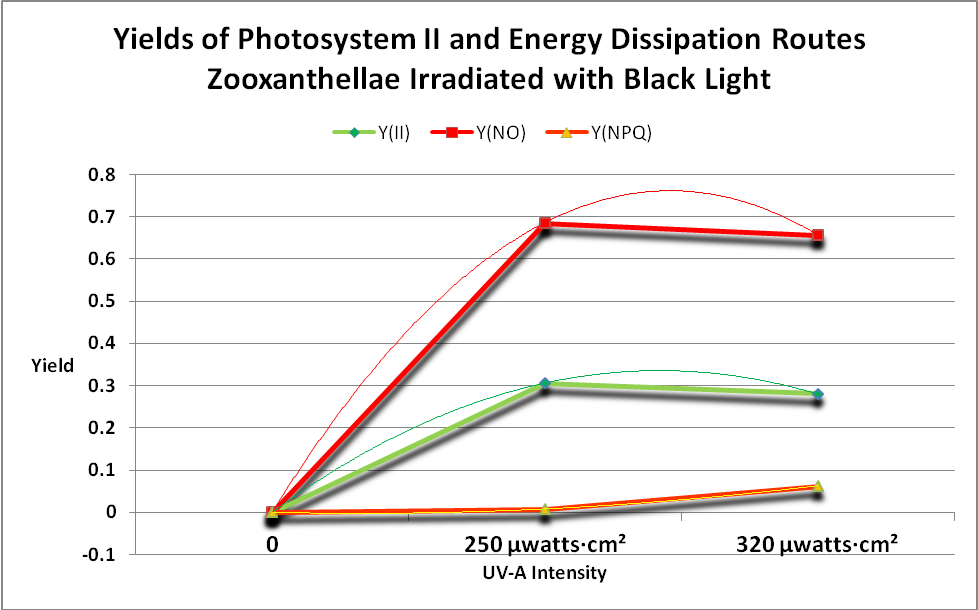
Figure 19. Take home message: The green line shows that photosynthesis occurs when the coral’s Zooxanthellae is illuminated with black light. This figure shows the Yields of energy dissipation pathways when a black light is used as the light source. Since a PAR meter does not ‘see’ the maximum output of the lamp at 365nm, no ETRs can be calculated. Note that PPFD detected by the Li-Cor PAR meter during this procedure was less than 1 µmol·m²·sec.
The following charts demonstrate the rate of photosynthesis – the relative electron transport rate (rETR) – in a Porites coral when illuminated by various LED light sources described above. Other energy dissipation pathways (NPQ and NO) are shown as well. See the Glossary (above) for definitions and the Methods and Materials (below) for further information. See Figures 19 – 24.
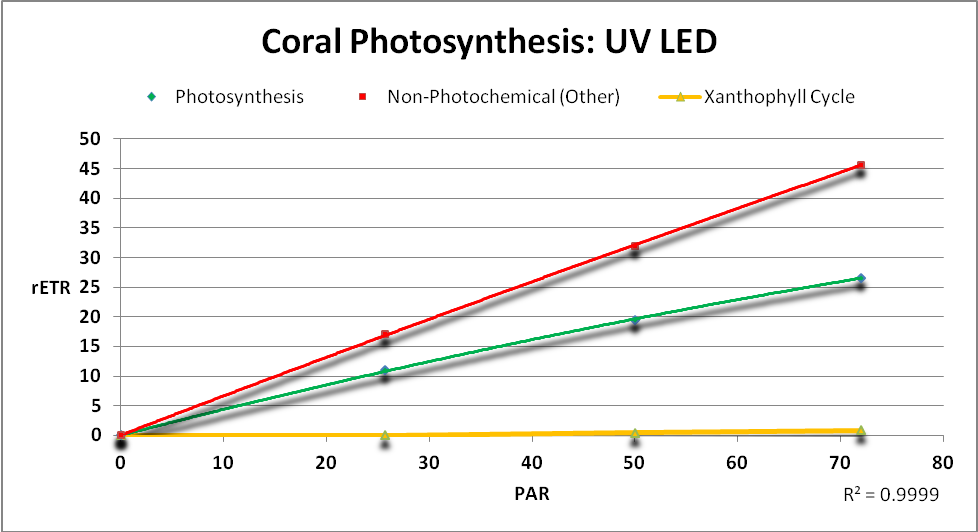
Figure 20. The rate of photosynthesis (and energy dissipation routes) when a “UV” LED is used as the light source. These rates have been corrected for photosynthetic radiation not sensed by quantum meters.
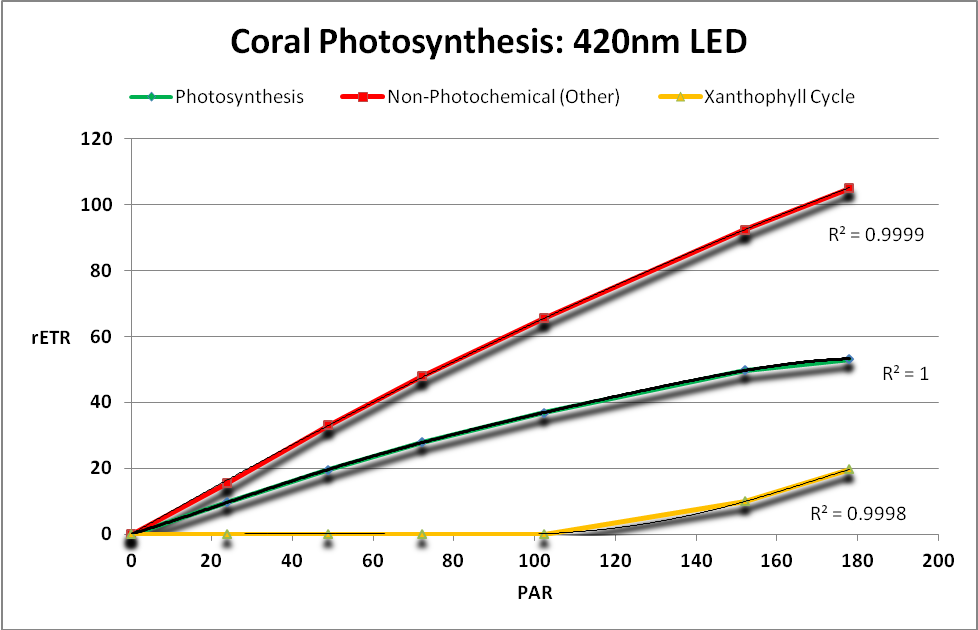
Figure 21.Zooxanthellae ETRs when a LED generating light maximally at 420nm is employed.
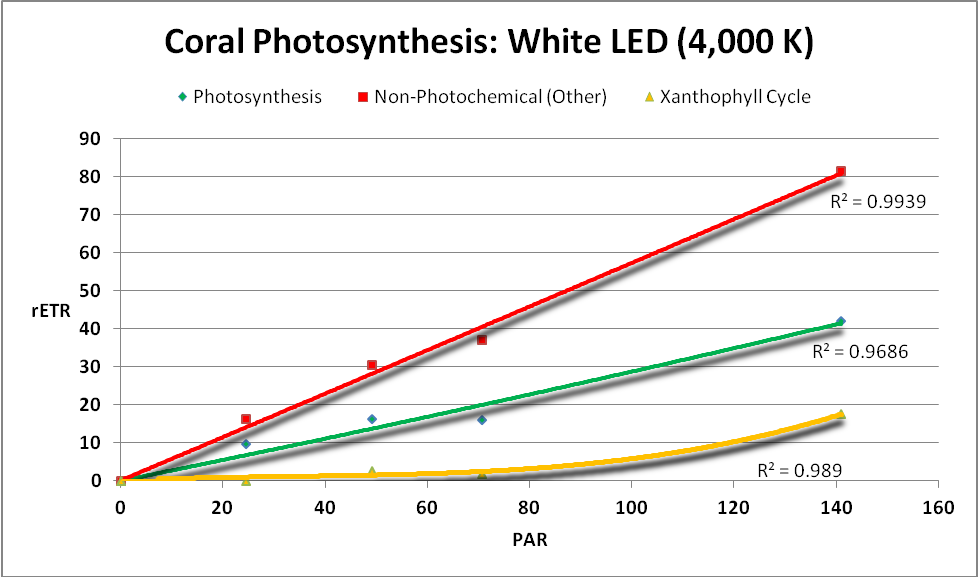
Figure 22. A ‘white’ LED and its effects on photosynthesis, NPQ, and NO.
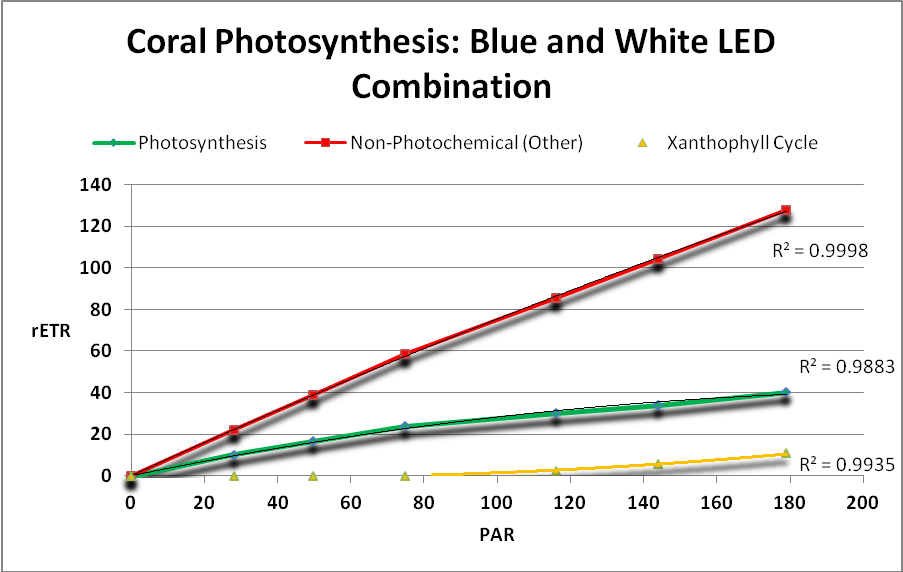
Figure 23.Surprisingly, a combination of blue and white light produced by these LEDs yielded low rates of photosynthesis.
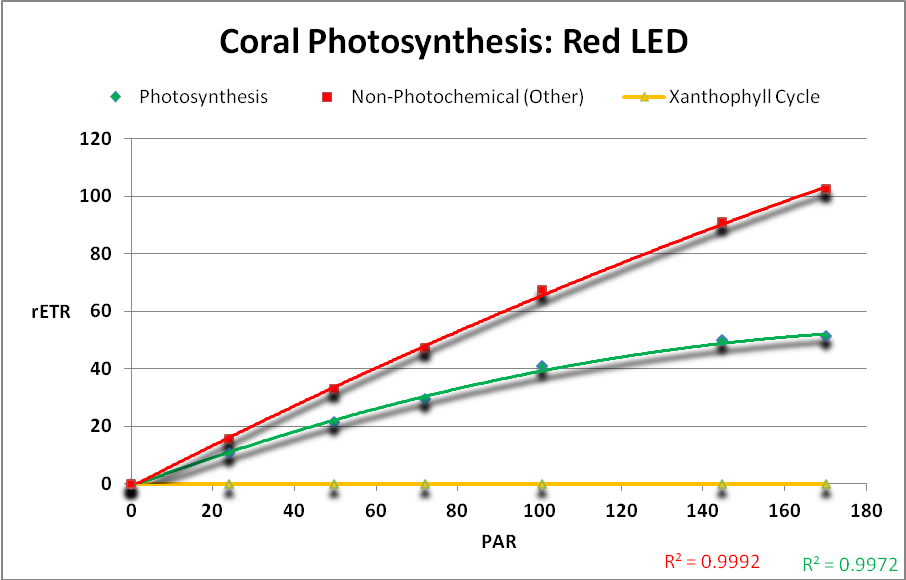
Figure 24. Red light generated the highest rates of photosynthesis.
Discussion
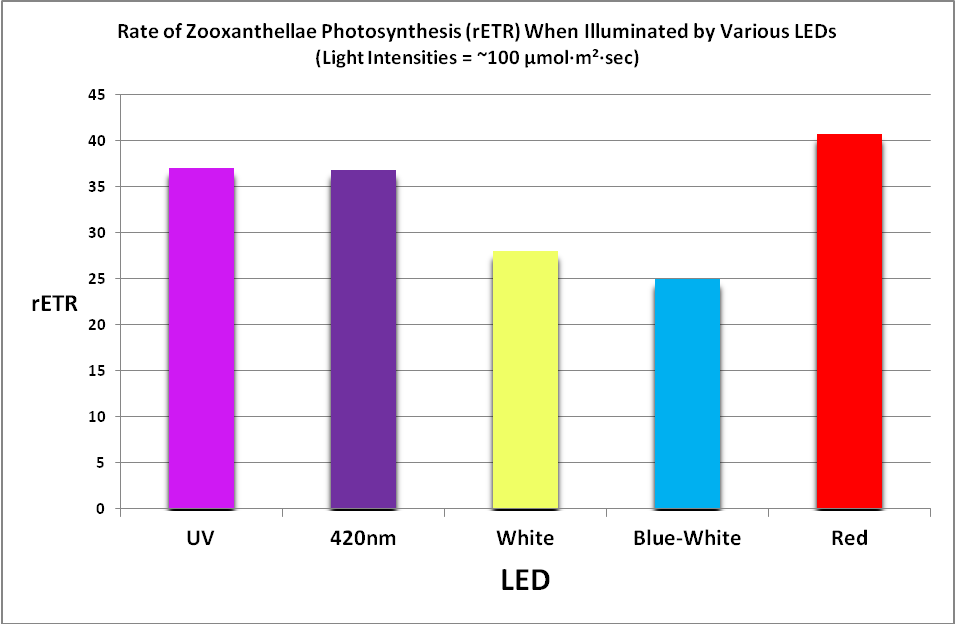
Figure 25. Photosynthetic performance. From left, UV LED (peak at ~400nm), 420nm LED, white LED (4,000 K, peak at 443nm), blue/white LED combination (peaks at 453nm, and 457nm with phosphors), and red LEDs (631 and 657nm.) The difference between the lowest rate (blue/white combo) and highest rate (red LEDs) is ~39%.
Results of testing show there are clear differences in the rate of photosynthesis when light sources of different hue (or color) are used. See Figure 25.
These results may seem perplexing if we take the adage ‘a photon is a photon’ to be correct, and the color of light (or more correctly, its energy level) does not make a difference in photosynthesis (which is true.)
The differences in the rates of photosynthesis can be explained through an examination of things that compete with photosynthesis through absorption of light. Play particular attention to the absorption properties, especially in the blue portion of the spectrum.
Competition for Light by Things Other Than Zooxanthellae – Carotenoids and the Coral Skeleton
Two groups of carotenoid pigments can compete for light with photopigments (chlorophylls, peridinin, etc.) – Carotenes and Xanthophylls (Latin for ‘yellow leaf’.)
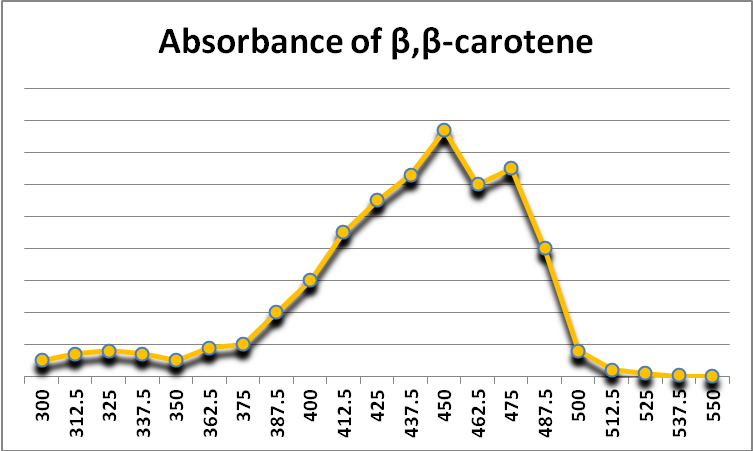
Figure 26. Beta-carotene is a photopigment found in at least some zooxanthellae. It also acts as a protective antioxidant agent. It appears yellow-orange because it absorbs violet and blue light. After Jeffrey et al., 1997.
A carotene – beta-carotene (-carotene) – is known to exist in zooxanthellae. -carotene appears yellow-orange because it absorbs violet and blue light (See Figure 26.) It can act as an anti-oxidant as well as a photopigment, although its transfer of collected light energy to a photosystem’s reaction center is not very efficient (Telfer, 2002).
Hill et al. (2012) found -carotene in three coral species examined (Acropora millepora, Pocillopora damicornis, and Pavona decussata.) In A. millepora and P. damicornis the -carotene concentrations, relative to chlorophyll a, rose when these corals were stressed by an increased temperature.
Figure 27 shows the relative concentration of -carotene in some Caribbean stony corals. Considering the date of this work (1981), it is possible that future improvements in laboratory techniques would identify the pigment dinoxanthin as other xanthophylls such as diadinoxanthin and diatoxanthin (see next section.)

Figure 27. Relative concentrations of pigments found in select Caribbean stony corals. The amount of carotenoids (xanthophylls and carotenes) is not insignificant (9%). After Gil-Turnes and Corredor (1981).
Xanthophylls (oxygenated carotenoids) are also found in zooxanthellae. Two xanthophylls (diadinoxanthin and diatoxanthin) play an important role in protecting symbiotic algae and coral hosts from excessive light energy. When light energy is sufficient enough to effect pH changes within the photosynthetic apparatus of zooxanthellae, diadinoxanthin is converted to diatoxanthin. This conversion shunts light energy away from photosynthesis. In darkness, the process reverses, and diatoxanthin becomes diadinoxanthin. Note that these xanthophylls both absorb some violet but most strongly blue wavelengths at ~450 – 490nm. See Figure 28.
There is another xanthophyll reportedly found in stony corals and Tridacnid clams – dinoxanthin. Jeffries et al. (1997) state it is a minor pigment (relative to chlorophylls and other photopigments.) There is some debate about early reports of dinoxanthin in corals – some feel advances in analytical procedures would find that dinoxanthin is actually another xanthophyll, perhaps diadinoxanthin or diatoxanthin. . In any case, the pigment in Caribbean stony corals is about 7% of total photopigment content. See Figure 27. See Figure 29 for absorbance data for dinoxanthin.
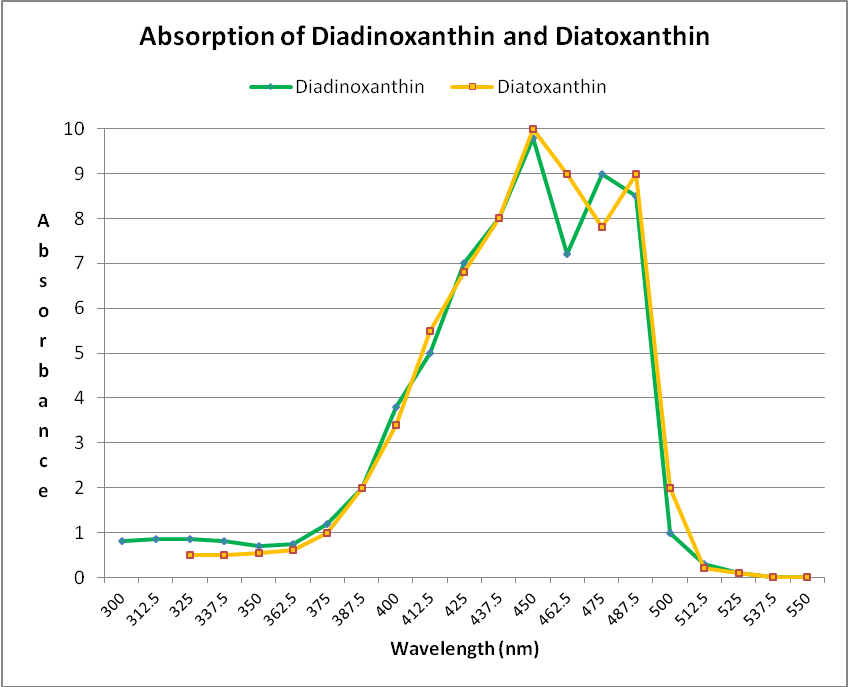
Figure 28. These xanthophylls (diadinoxanthin and diatoxanthin) are important photosynthesis regulators in zooxanthellae. They also absorb mostly violet and blue light. After Jeffrey et al., 1997.
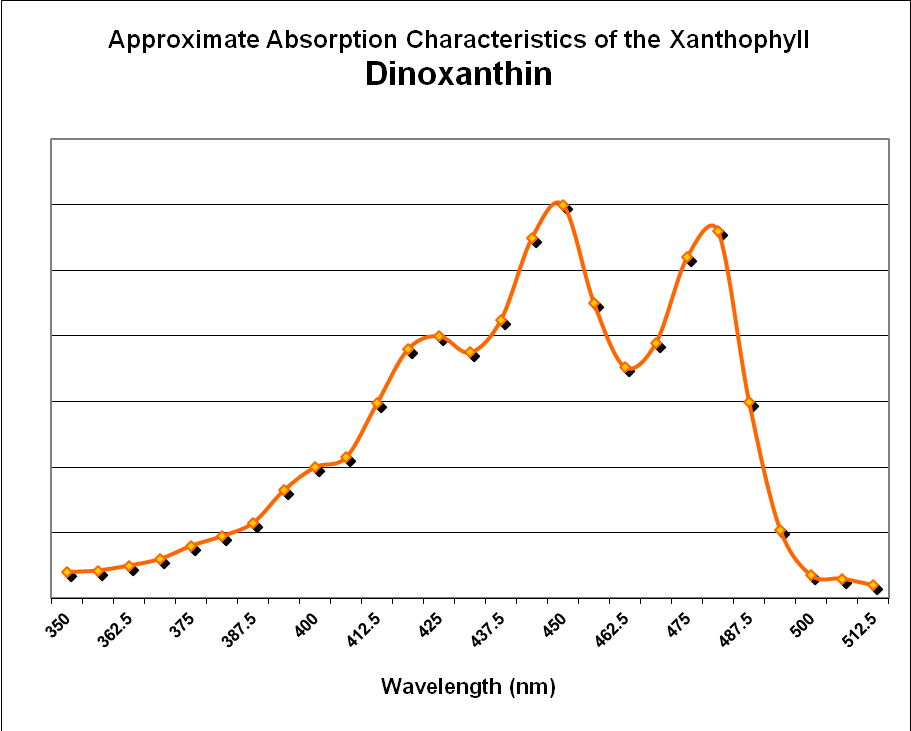
Figure 29. Absorption properties of the xanthophyll Dinoxanthin. After Jeffrey et al., 1997.
Light Absorbance by the Coral Skeleton
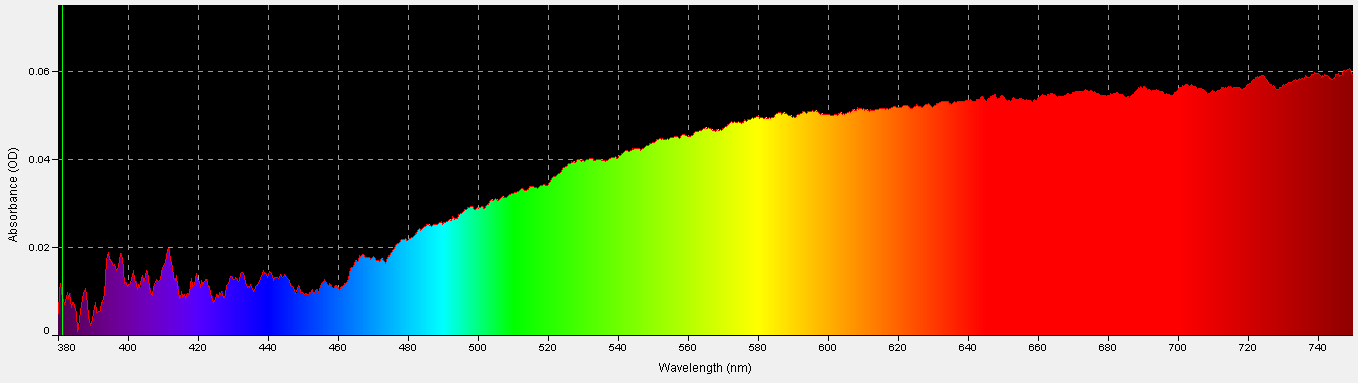
Figure 30. Porites skeleton absorbance, 380nm – 750nm.
Although we might think of the coral skeleton as perfectly white and a good reflector of all wavelengths, it is not. This was determined by comparing light absorbed/reflected by a sample of a Porites skeleton to that absorbed/reflected by a reflectance standard (Spectralon 99% diffuse standard.) As Figure 30 shows, violet/ blue wavelengths are poorly absorbed (relative to red wavelengths) by the coral skeleton and are thus reflected back through the coral tissue containing zooxanthellae. On the other hand, the skeleton absorbs red wavelengths with better efficiency; hence less red light is reflected.
Effects of Hue on Zooxanthellae Photosynthesis
Light sources of different ‘colors’ produce different photosynthetic responses but these are not due to the quality of the light per se, but instead the absorption of violet and blue light by carotenoids (including -carotene,and xanthophylls diatoxanthin, diatoxanthin, and diadinoxanthin.) -carotene is known to transfer collected energy to chlorophyll a, and hence photosystem reaction centers, in an inefficient manner.
Results of these experiments suggest that violet, blue, and red light with peaks away from the absorption maxima of carotenoids present in zooxanthellae are most efficient in the promotion of photosynthesis. See Table 9.
| None | Major Peak (nm) | Minor Peak 1 (nm) | Minor Peak 2 (nm) |
|---|---|---|---|
| Diadinoxanthin | 448 | 478 | 425 |
| Diatoxanthin | 453.9 | 482.3 | 427 |
| Dinoxanthin | 441.5 | 470.7 | 417.9 |
| -carotene | 453.5 | 479.9 | 426 |
LEDs with peaks of 400 and 420nm were more efficient than those with peaks at ~450 and ~480nm. The combination of LEDs producing red light (at 631nm and 657nm) was most efficient with practically none of its output absorbed by carotenoids.
Low PPFD, Ultraviolet Radiation, and Coral Growth
Reports of excellent coral growth under very low PPFD values (as low as 25 µmol·m²·sec, as reported by ‘hobby’ grade quantum meters) can be explained in a couple of ways. The lamps being used, according to the vendor (www.uniquecorals.com), utilize LEDs producing light at 400nm and 420nm. This light combination is efficient in the promotion to photosynthesis, but is poorly reported by inexpensive PAR meters, since the sensor’s response does not ‘see’ these wavelengths very well. In addition, the 400nm LED (‘UV’ LED) produces violet light below the detection limit of most PAR sensors (a correction factor of ~40% was used in calculating rates of photosynthesis (rETRs) for the 400nm LED.) It appears that at least some ultraviolet light is used in photosynthesis. This is based on the observation of a very low PPFD value (<1 µmol·m²·sec, as measured with a ‘lab grade’ quantum meter) when testing the black light for its effect on photosynthesis. A second clue is the activity of the protective xanthophylls (induced by low pH within the photosynthetic apparatus) when the ‘UV’ LED was used. Undoubtedly, some, if not most, of photosynthesis occurred due to exposure to violet wavelengths (380 – 400nm) which even the Li-Cor meter does not ‘see.’ Photosynthesis does not just stop when the transition is made from visible violet to invisible long-wave ultraviolet radiation (say, between365nm and 380nm). Note that photopigments such as chlorophylls, peridinin, etc. absorb some ultraviolet radiation (see Table 10).
| None | UV Absorption Peak | Lowest Absorption Reported |
|---|---|---|
| Chlorophyll a | 382.7 nm | Down to 350nm |
| Chlorophyll c² | 395.5 nm | Down to 350nm |
| Peridinin | Absorbance hump between 325 & 350nm | |
| Diadinoxanthin | * | Down to 300nm |
| Diatoxanthin | * | Down to 325nm |
| Dinoxanthin | * | Down to 350nm |
| -carotene | * | Down to 325nm |
Additionally, pigments in zooxanthellae (MAAs, or mycosporine-like amino acids) protect zooxanthellae against ultraviolet radiation do so only up to about 340 nm. If the energy of UV-A light between 340 nm and 380 nm is absorbed by photopigments, but not used in photosynthesis, how else would it be dissipated? See Table 11.
| Mycosporine-like Amino Acids | Maximum Absorption |
|---|---|
| Mycosporine-Glycine | 310 nm |
| Palythine Serine Sulfate | 320 nm |
| Palythine Serine | 320 nm |
| Palythine | 320 nm |
| Mycosporine-NMA: Serine | 325 nm |
| Mycosporine-NMA: Threonine | 328 nm |
| Mycosporine -2: Glycine | 331 nm |
| Palythinol | 332 nm |
| Phorphyra | 334 nm |
| Shinorine | 334 nm |
However, there is little doubt that very strong doses of UV-A sometimes seen in aquaria (through use of unshielded metal halide or mercury vapor lamps) can be harmful. See here for details:
http://www.advancedaquarist.com/2004/8/aafeature
Although these results were generated through use of LEDs, it is possible that they could be applied to other light sources, such as metal halide and fluorescent lamps, especially those with high kelvin ratings.
These results will likely generate some debate. There are certainly limitations in the experimental protocol, in particular the short-term exposure to a specific light source (less than 2 hours with each LED.) However, water motion was standardized and food consumption (or lack thereof) was not an issue – a potential pitfall for long-term light/coral growth studies.
Perhaps the real story here is the photo-protective responses (the xanthophyll cycle) of zooxanthellae to different light sources, especially red light. Why is there little, if any, protective cycling of xanthophylls when strong red light is used? Strong doses of red light can regulate zooxanthellae densities even to the point of bleaching (Kinzie et al., 1984). What are the long term effects of red light on captive corals? This deserves investigation, and will be the subject of a future report.
Materials and Methods

Figure 31. This sensor slightly underreports violet wavelengths (~400-420nm) and red wavelengths (~690-700nm). After information on Li-Cor’s website.
Light intensity was measured with a Li-Cor BioSciences’ LI-1400 data logger and 2-pi cosine-corrected LI-189 underwater quantum sensor (Li-Cor, Lincoln, Nebraska, USA). This instrument is among the gold standards for measuring photosynthetically active radiation (PAR). The approximate response of this sensor is shown in Figure 31.
Corrections were made to the PPFD measurements of the UV and 420nm LED fixtures since they produce substantial amounts of radiation in the ultraviolet range. Using information supplied by the Ocean Optics spectrometer (described below), the correction was 6% for the 420nm LEDs, and ~40% for the Ultraviolet LEDs.
Spectral data were gathered by an Ocean Optics spectrometer and SpectraSuite software (Ocean Optics, Dunedin, Florida, USA). The fiber optic patch cord was held at a 45 angle (through use of a jig) to a 99% diffuse reflectance standard (Spectralon, manufactured by Labsphere, North Sutton, New Hampshire, USA). The spectrometer’s signal was corrected for electrical dark, with a boxcar setting of 2, and integration time of 66 milliseconds. Fifty measurements were averaged to ensure stable readings. Graphical displays (such as Figure 2) were cut and pasted into this Micro Soft Word document. Tabular data were exported to a proprietary Micro Soft Excel program for further analyses and graphed (such as Figures 3 and 4.)

Figure 32. Labsphere’s Spectralon reflectance standard (left) and sectioned coral skeleton (right.) The spectrometer’s patch cord, angled at 45, measures spectral quality.
Absorbances (such as Figure 2) were determined through use of the SpectraSuite software. Measurements were corrected for electrical dark, with a boxcar averaging of 2, and 50 measurements were averaged. The reference spectrum (produced by a clear 60-watt incandescent lamp ‘bounced’ off the Spectralon reference material), and dark reference were determined. The SpectraSuite calculated absorbance when commanded to do so. See Figure 32.
Photosynthesis data were determined through use of a Walz Junior-PAM (Pulse Amplitude Modulated) fluorometer (Walz GmbH, Effeltrich, Germany). Walz’s WinControl-3 software was programmed to measure the Yield of Photosystem II, and energy dissipation routes including NPQ (non-photosynthetic quenching by the xanthophyll cycle) and NO (quenching by other routes).
The Junior-PAM fluorometer exploits the relationships between competing processes for light energy. The energy can be used in photosynthesis, or dissipated as heat in a process called Non-Photochemical Quenching (NPQ) or Other Pathways (collectively called NO). Figure 34 details these relationships. In all cases, Photochemistry (called Yield of Photosystem II, or Y (II)), plus Y (NPQ) – where excessive energy is shunted away from the photosynthetic apparatus by the Xanthophyll Cycle) – and Y (NO), where energy is diverted in ways other than NPQ = 1. In short,
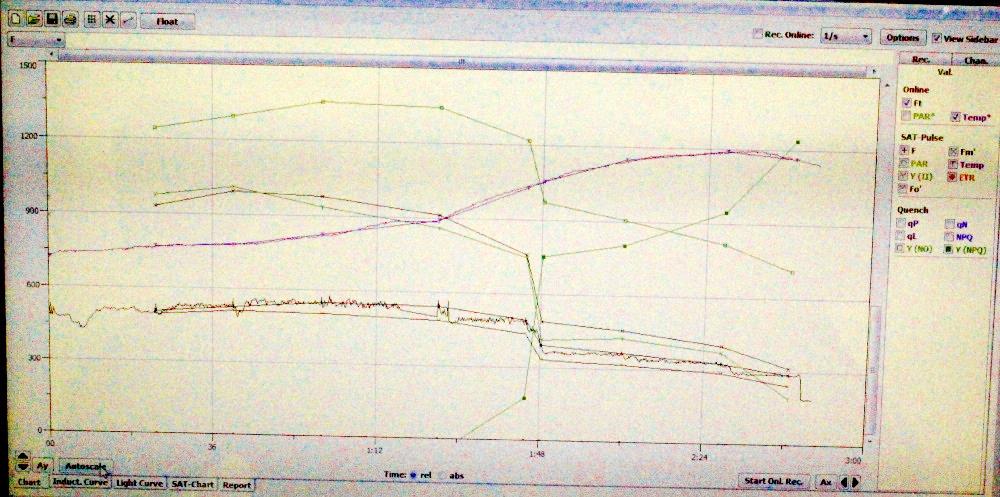
Figure 33. A screen shot of Walz’s WinControl-3 as it processes multiple data points to estimate how light promotes photosynthesis in zooxanthellae.
Y(II) + Y(NPQ) + Y(NO) = 1
LED fixtures supplied the light in these experiments (except for the black light experiment.) These have the advantages of supplying near-monochromatic light while generating very little heat (a real plus when working with corals in small amounts of water. Low heat also prevents damage to the fluorometer’s fiber optic cord.) These LED units are available through Build My LED, Austin, Texas, USA (www.buildmyled.com).
A small fragment of a Porites corals (tentatively identified as Porites lobata) was placed in a plastic container containing 2 gallons of artificial sea water. A specially built jig held the lamps above the container, and light intensity was adjusted through adjusting the height of the fixture above the container, or by a dimmer. Consistent water motion was maintained through use of a magnetic stirrer and stir bar. The PAM fluorometer’s fiber optic cord was held ~1mm from the coral’s surface at a 60 angle by a jig built specifically for the purpose. Temperature and pH were monitored through use of a datalogger (Hach HQ40d multimeter and pH probe).
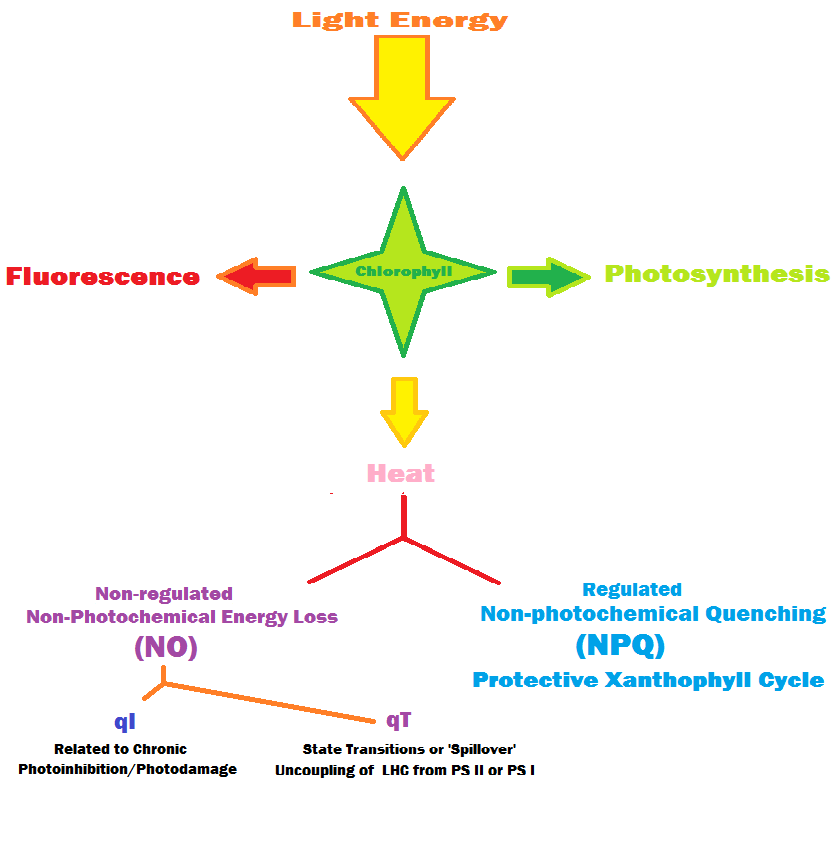
Figure 34. Energy pathways in photosynthesis.
The coral was allowed to dark-acclimate overnight before minimum chlorophyll fluorescence (Fo) and maximum fluorescence (Fm – through application of a photosynthetically-saturating pulse of light) were determined. The coral was then exposed to light intensities that were incrementally adjusted upwards, and Fm’ (maximum chlorophyll fluorescence while illuminated) measurements were made 15-20 minutes after light intensity was increased. Yields of Photochemistry, Non-Photochemical Quenching (of chlorophyll fluorescence) and NO (other energy dissipation pathways) were determined. When the Yield of any of these processes is multiplied by the light intensity level (PPFD, or Photosynthetic Photon Flux Density, as determined by a PAR meter), we can arrive at an estimate of the relative electron flow from Photosystem II to Photosystem I. The electron flow is called ETR for Electron Transport Rate. Since we did not measure the amount of light actually absorbed by the coral and its symbionts, this is called the Relative ETR, or rETR. The coral’s zooxanthellae were allowed to acclimate to darkness for 20-30 minutes after each round of testing.
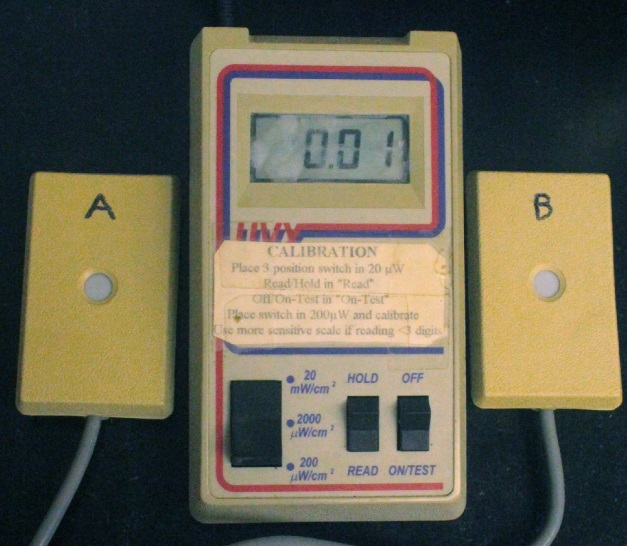
Figure 35. This radiometer reports UV-A or UV-B radiation intensity in units of microWatts per square centimeter (µW·cm².)
Data were exported from Walz’s WinControl-3 software to Micro Soft Excel for further processing and charting.
Measurements of ultraviolet radiation were made by a UV radiometer (Model UVX, manufactured by UVP, LLC, Upland, California, USA) equipped with a UV-A sensor (recommended for measurements at 365nm, with a sensitivity bandwidth of 335-380nm). Ultraviolet-B radiation was measured with a sensor made for measurements of radiation at 310nm, with a sensitivity bandwidth of 280-340nm. See Figure 35.
Acknowledgements
The author wishes to thank Nick Klase of Build My LED (www.buildmyled.com) for donating the LED fixtures used in these experiments. These experiments would have been impossible (or at least much more difficult) to perform without them.
References
- Braddock, B., S. Mercer, C. Rachelson and S. Sapp, 2001. Effects of red and blue light on the rate of photosynthesis. http://spot.colorado.edu/~basey/bluer.htm
- Dring, M., and K. Luning, 1985. Emerson enhancement effect and quantum yield of photosynthesis for marine macroalgae in simulated underwater light fields. Mar. Biol., 87(2): 109-117.
- Gil-Turnes, S. and J. Corredor, 1981. Studies of photosynthetic pigments of zooxanthellae in Caribbean hermatypic corals. Proc. 4th Int. Coral Reef Symp., Manila. 2: 51-53.
- Hill, R., A. Larkum, O. Prasil, D. Kramer, M. Szabo, V. Kumar, and P.J. Ralph, 2012. Light-induced dissociation of antenna complexes in the symbionts of scleractinian corals correlates with sensitivity to coral bleaching. Coral Reefs, 31(4): 963-975.
- Jeffrey, S., R. Mantoura, and S. Wright (Editors), 1997. Phytoplankton Pigments in Oceanography, Guidelines to Modern Methods. UNESCO Publishing, Paris. 668 pp.
- Kinzie, R., P. Jokiel, and R. York, 1984. Effects of light of altered spectral composition on coral zooxanthellae associations and on zooxanthellae in vitro. Mar. Biol., 78: 239-248.
- Kirk, J.T.O., 2000. Light and Photosynthesis in Aquatic Ecosystems. Cambridge University Press, Cambridge, U.K. 509 pp.
- Telfer, A., 2002. What is beta-carotene doing in the photosystem II reaction centre? Phil. Trans. R. Soc. Lon. B. Biol. Sci., 357(1426): 1431-1439.
- Trocine, R., J. Rice, and G. Wells, 1982. Photosynthetic response of seagrasses to ultraviolet-A radiation and the influence of visible light intensity. Plant Physiol., 69, 341-344.
- Wijgerde, T., A. van Melis, C. Silva, M. Leal, L. Vogels, C. Mutter, and R. Osinga, 2014. Red light represses the photophysiology of the scleractinian coral Stylophora pistillata. Plos ONE 9(3): e92781. Doi:10.1371/journal pone.0092781
0 Comments